. 2019 Apr 23;10(1):1848.
doi: 10.1038/s41467-019-09755-0.

YAP-independent mechanotransduction drives breast cancer progression

Affiliations

YAP-independent mechanotransduction drives breast cancer progression

Joanna Y Lee et al. Nat Commun. .

Abstract

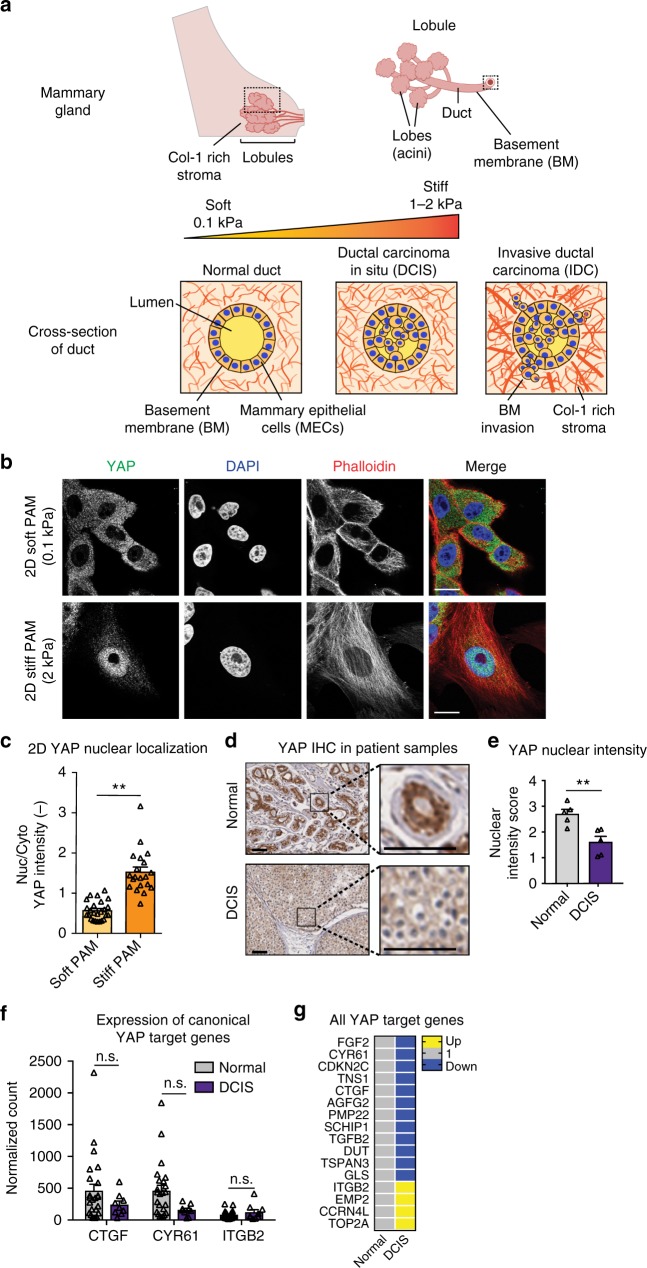
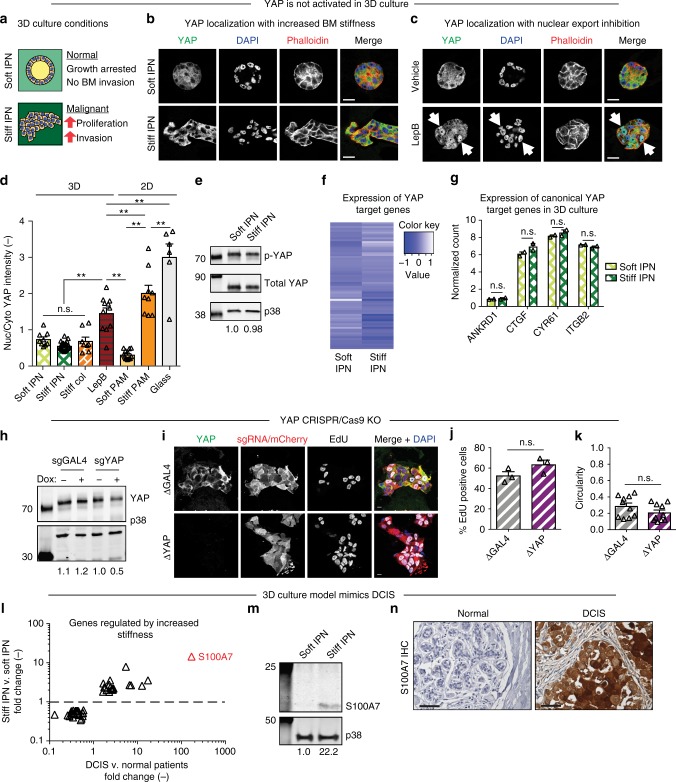
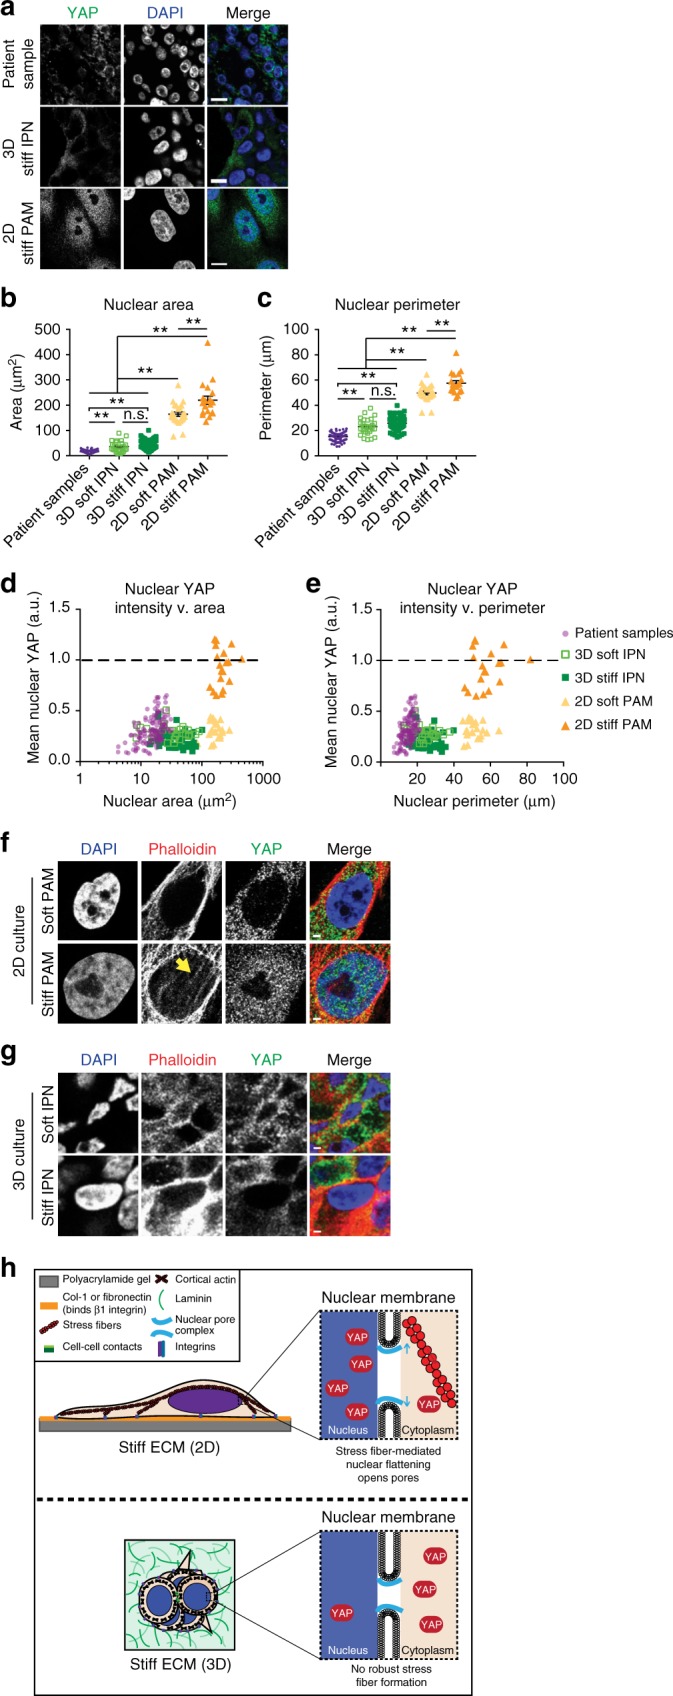
Increased tissue stiffness is a driver of breast cancer progression. The transcriptional regulator YAP is considered a universal mechanotransducer, based largely on 2D culture studies. However, the role of YAP during in vivo breast cancer remains unclear. Here, we find that mechanotransduction occurs independently of YAP in breast cancer patient samples and mechanically tunable 3D cultures. Mechanistically, the lack of YAP activity in 3D culture and in vivo is associated with the absence of stress fibers and an order of magnitude decrease in nuclear cross-sectional area relative to 2D culture. This work highlights the context-dependent role of YAP in mechanotransduction, and establishes that YAP does not mediate mechanotransduction in breast cancer.


Conflict of interest statement

L.S.Q. received sponsored research support from Tencent America Inc. and is a co-founder and stock shareholder of Refuge Biotechnologies. The remaining authors declare no competing interests.

Figures

Fig. 1
Fig. 1
YAP is not activated during DCIS. a Schematic of ductal carcinoma progression. b MCF10A cells seeded on col-1-coated PAM gels. Bars: 10 µm. c YAP quantification from 2D gels. **p < 0.0001, one-way ANOVA followed by Tukey post hoc comparison tests, symbols represent each cell, n = 9–14 cells per hydrogel. d YAP staining in primary tissues. Bars: 50 µm. e Quantification of YAP IHC intensity. **p < 0.01, unpaired t test, symbols represent each patient sample, n = 5 normal and 5 DCIS patients. Expression of f canonical and g all YAP target genes in patient samples. n.s. not significant, one-way ANOVA followed by Tukey post hoc comparison tests, symbols represent each patient sample, n = 24 normal and 9 DCIS patients. All bar charts display mean ± SEM. All measurements were taken from distinct samples
Fig. 2
Fig. 2
Lack of YAP activation with enhanced 3D culture stiffness. a Effects of 3D culture stiffness. b MCF10A cells encapsulated in 3D hydrogels. c Encapsulated cells treated with Leptomycin B (LepB). Arrows indicate nuclei with YAP. Bars: 20 µm. d YAP quantification from 3D and 2D (control) culture conditions. **p < 0.05, one-way ANOVA followed by Tukey post hoc comparison tests, symbols represent each cell, n = 6–24 cells per hydrogel, bars represent mean ± SEM. Measurements were taken from distinct samples. e Western blot analysis of p-YAP (S127) from 3D culture. p38 was used as a loading control. Quantification of bands (p-YAP/total YAP/p38) below each lane. f RNA-seq of YAP target genes (as identified by Dupont et al., 2011) in 3D culture. g RNA-seq of canonical YAP target genes in 3D culture. n.s. not significant, unpaired two-sided t test, symbols represent each hydrogel, n = 2 hydrogels, bars represent mean ± SD. Measurements were taken from distinct samples. h Western blot analysis of dox-inducible MCF10A::Cas9/sgGAL4 or sgYAP cells. Quantification of bands (YAP/p38) below each lane. i CRISPR/Cas9 cells encapsulated with dox. Bars: 10 µm. j Proliferation of cells from i. k Invasiveness of cells from i as measured by cell cluster circularity. Only cells verified by IF for KO were assayed. l Set of genes regulated by enhanced stiffness in IPNs also upregulated in DCIS patient samples. Symbols represent individual genes. Most highly enriched gene (S100A7) highlighted in red. m Western blot analysis of cells from 3D culture for S100A7. Quantification of bands (S100A7/p38) indicated below each lane. n S100A7 staining in primary tissue. Bars: 50 µm
Fig. 3
Fig. 3
Nuclear morphologies are distinct between 2D and 3D culture and in vivo. a Images of nuclear morphologies and YAP. Bars: 10 µm. b Areas and c perimeters of nuclei. **p < 0.005, one-way ANOVA followed by Tukey post hoc comparison tests, symbols represent each cell, n = 19–132 nuclei per condition, lines display mean ± SEM. Measurements were taken from distinct samples. Patient samples from five DCIS patients. YAP intensity with nuclear d area and e perimeter. Values normalized by positive controls within each sample. Dotted line represents positive nuclear YAP. Purple dots: patient samples; light green squares: 3D soft IPN; filled dark green squares: 3D stiff IPN; filled light orange triangles: 2D soft PAM; filled orange triangles: 2D stiff PAM. F-actin staining in f 2D or g 3D culture. Arrow indicates perinuclear stress fibers. Bars: 2 µm. h Model of stiffness-induced YAP localization in 2D vs. 3D

References

    1. Boyd NF, Lockwood GA, Byng JW, Tritchler DL, Yaffe MJ. Mammographic densities and breast cancer risk. Cancer Epidemiol. Biomarkers Prev. 1998;7:1133–1144. - PubMed
    1. Martin LJ, Boyd NF. Mammographic density. Potential mechanisms of breast cancer risk associated with mammographic density: hypotheses based on epidemiological evidence. Breast. Cancer Res. 2008;10:201. doi: 10.1186/bcr1831. - DOI - PMC - PubMed
    1. McConnell JC, et al. Increased peri-ductal collagen micro-organization may contribute to raised mammographic density. Breast Cancer Res. 2016;18:5. doi: 10.1186/s13058-015-0664-2. - DOI - PMC - PubMed
    1. Levental KR, et al. Matrix crosslinking forces tumor progression by enhancing integrin signaling. Cell. 2009;139:891–906. doi: 10.1016/j.cell.2009.10.027. - DOI - PMC - PubMed
    1. Acerbi I, et al. Human breast cancer invasion and aggression correlates with ECM stiffening and immune cell infiltration. Integr. Biol. 2015;7:1120–1134. doi: 10.1039/c5ib00040h. - DOI - PMC - PubMed

Publication types

MeSH terms