. 2019 Apr 23;10(1):1916.
doi: 10.1038/s41467-019-09801-x.

Adenosine receptor agonism protects against NETosis and thrombosis in antiphospholipid syndrome

Affiliations

Adenosine receptor agonism protects against NETosis and thrombosis in antiphospholipid syndrome

Ramadan A Ali et al. Nat Commun. .

Abstract

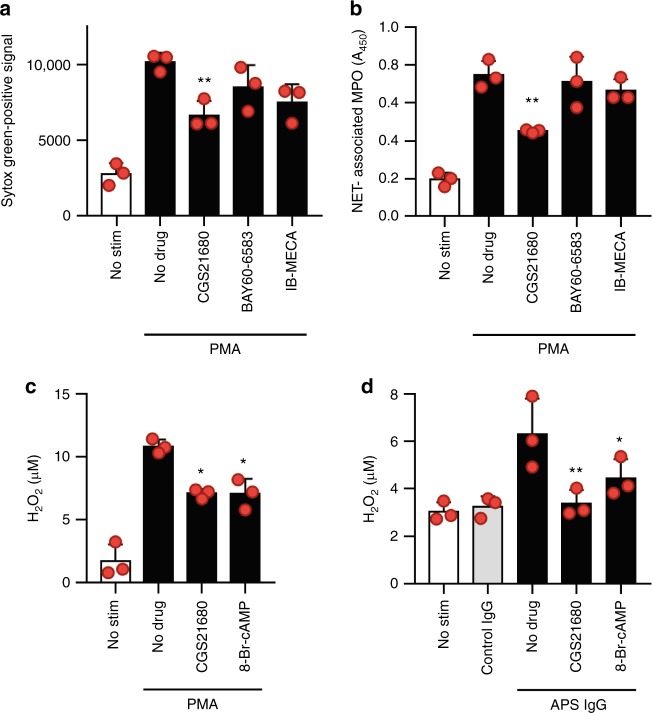
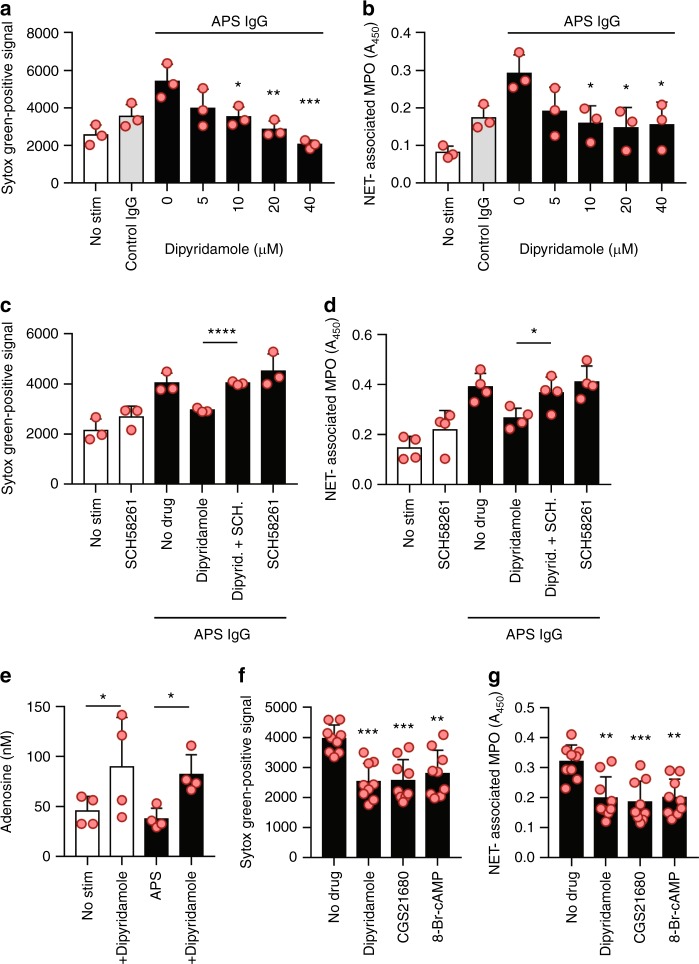
Potentiation of neutrophil extracellular trap (NET) release is one mechanism by which antiphospholipid antibodies (aPL Abs) effect thrombotic events in patients with antiphospholipid syndrome (APS). Surface adenosine receptors trigger cyclic AMP (cAMP) formation in neutrophils, and this mechanism has been proposed to regulate NETosis in some contexts. Here we report that selective agonism of the adenosine A2A receptor (CGS21680) suppresses aPL Ab-mediated NETosis in protein kinase A-dependent fashion. CGS21680 also reduces thrombosis in the inferior vena cavae of both control mice and mice administered aPL Abs. The antithrombotic medication dipyridamole is known to potentiate adenosine signaling by increasing extracellular concentrations of adenosine and interfering with the breakdown of cAMP. Like CGS21680, dipyridamole suppresses aPL Ab-mediated NETosis via the adenosine A2A receptor and mitigates venous thrombosis in mice. In summary, these data suggest an anti-inflammatory therapeutic paradigm in APS, which may extend to thrombotic disease in the general population.


Conflict of interest statement

The authors declare no competing interests.

Figures

Fig. 1
Fig. 1
Cyclic AMP (cAMP) suppresses NETosis in response to APS IgG. Neutrophils were isolated from healthy volunteers and then treated with either control IgG or APS IgG (pooled from four patients with primary APS) for 3 h. Some samples were additionally treated with 8-Br-cAMP at various concentrations. In panel a, total extracellular DNA was measured as relative fluorescence units upon the addition of Sytox Green. In panel b, an independent set of experiments was performed, with NETosis quantified by measuring the enzymatic activity of nuclease-liberated myeloperoxidase (MPO). Mean and standard deviation are presented for n = 3 independent experiments; *p < 0.05 as compared with the 0 µM group by one-way ANOVA corrected with Dunnett’s test. c NETosis was assessed qualitatively by immunofluorescence microscopy. 8-Br-cAMP = 1 µM, blue = DNA, green = extracellular neutrophil elastase, and scale bar = 100 microns. d Neutrophils were treated with either control IgG or APS IgG. Forskolin and PDE4 inhibitor were additionally added to some samples. NETosis was quantified by the enzymatic activity of nuclease-liberated MPO; *p < 0.05 and **p < 0.01 by one-way ANOVA corrected with Sidak’s test
Fig. 2
Fig. 2
Agonism of the adenosine A2A receptor suppresses NETosis. a, b Neutrophils were isolated from healthy volunteers and then treated with either control IgG or APS IgG for 3 h. Some samples were additionally treated with agonists of the adenosine A2A receptor (CGS21680), A2B receptor (BAY60-6583), or A3 receptor (IB-MECA) as indicated. In panel a, total extracellular DNA was measured as relative fluorescence units upon the addition of Sytox Green. In panel b, an independent set of experiments was performed, with NETosis quantified by measuring the enzymatic activity of nuclease-liberated myeloperoxidase (MPO). Mean and standard deviation are presented for n = 3 independent experiments; *p < 0.05 as compared with the APS IgG/no-drug group by one-way ANOVA corrected with Sidak’s test. c NETosis was assessed qualitatively by immunofluorescence microscopy. Blue = DNA, green = extracellular neutrophil elastase, and scale bar = 100 microns. d, e Neutrophils were treated with affinity-purified anti-β2GPI IgG (black bars) in the presence or absence of the A2A receptor agonist. Extracellular DNA (d) or NETs (e) were quantified as above. Mean and standard deviation are presented for n = 3 independent experiments; **p < 0.01 as compared with the no-drug group by one-way ANOVA corrected with Dunnett’s test. f Neutrophils were treated with APS IgG (black bars) in the presence of a protein kinase A inhibitor (PKAi) or an inhibitor of the exchange protein activated by cyclic-AMP pathway (EPACi) as indicated, and NETs were quantified. Mean and standard deviation are presented for n = 3 independent experiments; *p < 0.05
Fig. 3
Fig. 3
An adenosine A2A receptor agonist suppresses reactive oxygen species (ROS). a, b Neutrophils were isolated from healthy volunteers and then treated with PMA for 3 h. Some samples were additionally treated with agonists of the adenosine A2A receptor (CGS21680), A2B receptor (BAY60-6583), or A3 receptor (IB-MECA). In panel a, total extracellular DNA was measured as relative fluorescence units upon the addition of Sytox Green. In panel b, an independent set of experiments was performed, with NETosis quantified by measuring the enzymatic activity of nuclease-liberated myeloperoxidase (MPO). Mean and standard deviation are presented for n = 3 independent experiments; **p < 0.01 as compared with the PMA/no-drug group by one-way ANOVA corrected with Dunnett’s test. c, d Neutrophils were treated with PMA, control IgG, or APS IgG in the presence or absence of the A2A receptor agonist or 8-Br-cAMP for 1 h. Hydrogen peroxide formation was measured by a colorimetric assay. Mean and standard deviation are presented for n = 3 independent experiments; *p < 0.05 and **p < 0.01 as compared with the PMA-alone group (c) or APS-IgG-alone group (d) bye one-way ANOVA corrected with Dunnett’s test
Fig. 4
Fig. 4
Dipyridamole suppresses NETosis via activation of the adenosine A2A receptor. a, b Neutrophils were isolated from healthy volunteers and then treated with either control IgG or APS IgG for 3 h. Some samples were additionally treated with dipyridamole as indicated. In panel a, total extracellular DNA was measured as relative fluorescence units upon the addition of Sytox Green. In panel b, an independent set of experiments was performed, with NETosis quantified by measuring the enzymatic activity of nuclease-liberated myeloperoxidase (MPO). Mean and standard deviation are presented for n = 3 independent experiments; *p < 0.05, **p < 0.01, and ***p < 0.001 as compared with the 0 µM group by one-way ANOVA corrected with Dunnett’s test. c, d Neutrophils were treated with APS IgG in the presence of different combinations of dipyridamole and the A2A receptor antagonist SCH58261. Extracellular DNA (c) or NETs (d) were quantified as above. Mean and standard deviation are presented for n = 3 independent experiments; *p < 0.05 and **p < 0.01 by one-way ANOVA. e Neutrophils were treated with APS IgG (black bars) and dipyridamole as indicated. Adenosine was quantified in culture supernatants. Mean and standard deviation are presented for n = 4 independent experiments; *p < 0.05 by one-way ANOVA corrected with Sidak’s test. f, g Neutrophils were isolated from patients with primary APS and immediately placed in culture. Some samples were additionally treated with drugs as indicated. Extracellular DNA (f) or NETs (g) were quantified as above. Mean and standard deviation are presented for n = 9 patients; **p < 0.01 and ***p < 0.001 as compared with the no-drug group by one-way ANOVA corrected with Dunnett’s test
Fig. 5
Fig. 5
Agonism of the adenosine A2A receptor mitigates venous thrombosis in control mice. a Neutrophils were prepared from the bone marrow of C57BL/6 mice and then treated with control IgG or APS IgG. Some samples were additionally treated with CGS21680. NETosis was quantified by immunofluorescence microscopy. Mean and standard deviation are presented for n = 3 independent experiments; ***p < 0.001 by one-way ANOVA corrected with Sidak’s test. b Schematic of the flow-restriction model of venous thrombosis. The inferior vena cava is narrowed by fixing a ligature around the IVC (using a spacer, which is then removed). When a thrombus forms, it is just caudal to the stenosis in the area indicated by the spiral. Thrombus formation was assessed at 48 h for all of the following experiments. ce Thrombus incidence (c), thrombus weight (d), and thrombus length (e) were assessed for C57BL/6 wild-type mice subjected to the flow-restriction model. Some mice were treated with the adenosine A2A receptor agonist CGS21680 as indicated. Each data point represents a unique mouse, while horizontal lines denote mean values; *p < 0.05 and **p < 0.01 as compared with the control group (Chi-square test for panel c and unpaired t-test for panels d and e). f Plasma NETs were measured by myeloperoxidase (MPO)-DNA ELISA 48 h after flow restriction; *p < 0.05 as compared with the control group. gi Thrombus incidence (g), thrombus weight (h), and thrombus length (i) were assessed for mice subjected to the flow-restriction model. Some mice were treated with dipyridamole as indicated; *p < 0.05 as compared with the control group (Chi-square test for panel g and unpaired t-test for panels h and i). j Plasma NETs were measured by myeloperoxidase (MPO)-DNA ELISA 48 h after flow restriction; *p < 0.05 as compared with the control group by unpaired t-test
Fig. 6
Fig. 6
Agonism of the adenosine A2A receptor mitigates venous thrombosis in APS mice. ad Thrombus incidence (b), thrombus weight (c), and thrombus length (d) were assessed for mice subjected to the flow-restriction model (a). Here, mice were additionally treated with APS IgG as described in Methods. Each data point represents a unique mouse, while horizontal lines denote mean values; **p < 0.01 and ***p < 0.001 as compared with the control group (Chi-square test for panel b and unpaired t-test for panels c, d). e Schematic of the electrolytic model of venous thrombosis. Direct current results in the release of free radicals within the IVC, which activate endothelial cells and initiate a thrombogenic environment in the presence of constant blood flow. Thrombus formation was assessed at 24 h for all of the following experiments. f, g Thrombus size (f) and representative thrombi (g) for mice treated with control IgG or APS IgG as indicated. In this experiment, APS-1 through −4 represent unique patients. Each data point represents a unique mouse, while horizontal lines denote mean values; **p < 0.01 and ***p < 0.001 as compared with the control group by one-way ANOVA corrected with Dunnett’s test. The ruler denotes millimeters. h, i Thrombus size and plasma MPO-DNA complexes were determined for mice treated with various combinations of control IgG, APS IgG, and intravenous deoxyribonuclease (DNase) as indicated; ***p < 0.001 and ****p < 0.0001 as indicated by one-way ANOVA corrected with Sidak’s test (h) or Dunnett’s test (i). j, k Thrombus size and plasma MPO-DNA complexes were determined for mice treated with various combinations of APS IgG, CGS21680, and DNase as indicated; *p < 0.05, **p < 0.01, and ****p < 0.0001 as compared with the control group by one-way ANOVA corrected with Dunnett’s test. l, m Thrombus size and plasma MPO-DNA complexes were determined for mice treated with various combinations of APS IgG, dipyridamole, and DNase as indicated; *p < 0.05 and ***p < 0.001 as compared with the control group by one-way ANOVA corrected with Dunnett’s test

Comment in

Similar articles

Cited by

References

    1. Miyakis S, et al. International consensus statement on an update of the classification criteria for definite antiphospholipid syndrome (APS) J. Thromb. Haemost. 2006;4:295–306. doi: 10.1111/j.1538-7836.2006.01753.x. - DOI - PubMed
    1. Cervera R, et al. Antiphospholipid syndrome: clinical and immunologic manifestations and patterns of disease expression in a cohort of 1,000 patients. Arthritis Rheum. 2002;46:1019–1027. doi: 10.1002/art.10187. - DOI - PubMed
    1. Gomez-Puerta JA, Cervera R. Diagnosis and classification of the antiphospholipid syndrome. J. Autoimmun. 2014;48-49:20–25. doi: 10.1016/j.jaut.2014.01.006. - DOI - PubMed
    1. Abreu MM, et al. The relevance of “non-criteria” clinical manifestations of antiphospholipid syndrome: 14th International Congress on Antiphospholipid Antibodies Technical Task Force Report on Antiphospholipid Syndrome Clinical Features. Autoimmun. Rev. 2015;14:401–414. doi: 10.1016/j.autrev.2015.01.002. - DOI - PubMed
    1. Erkan D, et al. 14th International Congress on Antiphospholipid Antibodies: task force report on antiphospholipid syndrome treatment trends. Autoimmun. Rev. 2014;13:685–696. doi: 10.1016/j.autrev.2014.01.053. - DOI - PubMed

Publication types

MeSH terms