. 2019 Apr 23;10(1):1884.
doi: 10.1038/s41467-019-09713-w.

A DNMT3A PWWP mutation leads to methylation of bivalent chromatin and growth retardation in mice

Affiliations

A DNMT3A PWWP mutation leads to methylation of bivalent chromatin and growth retardation in mice

Gintarė Sendžikaitė et al. Nat Commun. .

Abstract

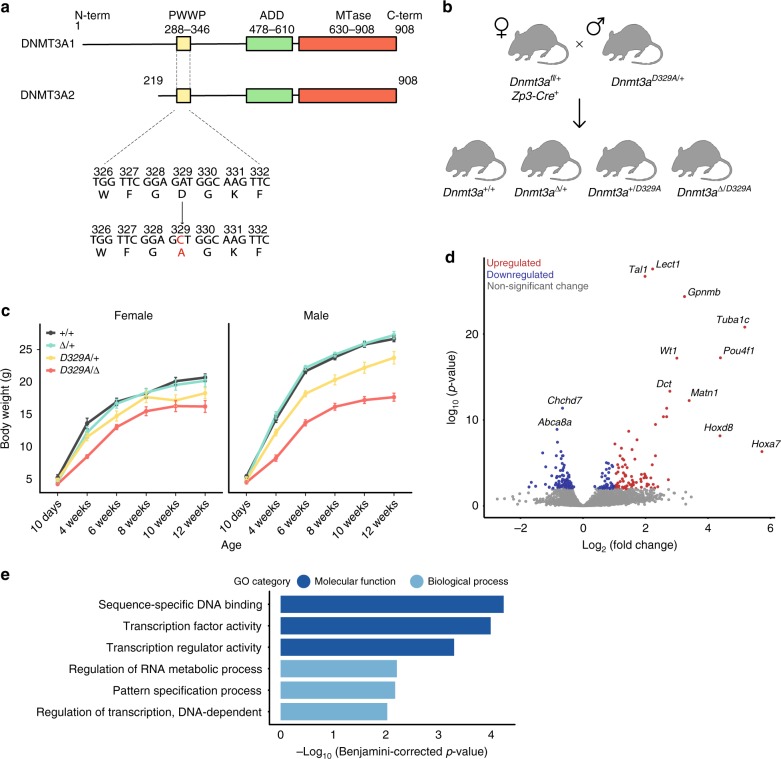
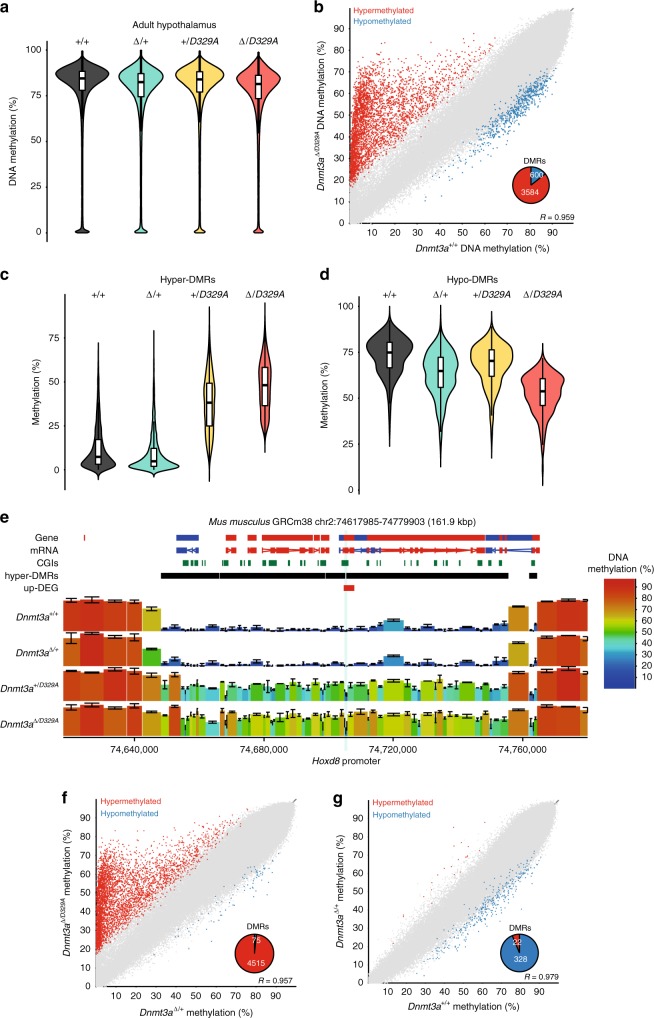
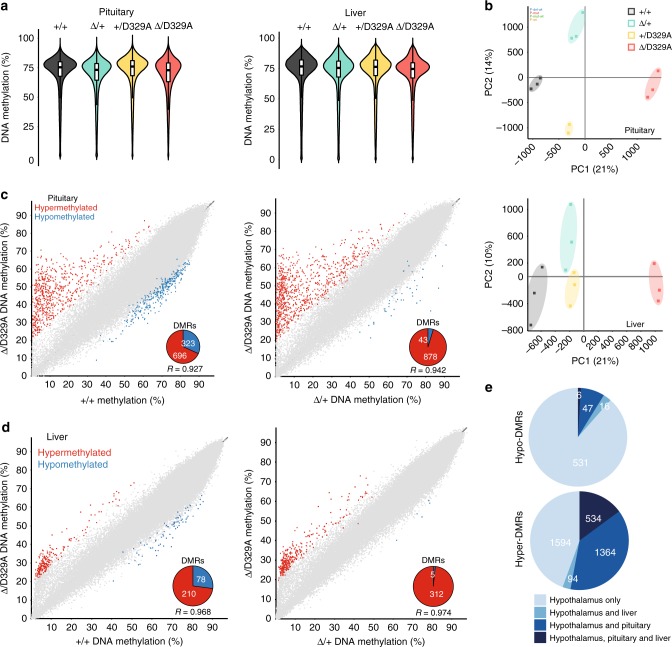
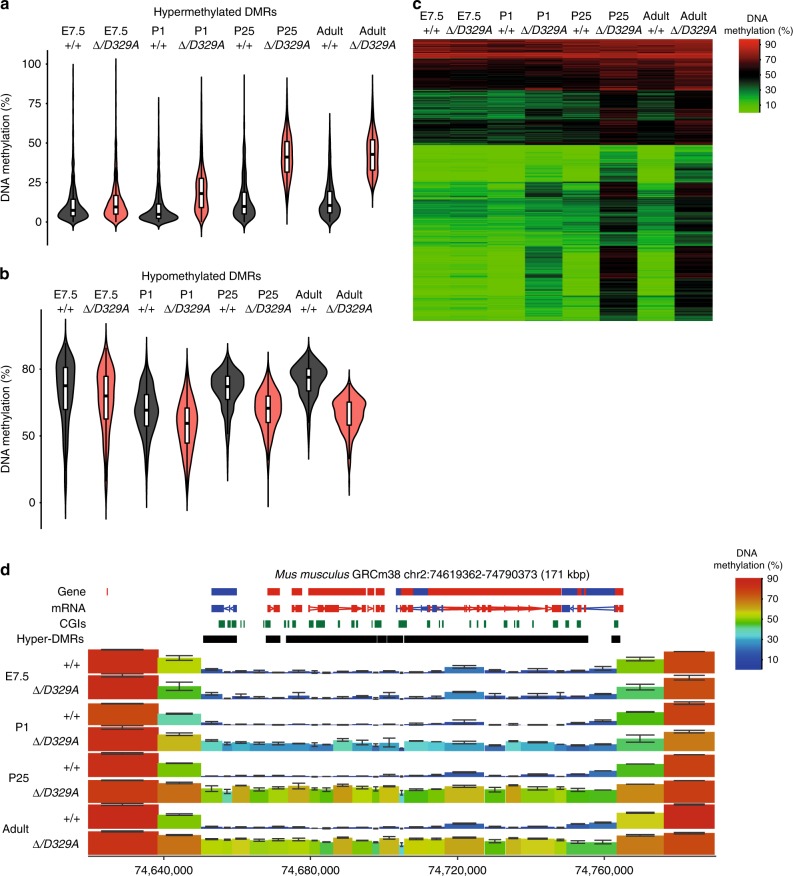
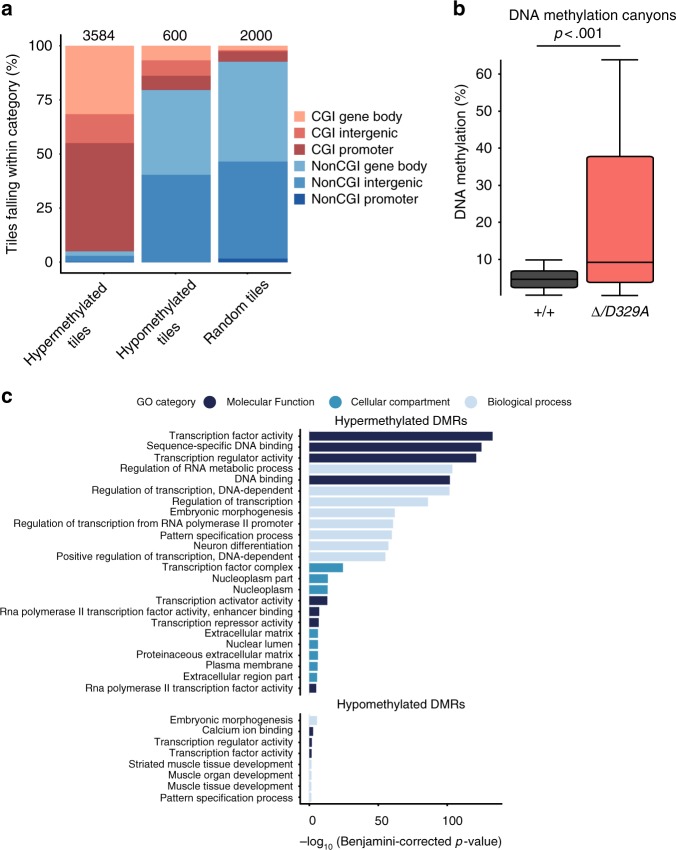
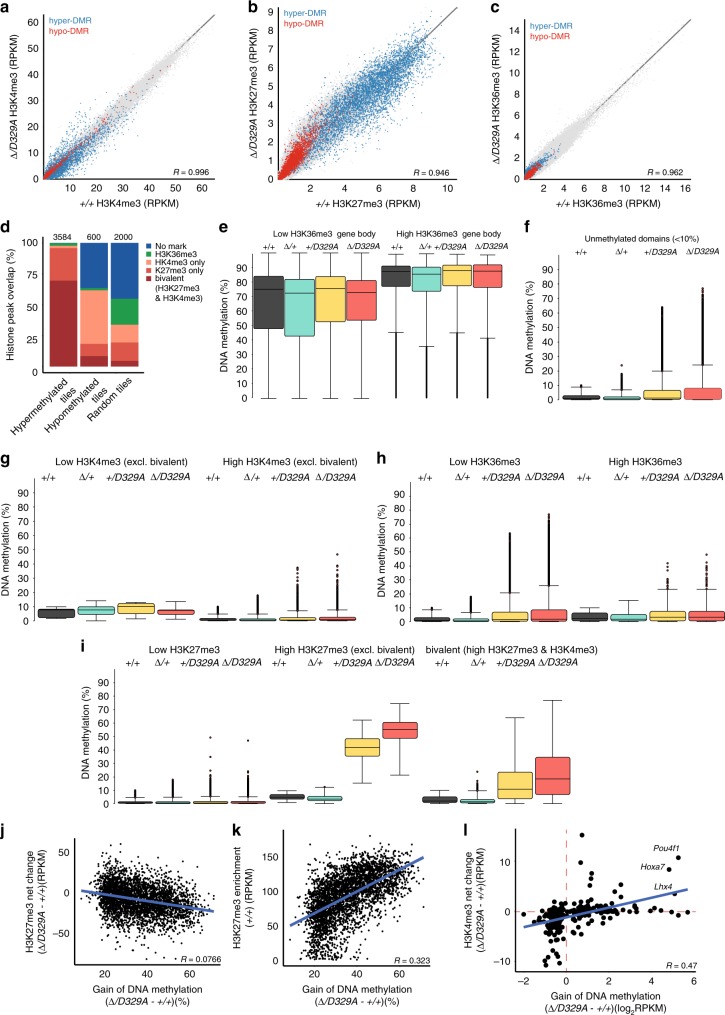
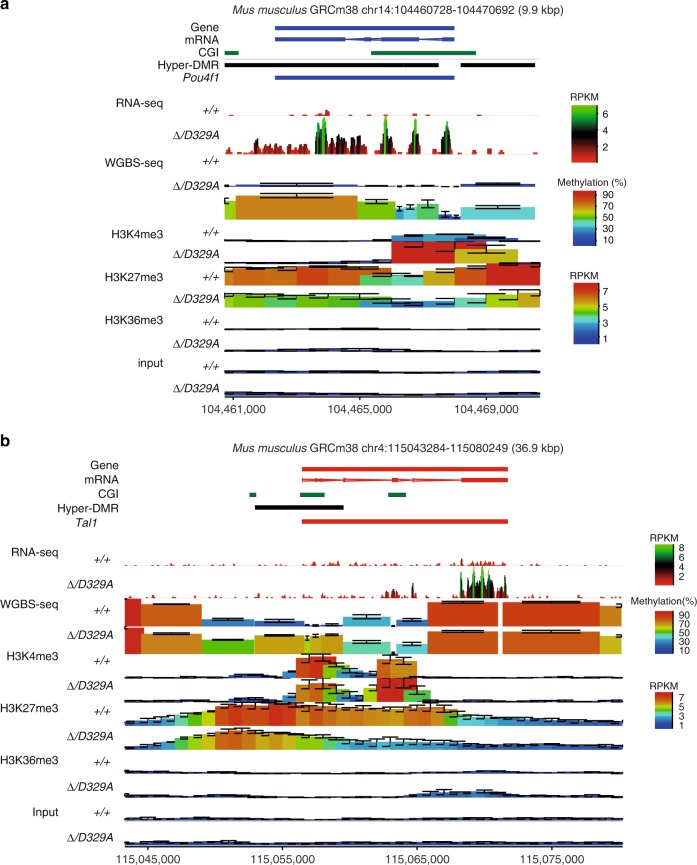
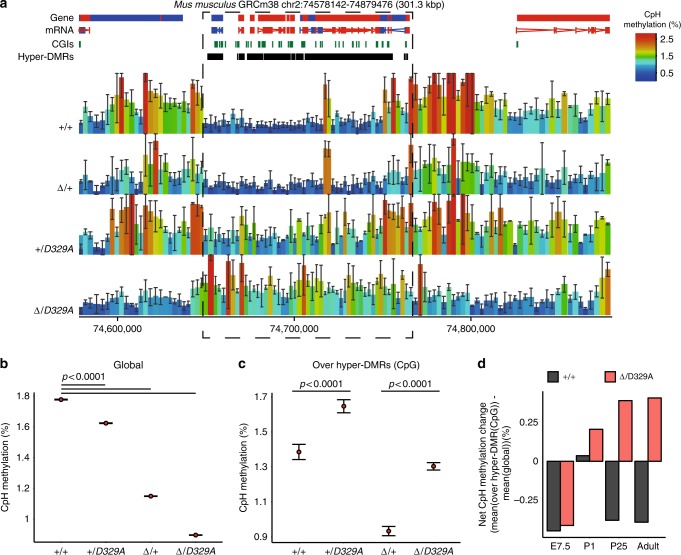
DNA methyltransferases (DNMTs) deposit DNA methylation, which regulates gene expression and is essential for mammalian development. Histone post-translational modifications modulate the recruitment and activity of DNMTs. The PWWP domains of DNMT3A and DNMT3B are posited to interact with histone 3 lysine 36 trimethylation (H3K36me3); however, the functionality of this interaction for DNMT3A remains untested in vivo. Here we present a mouse model carrying a D329A point mutation in the DNMT3A PWWP domain. The mutation causes dominant postnatal growth retardation. At the molecular level, it results in progressive DNA hypermethylation across domains marked by H3K27me3 and bivalent chromatin, and de-repression of developmental regulatory genes in adult hypothalamus. Evaluation of non-CpG methylation, a marker of de novo methylation, further demonstrates the altered recruitment and activity of DNMT3AD329A at bivalent domains. This work provides key molecular insights into the function of the DNMT3A-PWWP domain and role of DNMT3A in regulating postnatal growth.


Conflict of interest statement

The authors declare no competing interests.

Figures

Fig. 1
Fig. 1
Phenotypic description of mice carrying the Dnmt3aD329A allele. a Schematic representation of the DNMT3A protein isoforms and location of the base substitution, coloured red, introduced to generate the D329A mutation. NCBI IDs: CCDS36397.1, CCDS25784.1. Known domains are indicated by coloured boxes, based on the PROSITE database; numbers indicate amino acid residues. b Breeding scheme used to generate offspring of four different genotypes. +; wild-type allele; fl: Dnmt3a containing loxP sites surrounding exon 18; Δ: loxP sites after recombination leading to deletion of exon 18; Zp3-Cre: oocyte-specific Zp3 promoter-driven Cre recombinase,; D329A: a Dnmt3a allele point missense mutation in exon 8. c Growth curves indicating change in body weight of male and female mice of different genotypes over the indicated post-natal weeks. Mixed model ANOVA (KR-method) shows overall significant change dependent on genotype and time in both sexes (p < 0.001, df(males) = 15,229.48, df(females) = 15,142.15), F = 0). Subsequent pairwise Bonferroni-adjusted t-test comparisons show that Dnmt3aΔ/D329A males become significantly underweight at week 4 (p < 0.001), and Dnmt3a+/D329A at week 6 (p < 0.001). Dnmt3aΔ/D392A females become significantly underweight starting from week 4 (p = 0.002), with the exception of week 8 (p = 0.095). Dnmt3a+/D329A females do not show significant change. n values are given in Supplementary Table 3. Error bars indicate standard error of the mean. Raw data are provided in Source Data. d Volcano plot showing gene expression fold change and its significance between Dnmt3a+/+ and Dnmt3aΔ/D329A adult (14-week) hypothalamus. Differentially expressed genes were determined using DEseq (p < 0.01, Benjamini–Hochberg multiple comparisons correction). n(+/+) = 5, n(Δ/D392A) = 4. Selected genes showing the most significant and highest fold change are named. e Gene ontology (GO) analysis of differentially expressed genes; only significant terms are shown. Benjamini–Hochberg corrected p-value < 0.1 was used as a threshold
Fig. 2
Fig. 2
DNA methylation changes in mice carrying Dnmt3aD329A allele. a Beanplots indicating whole genome methylation levels in hypothalamus of adult (14 week, male) mice carrying the alleles shown. Boxplot shows median value and 25–75th percentiles, whiskers show lowest and highest observation, excluding outliers. Raw data are provided in Source Data. b Scatterplot showing correlation of methylation levels of individual tiles between Dnmt3a+/+ and Dnmt3aΔ/D329A mice. Differentially methylated probes were determined using the EdgeR proportion statistic in SeqMonk (p < 0.01 corrected for multiple comparisons using Benjamini–Hochberg, methylation difference ≥ 20%). Pie-chart indicates how many of DMRs are hyper-methylated or hypo-methylated in Dnmt3aΔ/D329A. n = 3 for each genotype. c, d Beanplots indicating DNA methylation levels over hypermethylated (c) and hypomethylated (d) DMRs. Boxplot shows median value and 25–75th percentiles, whiskers show lowest and highest observation, excluding outliers. Source data are listed in Supplementary Data 3. e Representative genome browser region showing the Hoxd hypermethylated domain. De-repressed gene Hoxd8 promoter region is shaded. For gene and mRNA tracks, the colour indicates direction, where red is a forward strand and blue is a reverse strand. Colour-coded blocks are tiles of 100-CpG positions. Error bars indicate standard deviation. f, g Scatterplots showing correlation between methylation levels of 100-CpG tiles in 14-week adult male hypothalamus of f Dnmt3aΔ/+ and Dnmt3aΔ/D329A, and g Dnmt3a+/+ and Dnmt3aΔ/+. Differentially methylated tiles were determined using the EdgeR proportion statistic in SeqMonk (p < 0.01 corrected for multiple comparisons using Benjamini-Hochberg, methylation difference ≥ 20%). The pie-chart indicates the number of DMRs identified. In ag, Hypo: hypomethylated, hyper: hypermethylated. Tiles of 100-CpG positions. n(+/+, Δ/+, Δ/D329A) = 3, n(+/D329A) = 2. CGI: CpG island, DMR: differentially methylated region
Fig. 3
Fig. 3
DNA methylation in adult pituitary and liver. a Beanplots indicating whole genome methylation levels in pituitary and liver of 14-week adult male mice carrying the alleles shown. Tiles of 300 CpG positions. Boxplot shows median value and 25–75th percentiles, whiskers show lowest and highest observation, excluding outliers. Raw data are provided in Source Data. b PCA plots showing clustering of individual pituitary and liver samples into separate distant groups based on the genotype. c, d Scatterplots showing correlation between methylation levels of individual 300-CpG tiles in 14-week adult male (c) pituitary and (d) liver between Dnmt3a+/+ and Dnmt3aΔ/D329A, and between Dnmt3aΔ/+ and Dnmt3aΔ/D329A. Differentially methylated tiles were determined using the EdgeR proportion statistic in SeqMonk (p < 0.01 corrected for multiple comparisons using Benjamini–Hochberg, methylation difference ≥ 20%). Pie-chart insets indicate how many of DMRs are hyper-methylated or hypo-methylated. e Pie charts showing how many hypo-methylated and hyper-methylated tiles in hypothalamus overlap the corresponding differentially methylated tiles in pituitary, liver or both. Pituitary and liver: tiles of 300-CpG position; hypothalamus: tiles of 100-CpG positions. In ad, n(pituitary, +/+, Δ/+, Δ/D329A) = 3, n(pituitary, +/D329A) = 2, n(liver) = 3
Fig. 4
Fig. 4
DNA methylation dynamics during development. a, b Beanplots indicating DNA methylation levels over hyper-methylated (a) and hypo-methylated (b) DMRs across development in Dnmt3a+/+ and Dnmt3aΔ/D329A mice. Tiles were quantified over adult hypothalamus DMRs, which were merged if the distance was <1 kb. Boxplots show median value and 25–75th percentiles, whiskers show lowest and highest observation, excluding outliers. Raw data are provided in Source Data. c Heatmap showing how methylation is gained at DMRs over time. Shown are 1915 300-CpG tiles, overlapping DMRs identified between Dnmt3a+/+ and Dnmt3aΔ/D329A in adult (14-week) hypothalamus. DMRs are clustered based on Euclidean method, on the basis of smallest absolute difference between quantitation values. Tiles of 300-CpGs. d Genome browser view of the Hoxd gene cluster indicating progressive gain in DNA methylation across the whole domain. For gene and mRNA tracks, the colour indicates direction, where red is a forward strand and blue is a reverse strand. CGI: CpG island, hyper-DMR: hypermethylated region identified in adult hypothalamus. Colour-coded blocks indicate tiles of 300-CpG positions. Error bars indicate standard deviation. In ad, E7.5 is epiblast, and P1, P25 and adult are hypothalamus. n(E7.5) = 4, n(P1, P25) = 2, n(adult) = 3
Fig. 5
Fig. 5
Features of regions aberrantly methylated by DNMT3AD329A. a Percentages of hypermethylated and hypomethylated tiles (100-CpG) falling within the genomic features indicated compared with a random set of 100-CpG tiles (Supplementary Data 14). n (tiles) indicated on top of the bars. CGI: CpG island. b Distribution of methylation values over DNA methylation canyon probes in Dnmt3a+/+ and Dnmt3aΔ/D329A mice. n = 779, Mann–Whitney test (p < 0.01, UA = 432,773, z = −14.57). Boxplots show median value and 25–75th percentiles, whiskers show lowest and highest observation, excluding outliers. Source data are provided in Supplementary Data 12. c GO analysis of genes overlapping differentially methylated tiles. Unless there were fewer significant terms, the top 8 most significant terms per category are shown. Benjamini–Hochberg corrected p-value < 0.01 was used as a threshold. DMR differentially methylated region
Fig. 6
Fig. 6
Link between H3 post-translational modifications and aberrant DNA methylation. ac Scatterplots showing correlation between enrichments for a H3K4me3; b H3K27me3; c H3K36me3 between Dnmt3a+/+ and Dnmt3aΔ/D329A hypothalamus, with the tiles overlapping hypermethylated (blue) and hypomethylated (red) DMRs indicated. n = 3 each genotype. Tiles of 2 kb with a step of 1 kb were used for analyses. d Percentages of hypermethylated and hypomethylated DMRs (100-CpG) that overlap bivalent (H3K4me3 and H3K27me3), H3K27me3 only, H3K4me3 only and H3K36me3 peaks, or regions with no mark. A random set of 100-CpG tiles (excluding DMRs) was used as a whole genome representative (Supplementary Data 14). n (tiles) indicated above each bar. H3K36me3 tiles that show overlap with H3K4me3 or H3K27me3 were included in the H3K36me3 group. Peaks were called using MACS peak caller in adult hypothalamus ChIP-seq. e DNA methylation levels over gene bodies marked by low or high levels of H3K36me3. DNA methylation quantified over individual gene bodies, excluding promoters. f DNA methylation levels across unmethylated genomic regions (<10% DNA methylation in wild-type hypothalamus) amongst different genotypes. g, h DNA methylation levels between genotypes over unmethylated regions overlapping low and high g H3K36me3 or h H3K4me3 marked chromatin. i DNA methylation levels between genotypes over unmethylated regions overlapping low, high H3K27me3, or both high H3K4me3 and high H3K27me3 (bivalent), marked chromatin. j Scatterplot showing the relationship between gain of DNA methylation in Dnmt3aΔ/D329A hypothalamus and change in enrichment of H3K27me3. Based on H3K27me3 enrichment difference over DMR tiles between Dnmt3a+/+ and Dnmt3a Δ/D329A adult hypothalamus. k Scatterplot showing relationship between gain of methylation in Dnmt3aΔ/D329A and initial levels of H3K27me3 enrichment. l Scatterplot showing relationship between change in gene expression and change in respective gene promoter H3K4me3 enrichment between Dnmt3a+/+ and Dnmt3a Δ/D329A adult hypothalamus. H3K4me3 enrichment was quantitated over gene promoters. In e, g, h, i Low level: bottom quintile (0–20%) of enrichment;high level: top quintile (80–100%) of enrichment. In ei, boxplots show median value and 25–75th percentiles, whiskers show lowest and highest observation, excluding outliers marked by individual points. Raw data are provided in Source Data. In gi, histone mark enrichments were quantitated over 100-CpG DMR tiles
Fig. 7
Fig. 7
Genomic landscape of de-repressed genes in Dnmt3a Δ/D329A hypothalamus. a, b Representative genome browser views of gene expression, DNA methylation, and distribution of H3K4me3, H3K27me3, and H3K36me3 marks (determined by ChIP-seq) in adult (14-week) male hypothalamus of Dnmt3a+/+ and Dnmt3aΔ/D329A genotypes. H3K4me3 and H3K36me3 are enriched over actively transcribed CGI promoters and gene bodies, respectively. H3K27me3 shows a broad enrichment over transcriptionally silent genes and loss of enrichment upon methylation gain. Genes a Pou4f1 and b Tal1 are up-regulated and hypermethylated in Dnmt3aΔ/D329A. CGI: CpG island, DMR: hypermethylated region. Each colour-coded block represents: a 50 bp window with 10 bp step size in the gene expression dataset; a 100-CpG window in the methylation dataset; and 2 kb window with 1 kb step size in the histone enrichment datasets. For gene and mRNA tracks, the colour indicates direction, where red is a forward strand and blue is a reverse strand. Error bars indicate standard deviation. n(+/+) = 5, n(Δ/D392A) = 4 for RNA-seq datasets; n = 3 for each genotype in WGBS-seq and ChIP-seq datasets
Fig. 8
Fig. 8
CpH methylation in hypothalamus of Dnmt3a+/+ and Dnmt3aΔ/D329A mice. a Representative genome browser view of CpH methylation in adult (14-week) male hypothalamus. Methylation levels appear to be dependent on the number of alleles present, with a decrease observed in Dnmt3a∆/+ compared to Dnmt3a+/+. Notably, there is an increase of methylation over hyper-DMR regions (highlighted by the box) in the presence of Dnmt3aD329A. Each bar represents a 1000-CpH tile. For gene and mRNA tracks, the colour indicates direction, where red is a forward strand and blue is a reverse strand. CGI: CpG island, hyper-DMR: hypermethylated region. n(+/+, Δ/+, Δ/D329A) = 3, n(+/D329A) = 2. Error bars indicate standard deviation. b Global mean CpH methylation values across different genotypes. c Mean CpH methylation values over DMRs with CpG hypermethylation. b, c 1000-CpH tile quantitation for chromosomes 2 and 11 was used as representative. Error bars indicate standard error of the mean. Pairwise comparisons were done using a two-tailed t-test. Raw data are provided in Source Data. d Barplot indicating the net difference in mean CpH methylation between hyper-DMRs and global levels for Dnmt3a+/+ and Dnmt3a Δ/D329A mice across development (E7.5 epiblast, P1, P25, and adult hypothalamus). Raw data are provided in Source Data
Fig. 9
Fig. 9
Model of molecular mechanisms acting at bivalent domains. a Representation of current understanding of bivalent domain regulation. The PRC2 complex deposits H3K27me3 and compacts chromatin across the promoters and surrounding regions of transcriptionally silent, developmental genes. TET proteins are recruited, which result in active removal of DNA methylation and protection of bivalent chromatin from de novo DNMTs. DNMT3A is recruited to bivalent chromatin shores through an unknown mechanism, enabling active establishment of DNA methylation at the boundaries,,. Through the competing actions of TETs and DNMT3A there is a cycle of DNA methylation turnover at the boundaries of bivalent domains. b Representation of bivalent chromatin dynamics in the presence of DNMT3AD329A. The mutant protein is able to access bivalent chromatin and establish methylation across the whole domain. The presence of DNA methylation appears to influence the local chromatin environment and results in reduction of H3K27me3, potentially due to exclusion of PRC2 from methylated DNA. As a consequence, some genes become de-repressed and show an increase in promoter H3K4me3, while others maintain their transcriptional silencing, this is likely dependent on the availability and strength of necessary transcription factors

Similar articles

Cited by

References

    1. Smith ZD, Meissner A. DNA methylation: roles in mammalian development. Nat. Rev. Genet. 2013;14:204–220. doi: 10.1038/nrg3354. - DOI - PubMed
    1. Yin Y, et al. Impact of cytosine methylation on DNA binding specificities of human transcription factors. Science. 2017;356:eaaj2239. doi: 10.1126/science.aaj2239. - DOI - PMC - PubMed
    1. Borgel J, et al. Targets and dynamics of promoter DNA methylation during early mouse development. Nat. Genet. 2010;42:1093–1100. doi: 10.1038/ng.708. - DOI - PubMed
    1. Jones PA. Functions of DNA methylation: islands, start sites, gene bodies and beyond. Nat. Rev. Genet. 2012;13:484–492. doi: 10.1038/nrg3230. - DOI - PubMed
    1. Smith ZD, et al. A unique regulatory phase of DNA methylation in the early mammalian embryo. Nature. 2012;484:339–344. doi: 10.1038/nature10960. - DOI - PMC - PubMed

Publication types

MeSH terms