. 2019 Apr 23;9(1):6430.
doi: 10.1038/s41598-019-42872-w.

The Na+/H+-Exchanger NHE1 Regulates Extra- and Intracellular pH and Nimodipine-sensitive [Ca2+]i in the Suprachiasmatic Nucleus

Affiliations

The Na+/H+-Exchanger NHE1 Regulates Extra- and Intracellular pH and Nimodipine-sensitive [Ca2+]i in the Suprachiasmatic Nucleus

Pi-Cheng Cheng et al. Sci Rep. .

Abstract

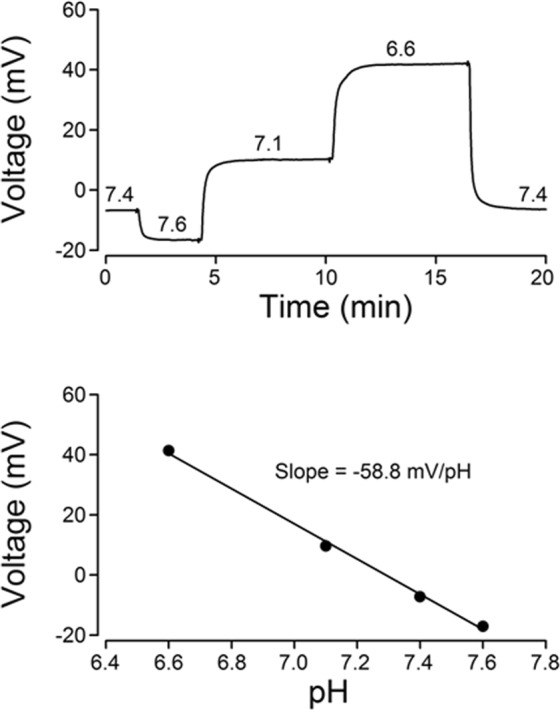
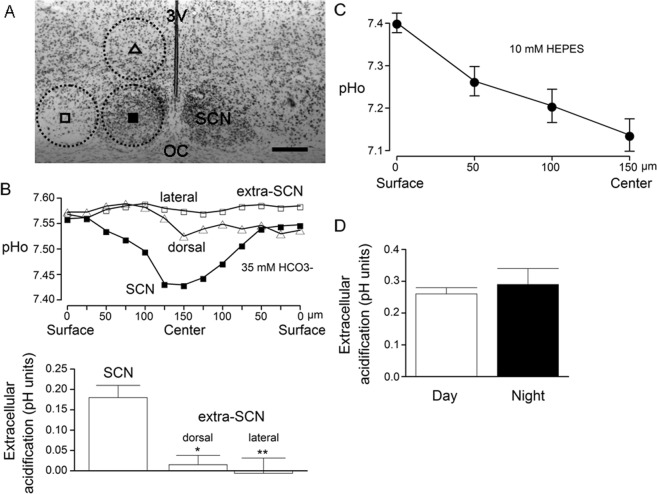
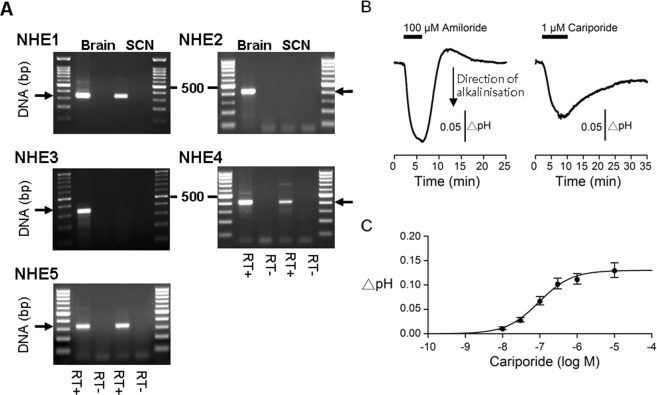
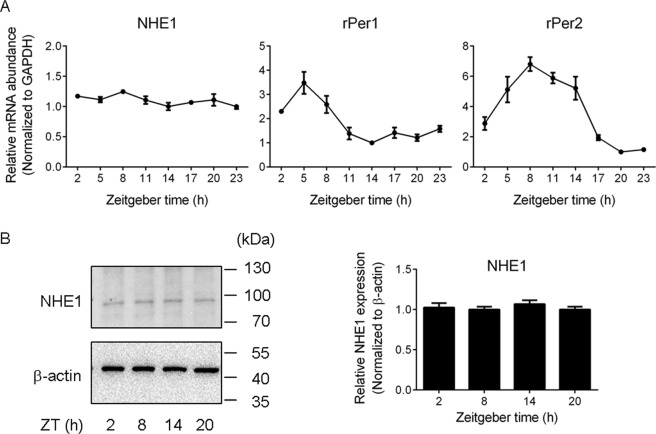
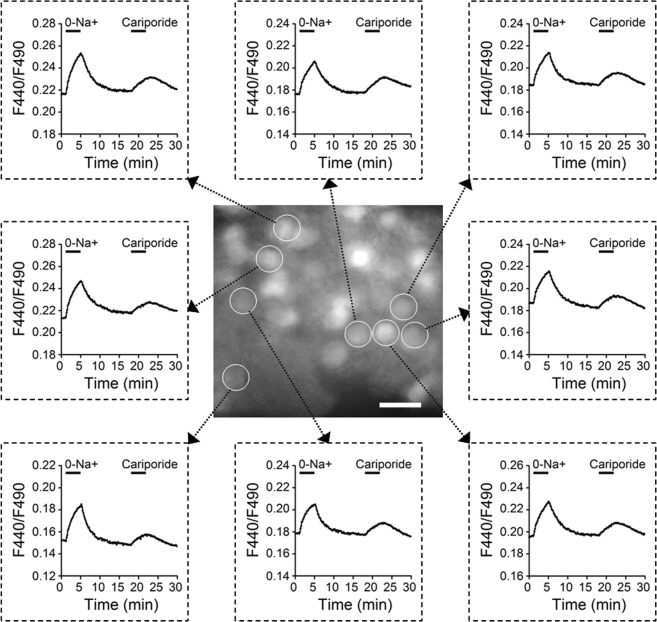
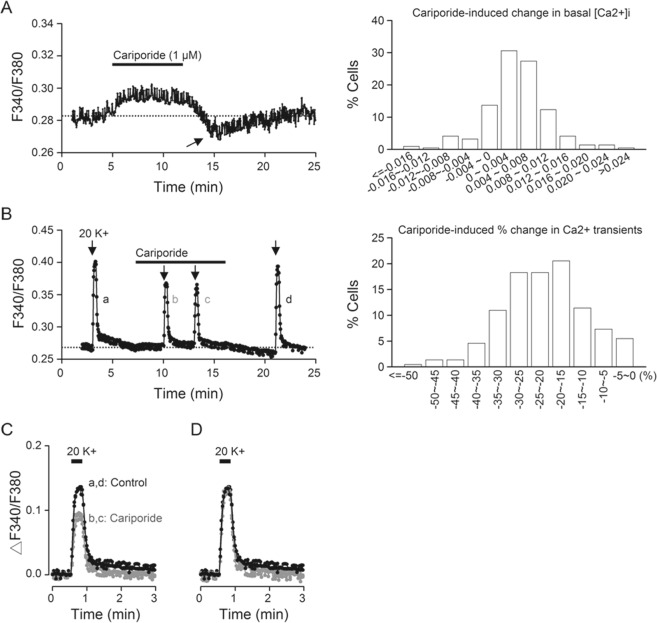
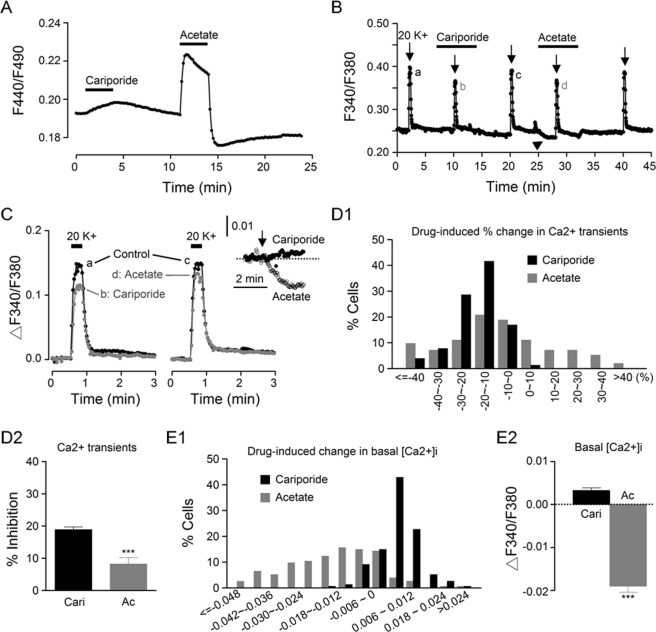
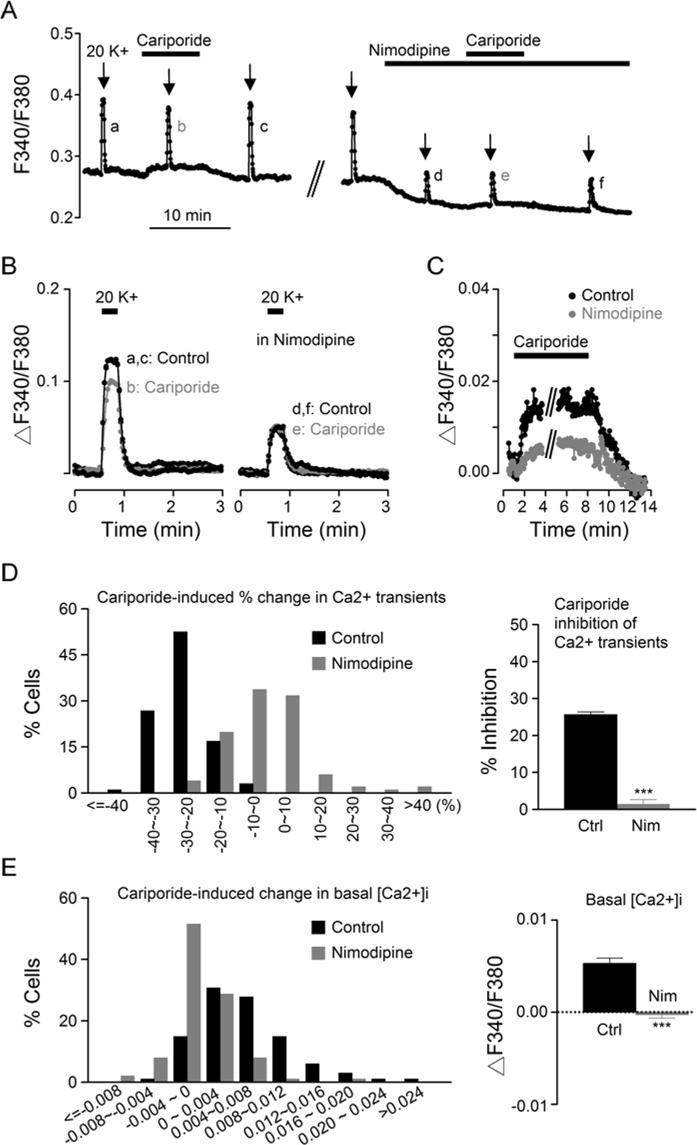
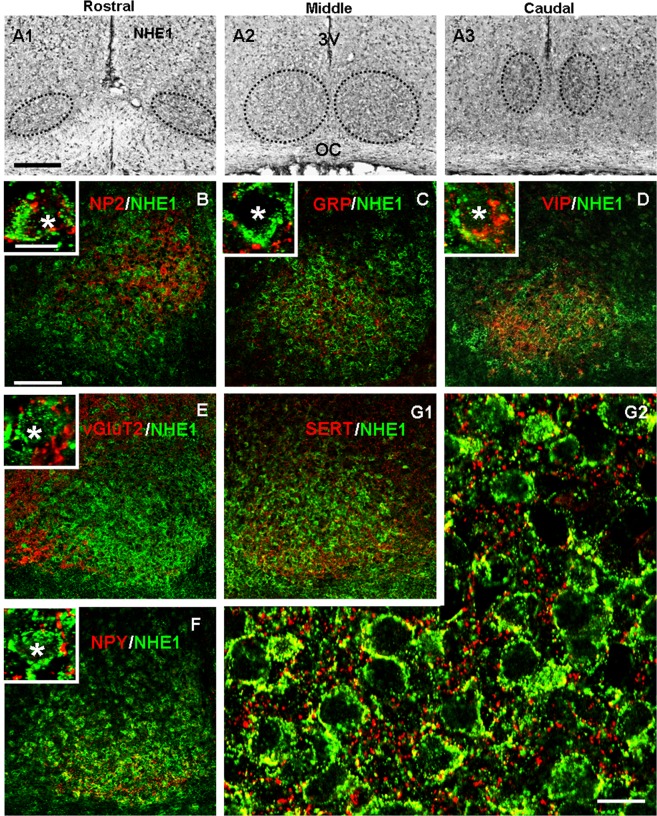
The central clock in the suprachiasmatic nucleus (SCN) has higher metabolic activity than extra-SCN areas in the anterior hypothalamus. Here we investigated whether the Na+/H+ exchanger (NHE) may regulate extracellular pH (pHe), intracellular pH (pHi) and [Ca2+]i in the SCN. In hypothalamic slices bathed in HEPES-buffered solution a standing acidification of ~0.3 pH units was recorded with pH-sensitive microelectrodes in the SCN but not extra-SCN areas. The NHE blocker amiloride alkalinised the pHe. RT-PCR revealed mRNA for plasmalemmal-type NHE1, NHE4, and NHE5 isoforms, whereas the NHE1-specific antagonist cariporide alkalinised the pHe. Real-time PCR and western blotting failed to detect day-night variation in NHE1 mRNA and protein levels. Cariporide induced intracellular acidosis, increased basal [Ca2+]i, and decreased depolarisation-induced Ca2+ rise, with the latter two effects being abolished with nimodipine blocking the L-type Ca2+ channels. Immunofluorescent staining revealed high levels of punctate colocalisation of NHE1 with serotonin transporter (SERT) or CaV1.2, as well as triple staining of NHE1, CaV1.2, and SERT or the presynaptic marker Bassoon. Our results indicate that NHE1 actively extrudes H+ to regulate pHi and nimodipine-sensitive [Ca2+]i in the soma, and along with CaV1.2 may also regulate presynaptic Ca2+ levels and, perhaps at least serotonergic, neurotransmission in the SCN.


Conflict of interest statement

The authors declare no competing interests.

Figures

Figure 1
Figure 1
Calibration of a double-barreled pH-selective electrode. Top: Voltage responses to a series of solution change recorded with a double-barreled pH-selective microelectrode. The numbers on top of each voltage indicate the pH of each calibration solution (pH 6.6–7.6). Bottom: Liner regression plot of the calibration from the double-barreled pH-selective microelectrode.
Figure 2
Figure 2
Extracellular pH measurements in the SCN and extra-SCN areas. (A) Nissl stain image showing the SCN and extra-SCN areas (encircled by broken lines). Symbols: approximate positions of double-barreled pH-sensitive electrodes. Scale bar: 200 µm. 3 V: third ventricle. OC: optic chiasm. (B) Top: Representative results obtained from a slice showing the extracellular pH measurements at different depths into and then out of the SCN (■) and the dorsal (Δ) and lateral (▢) extra-SCN region. The perfusion solution was buffered with 35 mM HCO3/5% CO2 at pH 7.55. The slice thickness was 300 µm, and the surface was defined as 0 µm and the center as 150 µm. Bottom: Statistics comparing the average extracellular acidification in the center of the SCN and extra-SCN areas. *P < 0.05; **P < 0.01. (C) A standing pH gradient between the SCN and the perfusion solution buffered with 10 mM HEPES at pH 7.4. (D) Statistics showing a similar level of extracellular acidification recorded between day (ZT 4–11) and night (ZT 13–20).
Figure 3
Figure 3
Amiloride effects on the extracellular pH (pHe) in the SCN in hypothalamic slices. (A) Dose-dependent effects of amiloride on the pHe in the SCN obtained from a representative experiment. (B) The dose-response relation was fitted with an equation assuming a one-to-one binding of amiloride to and blockade of the NHE. The fitted IC50 was 30 µM for amiloride binding to NHE and blockade of H+ extrusion. (C) Two representative experiments showing the pHe responses to 100 µM amiloride recorded at day (left) and at night (right). (D) Statistics showing a similar magnitude of amiloride-induced alkaline shifts between day and night.
Figure 4
Figure 4
NHE1 is the major NHE isoform in mediating extracellular acid shifts in the SCN. (A) RT-PCR analysis of mRNAs for the plasmalemmal-type NHE isoforms in the SCN. Positive controls were performed using cDNA from rat brain. The expected PCR product sizes for NHE1–NHE5 were 324, 421, 306, 408, and 325 bp, respectively. Negative controls were performed using RT products with omission of reverse transcriptase (RT-) to examine the contamination of genomic DNA. (B) A representative experiment comparing the effects of 100 µM amiloride and 1 µM cariporide on the pHe. Note the slower kinetics of alkalinisation and re-acidification by cariporide than by amiloride. The reason for the slower kinetics is not known at present. (C) Summary of dose-dependent effect of cariporide on the pHe, with the dose-response relation fitted with an equation assuming a one-to-one binding of cariporide to and blockade of the NHE1. The fitted IC50 was 0.094 µM.
Figure 5
Figure 5
Daily profiles of NHE1 gene expression (A) and protein levels (B). (A) Real-time PCR results showing the daily profiles of gene expression for NHE1 (left), rPer1 (middle), and rPer2 (right). (B) Western blot analysis showing the protein levels for NHE1 (~90 kDa; left top) and β-actin (~42 kDa; left bottom) at four different time points across the day. The full-length gels are presented in Supplementary Fig. 1. Right: Statistics showing similar expression levels of NHE1 among different time points.
Figure 6
Figure 6
Effects of Na+-free solution and cariporide on the pHi in cells in reduced SCN slice preparations. Center, Fluorescence micrograph of a reduced SCN preparation loaded with the H+-sensitive fluorescent indicator BCECF-AM. Regions of interest (ROI) are indicated with circles. The image was taken in the resting condition. Scale bar: 20 µm. Surround, The time course of change in the F440/F490 fluorescence ratio recorded from 8 selected ROIs as indicated in Center.
Figure 7
Figure 7
Cariporide effects on [Ca2+]i in cells in reduced SCN slice preparations. (A) A representative experiment showing the effect of 1 µM cariporide on basal [Ca2+]i (an average of 15 cells) (left). Right: Histogram showing the distribution of cariporide-induced changes in basal [Ca2+]i (n = 219 cells from 11 experiments). (B) A different experiment to show the effect of 1 µM cariporide on 20 mM K+-induced Ca2+ rise (left). Right: Histogram showing the distribution of cariporide-induced percentage changes in Ca2+ transients (n = 219 cells). (C) Superimposition of the Ca2+ responses to 20 mM K+ before (a), during (b, c), and after (d) the application of cariporide. (D) Normalisation of Ca2+ transients to indicate the similarly fast decay time course.
Figure 8
Figure 8
Effects of cariporide and sodium acetate on the pHi and [Ca2+]i in the same SCN cells. (A) A representative experiment showing the effect of 1 µM cariporide and 20 mM sodium acetate on the pHi. (B) A representative experiment showing the effect of 1 µM cariporide and 20 mM sodium acetate on [Ca2+]i. Note the lowering effect of acetate on basal [Ca2+]i (marked by arrowhead). (C) Superimposition of the Ca2+ transients to show the suppressive effect of cariporide (left) and acetate (right). Inset: Superimposition of basal [Ca2+]i to indicate the opposite effects of cariporide (filled circles) and acetate (open circles). (D1) Histogram showing the distribution of percentage changes in Ca2+ transients produced by cariporide (black bars) and acetate (grey bars) (n = 154 cells from 8 experiments). (D2) Statistics showing the averaged inhibition by cariporide (Cari) and acetate (Ac) of the peak amplitude of 20 K+-induced Ca2+ rise. (E1) Histogram showing the distribution of changes in basal [Ca2+]i produced by cariporide (black bars) and acetate (grey bars). (E2) Statistics showing the averaged change of basal [Ca2+]i by cariporide and acetate. ***P < 0.0001.
Figure 9
Figure 9
The effect of nimodipine on Ca2+ responses to sodium acetate. (A) A representative experiment showing the effect of 20 mM sodium acetate on [Ca2+]i in the presence of 2 µM nimodipine (same experiment as in Fig. 8B). Note the increase of basal [Ca2+]i by acetate (marked by arrowhead). (B) Superimposition of the Ca2+ transients showing the enhancing effect of acetate in the presence of nimodipine (left), as opposed to the suppressive effect of acetate in the absence of nimodipine (see Fig. 8C; right). Middle: Histogram showing the distribution of acetate-induced percentage changes in Ca2+ transients in control (black bars) and in the presence of nimodipine (grey bars) (n = 99 cells from 5 experiments). Right: Statistics showing that nimodipine converted acetate inhibition to enhancement of the peak amplitude of 20 K+-induced Ca2+ rise. (C) Superimposition of Ca2+ traces to indicate the increasing effect on basal [Ca2+]i of acetate in the presence of nimodipine (grey filled circles), as opposed to the decreasing effect in control (black filled circles; from Fig. 8B, the Ca2+ response marked by arrowhead) (right). Middle: Histogram showing the distribution of acetate-induced changes in basal [Ca2+]i transients in control (black bars) and in the presence of nimodipine (grey bars). Right: Statistics showing that nimodipine converted acetate-induced decrease to increase of basal [Ca2+]i. ***P < 0.0001.
Figure 10
Figure 10
The effect of nimodipine on Ca2+ responses to cariporide. (A) A representative experiment showing the effect of 1 µM cariporide on [Ca2+]i in the absence and then the presence of 2 µM nimodipine. (B) Superimposition of the Ca2+ transients to show that the suppressive effect of cariporide (left) was abolished in the presence of nimodipine (right). (C) Superimposition of Ca2+ traces to indicate that cariporide-induced increase in basal [Ca2+]i (black filled circles) became smaller in the presence of nimodipine (grey filled circles). (D) Histogram showing the distribution of cariporide-induced percentage changes in Ca2+ transients in control (black bars) and in the presence of nimodipine (grey bars) (n = 101 cells from 5 experiments) (left). Right: Statistics showing that cariporide-induced inhibition of the peak amplitude of 20 K+-induced Ca2+ rise was abolished by nimodipine. (E) Histogram showing the distribution of cariporide-induced changes in basal [Ca2+]i in control (black bars) and in the presence of nimodipine (grey bars) (left). Right: Statistics showing that cariporide-induced increase of basal [Ca2+]i was also abolished by nimodipine. ***P < 0.0001.
Figure 11
Figure 11
NHE1 distribution (A) and colocalisation with markers for specific cell types (BD) and major inputs (E, F, G). (A) NHE1 immunoreactivity is distributed throughout the rostrocaudal axis of the SCN (encircled by the dotted lines). Scale bar: 200 µm. OC: optic chiasm. 3 V: third ventricle. (BG1) Low magnification images showing the double staining pattern of NHE1 with neuropeptides NP2 (B), GRP (C), and VIP (D) as well as markers for afferent inputs vGluT2 (E), NPY (F), and SERT (G1). Scale bar: 100 µm. Insets: High magnification images showing individual cells with double staining. Scale bar: 10 µm. Asterisks mark Hoechst-stained nuclei. (G2) High magnification image showing high degree of colocalisation (yellow) between NHE1 (green) and SERT (red). Scale bar: 10 µm.
Figure 12
Figure 12
NHE1 colocalisation with CaV1.2 (A) and NCX1 (B), as well as colocalisation of NHE1/CaV1.2 with SERT (C), NPY (D), and Bassoon (E). (A, B) High magnification images showing high levels of NHE1 colocalisation with CaV1.2 (A), but not NCX1 (B). (CE) High magnification images showing moderate to high levels of NHE1/CaV1.2 colocalisation with SERT (C) and Bassoon (E), but not NPY (D). Scale bar: 10 µm.

References

    1. Orlowski J, Grinstein S. Diversity of the mammalian sodium/proton exchanger SLC9 gene family. Pflügers Arch. Eur. J. Physiol. 2004;447:549–565. doi: 10.1007/s00424-003-1110-3. - DOI - PubMed
    1. Brett CL, Donowitz M, Rao R. Evolutionary origins of eukaryotic sodium/proton exchangers. Am. J. Physiol. Cell Physiol. 2005;288:C223–C239. doi: 10.1152/ajpcell.00360.2004. - DOI - PubMed
    1. Orlowski J, Grinstein S. Emerging roles of alkali cation/proton exchangers in organellar homeostasis. Curr. Opin. Cell Biol. 2007;19:483–492. doi: 10.1016/j.ceb.2007.06.001. - DOI - PMC - PubMed
    1. Sinning A, Hübner CA. Minireview: pH and synaptic transmission. FEBS Lett. 2013;587:1923–1928. doi: 10.1016/j.febslet.2013.04.045. - DOI - PubMed
    1. Zhao H, et al. Emerging roles of Na+/H+ exchangers in epilepsy and developmental brain disorders. Prog. Neurobiol. 2016;138–140:19–35. doi: 10.1016/j.pneurobio.2016.02.002. - DOI - PMC - PubMed

Publication types

MeSH terms