. 2017 Dec;1(12):957-966.
doi: 10.1038/s41551-017-0165-y. Epub 2017 Dec 4.

Microscopy with ultraviolet surface excitation for rapid slide-free histology

Affiliations

Microscopy with ultraviolet surface excitation for rapid slide-free histology

Farzad Fereidouni et al. Nat Biomed Eng. 2017 Dec.

Abstract

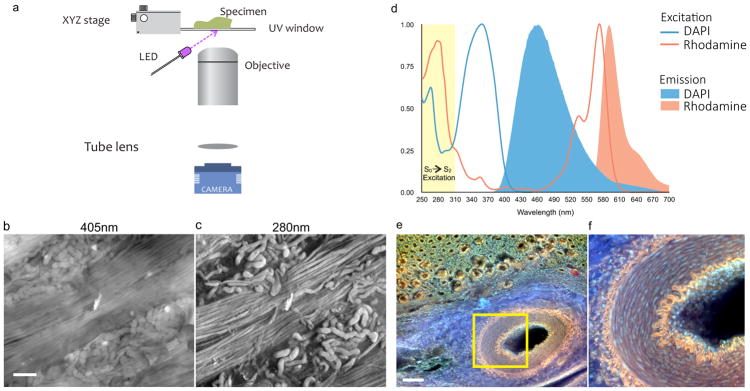
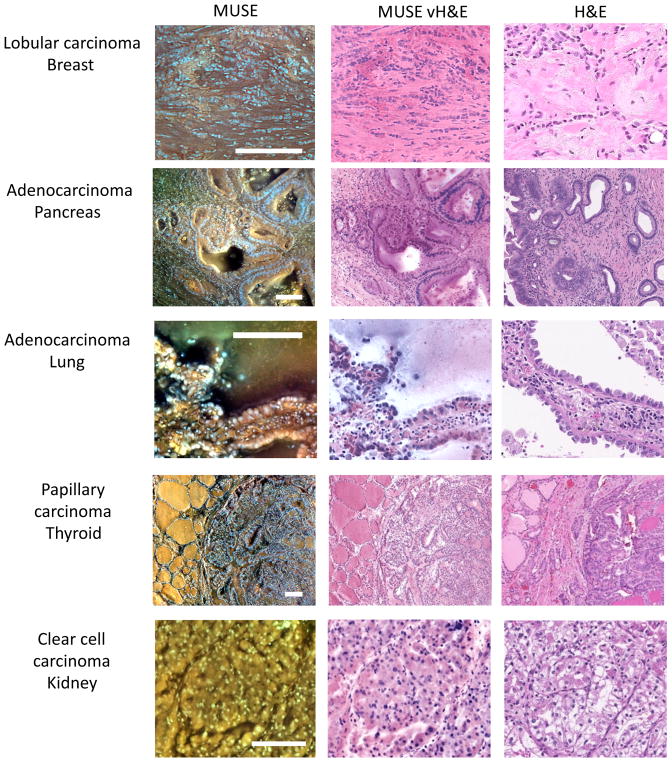
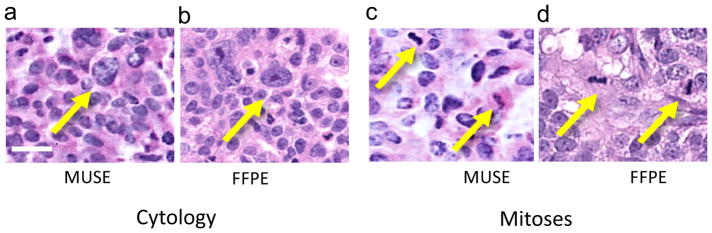
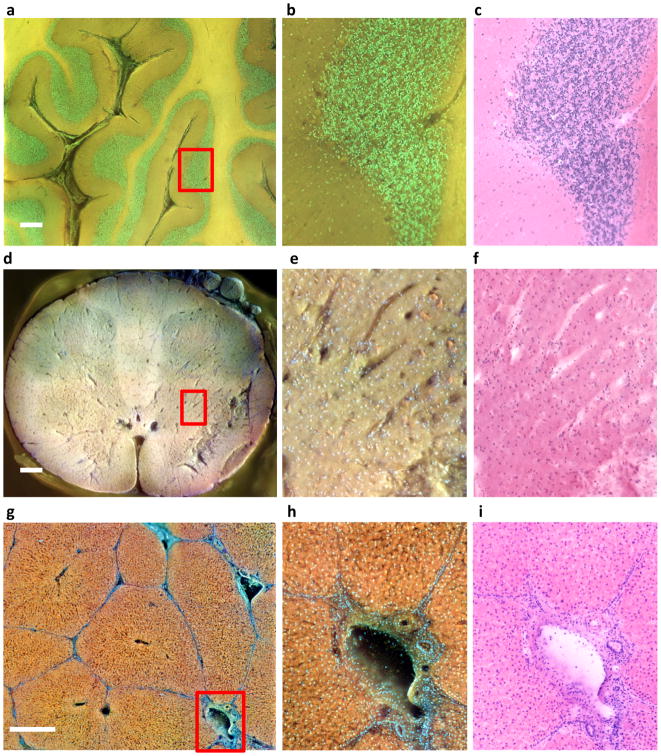
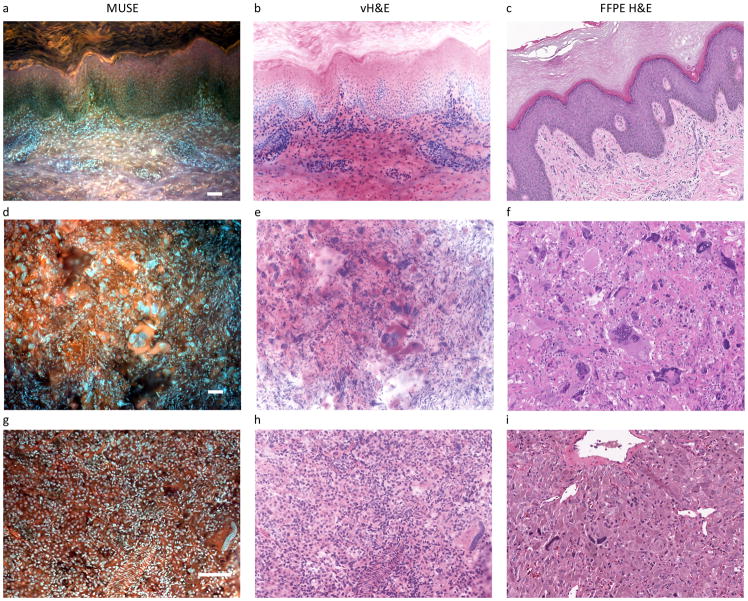
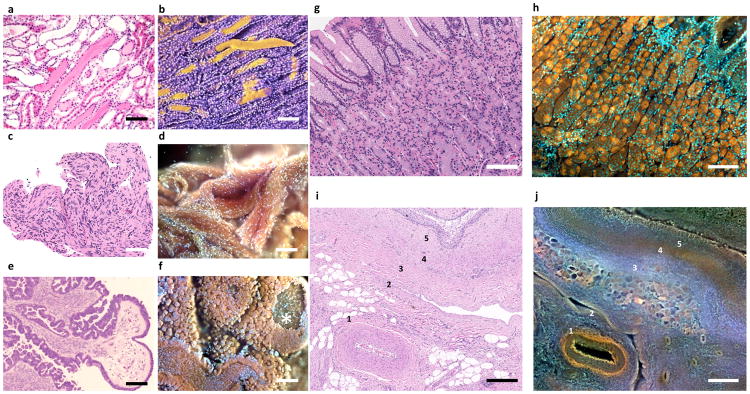
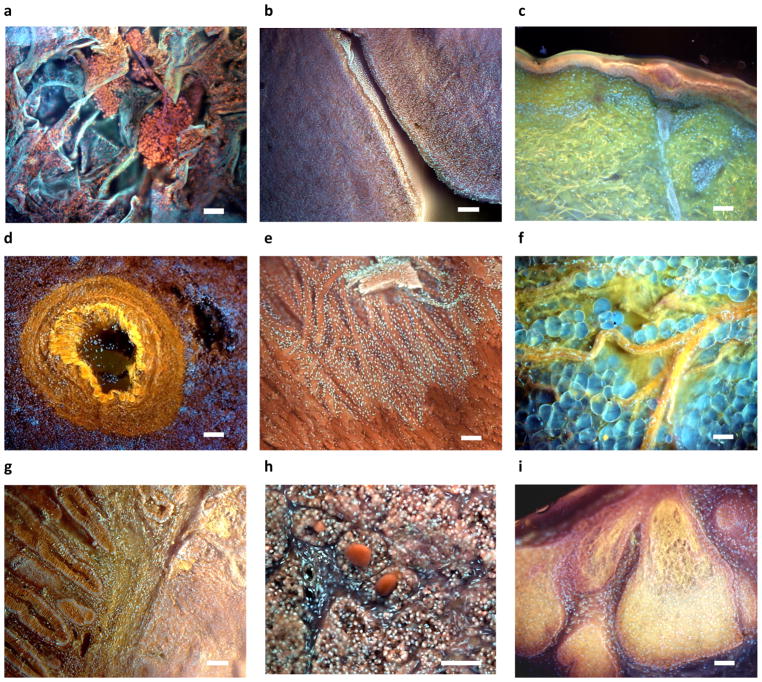
Histological examination of tissues is central to the diagnosis and management of neoplasms and many other diseases and is a foundational technique for preclinical and basic research. However, commonly used bright-field microscopy requires prior preparation of micrometre-thick tissue sections mounted on glass slides-a process that can require hours or days, contributes to cost and delays access to critical information. Here, we introduce a simple, non-destructive slide-free technique that, within minutes, provides high-resolution diagnostic histological images resembling those obtained from conventional haematoxylin and eosin histology. The approach, which we named microscopy with ultraviolet surface excitation (MUSE), can also generate shape and colour-contrast information. MUSE relies on ~280 nm ultraviolet light to restrict the excitation of conventional fluorescent stains to tissue surfaces and it has no significant effects on downstream molecular assays (including fluorescence in situ hybridization and RNA sequencing). MUSE promises to improve the speed and efficiency of patient care in both state-of-the-art and low-resource settings and to provide opportunities for rapid histology in research.


Conflict of interest statement

Competing interests

R.L. and S.D. are co-founders of a start-up company, Muse Microscopy Inc., which is involved in commercializing MUSE technology. The other authors declare no competing financial interests.

Figures

Figure 1
Figure 1. Principles of MUSE: surface-weighted excitation and long Stokes-shift fluorescence emission
a, Schematic diagram of MUSE optical design. An inverted microscope design is used, modified to include a UV-transparent stage and off-axis UV LED illumination. b,c, Unfixed ovine kidney, cut surface prepared via razor blade, stained with eosin and imaged with a grayscale camera, excited with c, 405-nm and d, 280-nm sources. Tubules and collecting ducts are easier to discern with 280-nm UV because of the latter’s surface-limited tissue penetration. d, 280-nm light excites multiple dyes that emit in the visible range due to the S0-S2 excitation (shown in yellow) followed by S1-S0 relaxation, excitation and emission spectra for DAPI and rhodamine are shown. e,f, Image captured from the cut surface of a thick, formalin-fixed porcine kidney specimen stained for 10 seconds with a mixed solution of rhodamine and Hoechst, and excited using a 280-nm UV LED. Multiple colours are visible: the muscular artery’s internal and external laminae (orange); collagen (blue); nuclei (lilac); tubules (orange and green). Endothelial cell nuclei extending down inside the artery are visible. Scale bars = 100 μm.
Figure 2
Figure 2. Fluorescence images, conversion to virtual H&E (vH&E) and comparison to paired FFPE conventional histology
Left column consists of fluorescence MUSE images from the cut-surfaces of formalin-fixed tissues briefly stained with Hoechst, rhodamine, eosin and propidium iodide (PI), captured with a colour camera and white-balanced. Middle column: same images converted to vH&E as described in Methods and Supplementary Information. Right column, digital images captured with a whole-slide scanner from conventional H&E-stained slides of the same specimens after paraffin-embedding and sectioning. From top to bottom: lobular carcinoma, breast, with characteristic infiltration of single cells through stroma; adenocarcinoma, colon, with large glandular structures infiltrating the submucosa; adenocarcinoma, lung, with prominent lepidic spread of tumor cells along the alveolar lining; papillary carcinoma, thyroid, with clear distinction between normal and malignant regions; and clear cell carcinoma, kidney. Note absence of cytoplasmic clearing in MUSE images (compare with H&E). Scale bars = 100 μm.
Figure 3
Figure 3. High-resolution MUSE images for chromatin texture evaluation and mitosis detection
Ovarian carcinoma (metastatic to the peritoneum), stained with Hoechst and rhodamine. a, Chromatin texture visible in MUSE image (colour mapped to vH&E); compare with b, FFPE H&E of a paired specimen. c, Mitoses are clearly visible and similar to those seen in d, FFPE paired specimen. Chromatin texture and mitoses are more readily appreciated after inverting the fluorescence image and conversion to brightfield mode. Scale bar = 20 μm
Figure 4
Figure 4. Large field of view imaging with MUSE
Formalin-fixed tissue specimens (a–c, cerebellum; d–f, spinal cord; g–i, porcine liver) were imaged via MUSE. Flat surfaces were prepared by cutting with a hand-held histology blade and stained with rhodamine and Hoechst (cerebellum and liver), supplemented with eosin and PI (spinal cord). Multiple fields at 10X were captured using a scanning stage, and stitched together. The top row presents a region of cerebellum from a human neonate, consisting of 49 10X-images, flat-fielded and stitched together using the freely available Microsoft Image Composite Editor. b, Purkinje cells are visible at the interface between the molecular and granular layers. d–f, A 6 × 6 montage of a whole pediatric spinal cord cross-section is available at full resolution on line at http://www.gigapan.com/gigapans/199300.e, Neurons (orange) and capillaries are visible. g–i, An image montage (4 × 4 stitched 10X-images) of the cut-surface of a rhodamine-and-Hoechst-stained thick specimen of fixed porcine liver is shown in the bottom row. Normal liver architecture can be appreciated, with well-outlined lobules surrounding central veins and abutting portal triads consisting of portal veins, hepatic arteries, and bile ducts, are shown in h. (see http://www.gigapan.com/gigapans/185233.) Colour differences between these examples are due to intrinsic tissue properties and details of how colour-channel brightness and contrast were stretched. Scale bars = 700 μm for a and d, 300 μm for g.
Figure 5
Figure 5. Sample images from the validation study with examples of concordant and discrepant diagnoses
Columns as in Figure 2, except all MUSE-imaged specimens were stained only with rhodamine and Hoechst. Row 1 (Case #18--fixed): concordant. Benign skin with abundant keratin layer, easily diagnosed in both MUSE and H&E modes. Row 2 (Case #8—fresh): concordant. Retroperitoneal mass, easily identified as malignant neoplasm, and both reviewers favored rhabdomyosarcoma. Row 3: (Case 41—fixed): mildly discrepant. H&E reviewer favored adrenal cortical adenoma or carcinoma, MUSE reviewer favored pheochromocytoma, both part of a potentially difficult differential which may require IHC or other studies to resolve. Note large tubular nucleus in the MUSE image (lower right) and compare with similar long, dark nuclei in the corresponding H&E image. Scale bar = 100 μm.
Figure 6
Figure 6. Additional shape and colour information available in MUSE vs. conventional H&E images
a–f, Enhanced surface shape information. a, Standard FFPE-H&E histology of human kidney with proteinaceous casts filling some tubules. b, Same kidney imaged with MUSE, and pseudocoloured for clarity. Casts can be seen as cylindrical structures, including one that was dislodged from its original site. c, H&E Schwannoma. Swirling nature of this tumor can be appreciated. d, MUSE of same specimen, in which the 3D organization of the tumor can be appreciated. e, Seromucinous ovarian carcinoma, H&E. Carcinoma-lined tufts surround fibrovascular cores are visible. f, Same tumor imaged with MUSE, revealing cauliflower floret-like clumps of malignant epithelial cells outside fibrovascular cores. A window into a core is visible, top right. g–j, Broader colour gamut reveals novel tissue contrast. g,h, Corresponding regions of normal human stomach fundus and i,j, porcine renal pelvis are shown, with MUSE specimens stained using rhodamine and Hoechst. g, Conventional FFPE H&E; h, MUSE, fluorescence image from a similar region. The chief (brown) and parietal cells (orange) are much easier to distinguish in the fluorescence MUSE image. i, Fixed porcine renal tissue, H&E; j, corresponding region, MUSE fluorescence mode. Stromal features, some identified by number, are easier to distinguish in the MUSE image vs. H&E. Scale bar = 100 μm.
Figure 7
Figure 7. Examples of additional tissues imaged using MUSE
a, Lung with clusters of histiocytes encased in a fine membrane (not visible on corresponding H&E images (eosin and PI); b, Ovary stroma and germinal epithelium c, Skin, with epidermis, dermis, skin appendages, collagen (green), elastin (yellow) and dermal-epidermal melanin visible (Hoechst, rhodamine, eosin, PI), d, Spleen, with prominent blood vessel (rhodamine and Hoechst); e, myocardium with thin layer of endocardium covering part of the specimen (rhodamine and Hoechst); f, fresh breast tissue, with nerve coursing over and through layer of intact adipocytes (rhodamine and Hoechst); g, Normal colon (left) next to adenocarcinoma (right)h, Pineal gland with pineal “sand” (rhodamine and Hoechst); i, sebaceous gland, cervix (rhodamine and Hoechst). Scale bar = 100 μm.

References

    1. Rastogi V, et al. Artefacts: a diagnostic dilemma - a review. J Clin Diagn Res. 2013;7:2408–2413. doi: 10.7860/JCDR/2013/6170.3541. - DOI - PMC - PubMed
    1. Neil MA, Juskaitis R, Wilson T. Method of obtaining optical sectioning by using structured light in a conventional microscope. Opt Lett. 1997;22:1905–1907. - PubMed
    1. Dobbs J, et al. Confocal fluorescence microscopy for rapid evaluation of invasive tumor cellularity of inflammatory breast carcinoma core needle biopsies. Breast Cancer Res Treat. 2015;149:303–310. - PMC - PubMed
    1. Tao YK, et al. Assessment of breast pathologies using nonlinear microscopy. Proc Natl Acad Sci U S A. 2014;111:15304–15309. doi: 10.1073/pnas.1416955111. - DOI - PMC - PubMed
    1. Kang D, et al. Endoscopic probe optics for spectrally encoded confocal microscopy. Biomedical optics express. 2013;4:1925–1936. doi: 10.1364/BOE.4.001925. - DOI - PMC - PubMed

Publication types

MeSH terms