

Effects of Huanglian-Renshen-Decoction, a Fixed Mixture of Traditional Chinese Medicine, on the Improvement of Glucose Metabolism by Maintenance of Pancreatic β Cell Identity in db/db Mice
- PMID: 31015847
- PMCID: PMC6444265
- DOI: 10.1155/2019/1232913
Effects of Huanglian-Renshen-Decoction, a Fixed Mixture of Traditional Chinese Medicine, on the Improvement of Glucose Metabolism by Maintenance of Pancreatic β Cell Identity in db/db Mice
Abstract
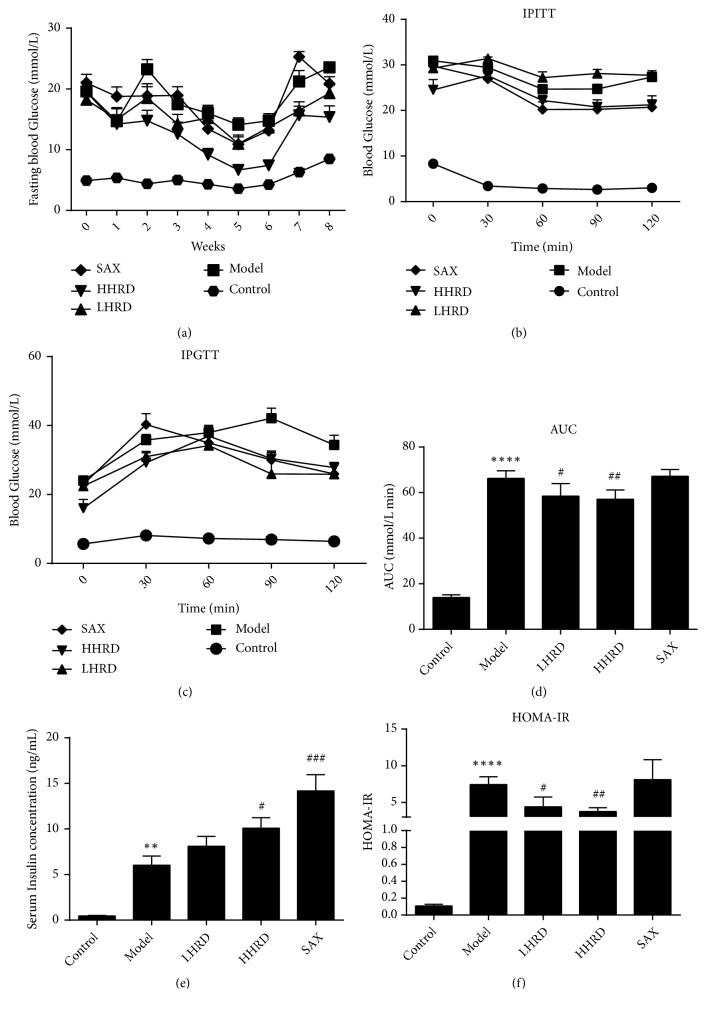
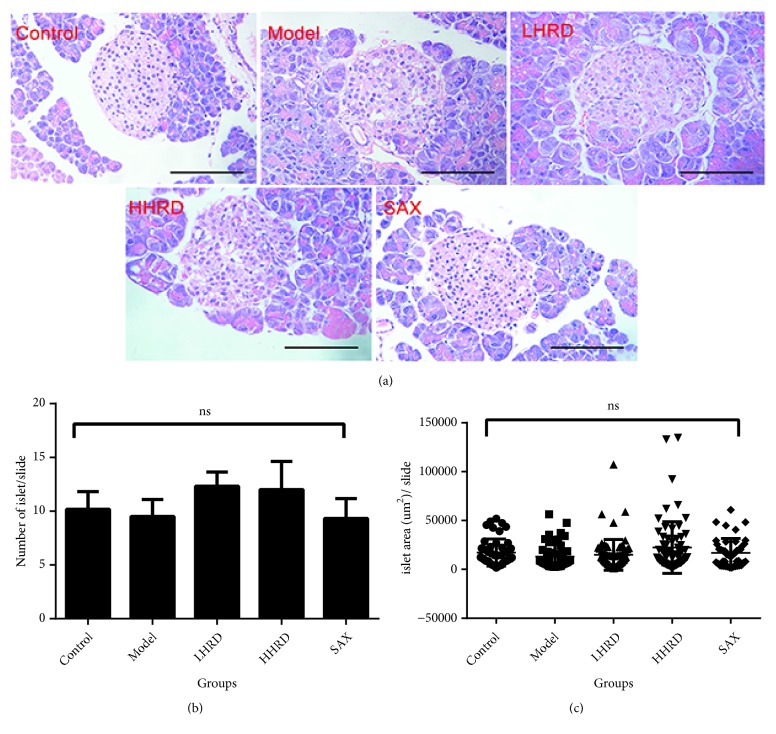
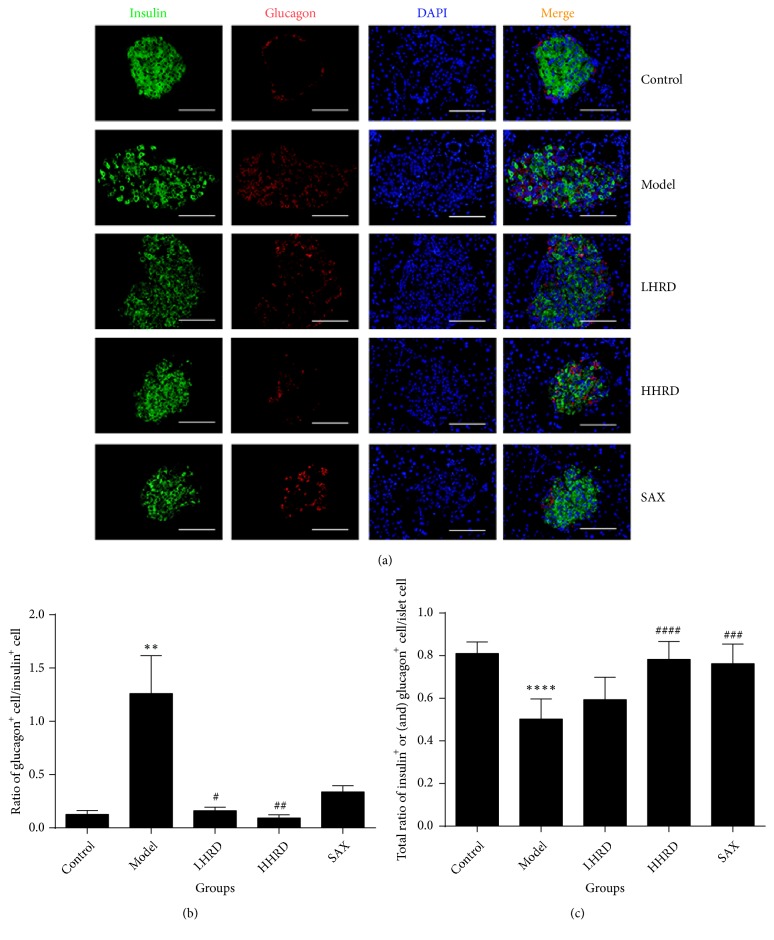
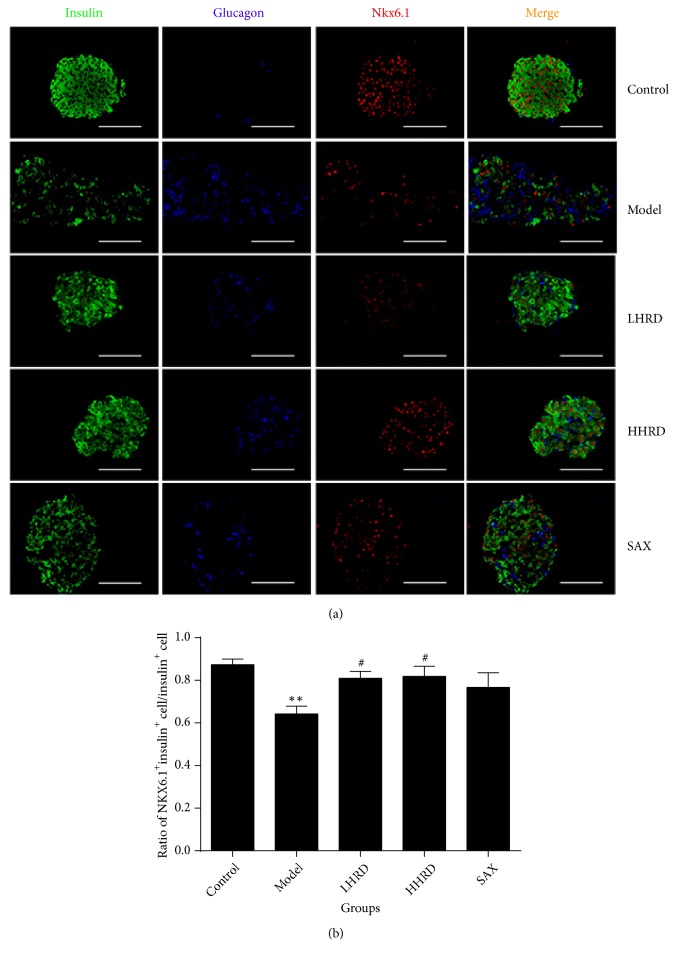
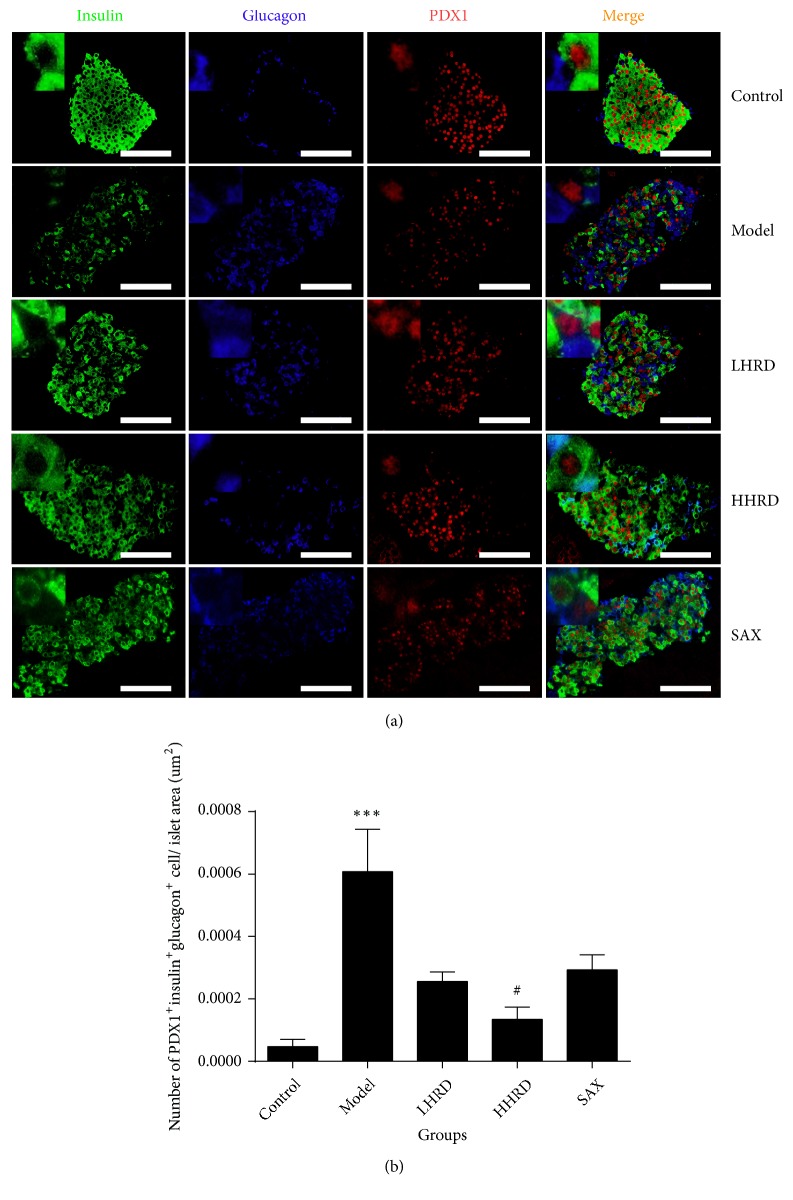
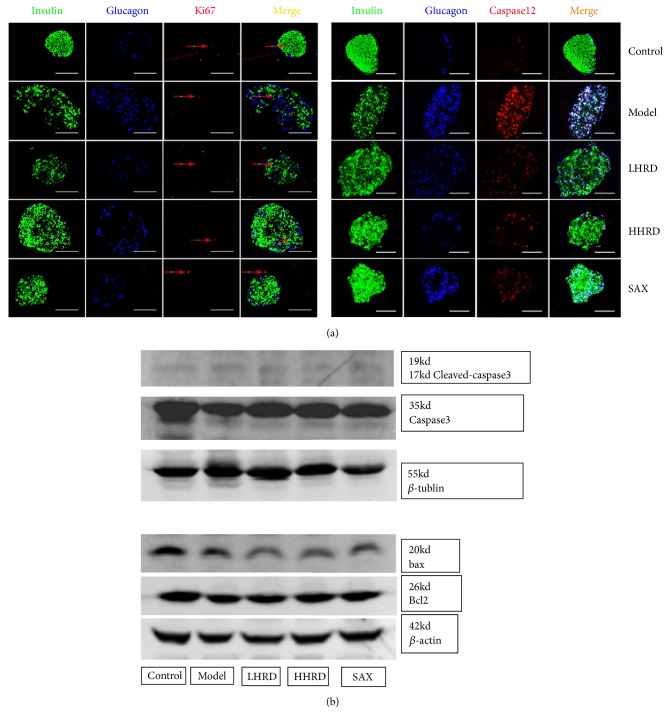
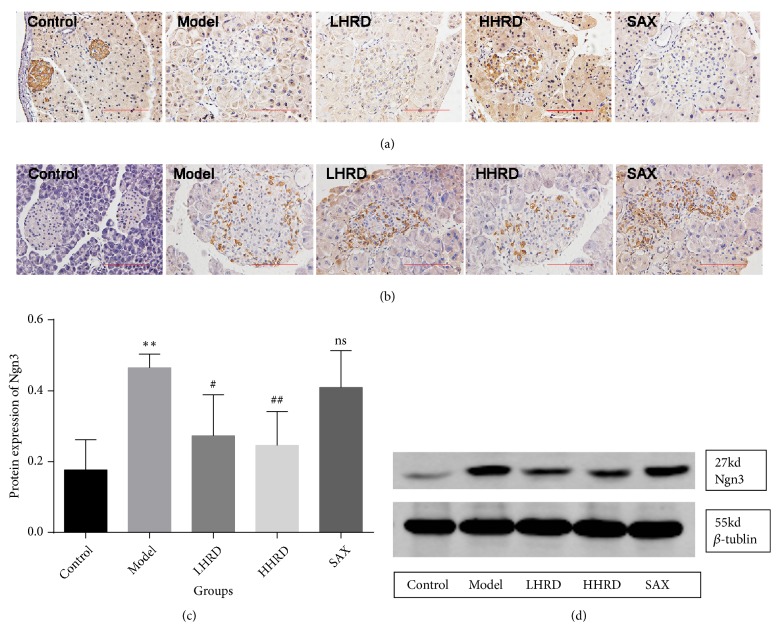
Huanglian-Renshen-Decoction (HRD) is widely used to treat type 2 diabetes mellitus (T2DM) in China. However, the underlying mechanism is unclear. We aimed to investigate the mechanism by which HRD regulates the glucose level. Forty 7-8-week-old db/db (BSK) mice were randomly assigned to the following four groups: model, low dose HRD (LHRD), high dose HRD (HHRD), and saxagliptin (SAX). Additionally, 10 db/m mice were assigned to control group. The experimental mice were administered 3.03g/kg/d and 6.06g/kg/d of HRD in the LHRD and HHRD groups, respectively, and 10mg/kg/d saxagliptin in the SAX group for 8 weeks. The control and model groups were supplied with distilled water. After the intervention, the pancreas and blood were collected and tested. Compared with that of model group, the fasting blood glucose (FBG) was significantly decreased in all intervention groups (p < 0.05 or 0.01), whereas fasting serum insulin (FINS) was increased significantly in both HHRD and SAX groups. The immunofluorescence images showed that the mass of insulin+ cells was increased and that of glucagon+ cells was reduced obviously in experimental groups compared to those of the model group. In addition, the coexpression of insulin, glucagon, and PDX1 was decreased in HHRD group, and the level of caspase 12 in islet was decreased significantly in all intervention groups. However, little difference was found in the number and morphology of islet, and the expression of ki67, bcl2, bax, caspase 3, and cleaved-caspase 3 in the pancreas among groups. Interestingly, the cleaved-Notch1 level was increased and the Ngn3 level in islet was decreased significantly in HHRD group. The HRD showed dose-dependent effects on glucose metabolism improvement through maintenance of β cell identity via a mechanism that might involve the Notch1/Ngn3 signal pathway in db/db mice.
Figures
Similar articles
-
Huanglian-Renshen-Decoction Maintains Islet β-Cell Identity in T2DM Mice through Regulating GLP-1 and GLP-1R in Both Islet and Intestine.Chin J Integr Med. 2025 Jan;31(1):39-48. doi: 10.1007/s11655-024-3915-1. Epub 2024 Nov 18. Chin J Integr Med. 2025. PMID: 39551849
-
The effect of Liuwei Dihuang decoction on PI3K/Akt signaling pathway in liver of type 2 diabetes mellitus (T2DM) rats with insulin resistance.J Ethnopharmacol. 2016 Nov 4;192:382-389. doi: 10.1016/j.jep.2016.07.024. Epub 2016 Jul 9. J Ethnopharmacol. 2016. PMID: 27401286
-
Global gene expression analysis in liver of db/db mice treated with catalpol.Chin J Nat Med. 2018 Aug;16(8):590-598. doi: 10.1016/S1875-5364(18)30096-7. Chin J Nat Med. 2018. PMID: 30197124
-
Angiotensin (1-7) Improves Pancreatic Islet Function via Upregulating PDX-1 and GCK: A Dose-Dependent Study in Mice.Int J Endocrinol. 2024 Dec 19;2024:1672096. doi: 10.1155/ije/1672096. eCollection 2024. Int J Endocrinol. 2024. PMID: 39734383 Free PMC article.
-
Clinical and Basic Research on Renshen Yangrong Decoction.Front Nutr. 2019 Dec 2;6:175. doi: 10.3389/fnut.2019.00175. eCollection 2019. Front Nutr. 2019. PMID: 31850359 Free PMC article. Review.
Cited by
-
Huanglian-Renshen-Decoction Maintains Islet β-Cell Identity in T2DM Mice through Regulating GLP-1 and GLP-1R in Both Islet and Intestine.Chin J Integr Med. 2025 Jan;31(1):39-48. doi: 10.1007/s11655-024-3915-1. Epub 2024 Nov 18. Chin J Integr Med. 2025. PMID: 39551849
-
Scientometric analysis and historical review of diabetic encephalopathy research: Trends and hotspots (2004-2023).World J Diabetes. 2025 May 15;16(5):91200. doi: 10.4239/wjd.v16.i5.91200. World J Diabetes. 2025. PMID: 40487602 Free PMC article.
-
Several major herb pairs containing Coptidis rhizoma: a review of key traditional uses, constituents and compatibility effects.Front Pharmacol. 2024 Jun 25;15:1399460. doi: 10.3389/fphar.2024.1399460. eCollection 2024. Front Pharmacol. 2024. PMID: 38983920 Free PMC article. Review.
-
Shenlian (SL) Decoction, a Traditional Chinese Medicine Compound, May Ameliorate Blood Glucose via Mediating the Gut Microbiota in db/db Mice.J Diabetes Res. 2022 Feb 9;2022:7802107. doi: 10.1155/2022/7802107. eCollection 2022. J Diabetes Res. 2022. PMID: 35187178 Free PMC article.
-
Evidence of traditional Chinese medicine for treating type 2 diabetes mellitus: from molecular mechanisms to clinical efficacy.Pharm Biol. 2024 Dec;62(1):592-606. doi: 10.1080/13880209.2024.2374794. Epub 2024 Jul 19. Pharm Biol. 2024. PMID: 39028269 Free PMC article.
References
LinkOut - more resources
Full Text Sources
Research Materials
Miscellaneous
