. 2019 Feb 16;6(8):1802012.
doi: 10.1002/advs.201802012. eCollection 2019 Apr 17.

Synergetic Functional Nanocomposites Enhance Immunotherapy in Solid Tumors by Remodeling the Immunoenvironment

Affiliations

Synergetic Functional Nanocomposites Enhance Immunotherapy in Solid Tumors by Remodeling the Immunoenvironment

Linnan Yang et al. Adv Sci (Weinh). .

Abstract

Checkpoint blockade immunotherapy has demonstrated significant clinical success in various malignant tumors. However, the therapeutic response is limited due to the immunosuppressive tumor microenvironment (ITM). In this study, a functional nanomaterial, layered double hydroxides (LDHs), carrying specific functional miR155 is developed to modulate ITM by synergistically repolarizing tumor associated macrophages (TAMs) to M1 subtype. LDH nanoparticles loaded with miR155 (LDH@155) exhibit superior ability in cellular uptake by murine macrophages, miR escape into the cytoplasm and TAMs specific delivery when introtumoral administration. Meanwhile, upon exposure to LDH@155, TAMs are significantly skewed to M1 subtype, which markedly inhibits myeloid-derived suppressor cells (MDSCs) formation and stimulates T-lymphocytes to secrete more interferon-γ (IFN-γ) cytokines in vitro. Introtumoral administration of LDH@155 reduces the percentage of TAMs and MDSCs in the tumor and elevates CD4+ and CD8+ T cell infiltration and activation, which can promote therapeutic efficiency of α-PD-1 antibody immunotherapy. Furthermore, it is found that LDH@155 significantly decreases the expression level of phosphorylated STAT3 and ERK1/2 and activates NF-κB expression in TAMs, indicating that the STAT3, ERK1/2, and NF-κB signaling pathways may involve in LDH@155-induced macrophage polarization. Overall, the results suggest that LDH@155 nanoparticles may, in the future, function as a promising agent for cancer combinational immunotherapy.

Keywords: immunosuppressive tumor microenvironments; immunotherapy; layered double hydroxides; microRNA; nanoparticles.


Conflict of interest statement

The authors declare no conflict of interest.

Figures
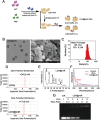
Figure 1
Figure 1
Preparation and characterization of LDH@miR NPs. A) Schematic representation of LDH@miR preparation. B) TEM image (left) and SEM image (right) of LDH@miR. (TEM image: bar = 100 nm; SEM image: bar = 500 nm). C) Particle size distribution of LDH@miR determined by DLS. D) Zeta potential of LDHs and LDH@miR (LDH:miR = 20:1, w/w) at 25 °C. E) XRD analysis of LDH@miR. F) UV absorption spectrum of LDH@miR and LDHs. G) miR loading capacity detected by agarose gel electrophoresis.
Figure 2
Figure 2
Cellular uptake and isolation, TAM‐targeting and metabolism of LDH@155 nanoparticles in vitro and in vivo. A) Fluorescence confocal images of LDH@miR‐Cy5 uptake by RAW264.7. Bar = 25 µm. B) Intracellular colocalization of LDH@miR‐Cy5 and miR‐Cy5 in RAW264.7 after incubation for 3 h, and labeled with DAPI (blue) and Lyso‐tracker (green) to distinguish cell nuclei and lysosome, respectively. Bar = 10 µm. C) Tumor‐bearing C57BL/6J mice were i.t. injected with free miR‐Cy5 or LDH@miR‐Cy5. The uptake of miR by TAMs (CD11b+) of TC‐1 tumors was detected at 48 h using flow cytometry. D) Quantitative percentage of miR+ cells in CD11b positive and negative cells in TC‐1 tumors treated by LDH@miR or free miR, respectively. E) Fluorescence confocal images of LDH@miR‐Cy5 uptake by RAW264.7 and TC‐1 at pH 6.5 for 3 h, respectively. Bar = 25 µm. F) Quantitative fluorescence intensity of miR‐Cy5 in TC‐1 and RAW264.7, respectively. G) TC‐1 tumor‐bearing mice were i.t. injected with free miR‐Cy5 or LDH@miR‐Cy5 for in vivo imaging at different time points. Date are presented as mean + s.d. Statistical significance was calculated by Student's t‐test and one‐way ANOVA, **p < 0.01; ***p < 0.001.
Figure 3
Figure 3
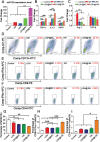
LDH@155‐induced macrophage state switch in vitro. Macrophage extracted from abdomen of C57BL/6J female mice were induced to TAMs and then treated with LDH NPs, LDH@NC, free miR155, and LDH@155. A) The expression of miR155 was detected by qRT‐PCR and normalized to U6 at 48 h. The mRNA expression level of B) M1 macrophage markers (TNF‐α, IL‐12, iNOS) and C) M2 macrophage markers (Arg‐1, TGF‐β) in TAMs at 48 h. D) Representative flow cytometry images and G) percentage analysis of MDSCs formation after incubating with TAMs treated with different miR‐NPs. E) Representative flow cytometry images and H) percentage analysis of CD8+ T cells activation after incubating with TAMs supernatant treated with different miR‐NPs. F) Representative flow cytometry images and I) percentage analysis of CD4+ T cells activation after incubating with TAMs supernatant treated with different miR‐NPs. Date are presented as mean + s.d. Statistical significance was calculated using one‐way ANOVA. *p < 0.05; **p < 0.01; ***p < 0.001.
Figure 4
Figure 4
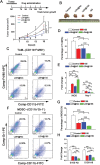
Tumor growth inhibition and immunosuppressive environment remolding in TC‐1 models by LDH@155. TC‐1 tumor‐bearing mice (n = 5) were i.t. injected with PBS, LDH@155 or LDH@NC, free miR155 every 2 days from day 7 after tumor implantation. A) Tumor growth was monitored every 3 days. B) Side‐by‐side comparison of tumors on day 17 after tumor extracted from mice body. C) Representative flow cytometry images of tumor‐associated macrophages (TAMs) from TC‐1 tumors. D) Percentage of TAMs within suspension cells from the TC‐1 tumors after different treatments. E) The mRNA expression level of iNOS (M1 marker) and Arg‐1(M2 marker) in TAMs detected by qRT‐PCR. F) Representative flow cytometry images of myeloid‐derived suppressor cells (MDSCs) from TC‐1 tumors. G) Percentage of MDSCs within suspension cells from the TC‐1 tumors after different treatments. H) The mRNA expression level of S100A8, S100A9 in MDSCs detected by qRT‐PCR. Date are presented as mean + s.d. Statistical significance was calculated by using one‐way ANOVA. *p < 0.05; **p < 0.01; ***p < 0.001.
Figure 5
Figure 5
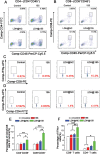
LDH@155 induced activated CD4+ and CD8+ T cells infiltration, CD4+IFNγ+ and CD8+IFNγ+ appreciation in TC‐1 environment. A,B) Flow cytometry plots of activated CD4+ and CD8+ T cells from TC‐1 tumors. C,D) Representative flow cytometry plots of IFNγ positive cells within the CD8+ T cells population (C) or CD4+ T cells population (D) of suspension cells from the TC‐1 tumors after different treatments. E) Quantification of CD4+ and CD8+ T cells of suspension cells from the TC‐1 tumors after different treatments. F) Percentage of IFNγ+CD8+ cells and IFNγ+CD4+ cells of suspension cells from the TC‐1 tumors after different treatments. Date are presented as mean + s.d. Statistical significance was calculated by using one‐way ANOVA. *p < 0.05; **p < 0.01; ***p < 0.001.
Figure 6
Figure 6
Enhancing therapeutic effects of chemo‐ and immunotherapy therapy by LDH@155. C57BL/6J tumor‐bearing mice (n = 5) received i.t. injection of PBS, LDH@NC, LDH@155, 155 at day 8 every other day for five times. Meanwhile, α‐PD‐1 antibody (250 µg per mouse) and carboplatin (50 mg kg−1) were i.p. at day 10 every 3 days for three times. A,B) Tumor growth curves of α‐PD‐1 treatment (A) and carboplatin treatment (B). C,D) Kaplan–Meier survival curves of α‐PD‐1 treatment (C) and carboplatin treatment (D). Date are presented as mean + s.d. Statistical significance was calculated by using one‐way ANOVA. *p < 0.05; **p < 0.01; ***p < 0.001.
Figure 7
Figure 7
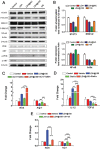
The signaling pathways and mechanism of LDH@155 on repolarize M2 macrophage to M1 macrophage. A) Western Blot assay of the selected proteins for the determination of phosphorylation and full‐length antibodies array. B) Quantitative analysis of the relative protein expression level. C) mRNA expression level of M1 maker (iNOS) and M2 marker (Arg‐1) with treatment of ERK1/2 inhibitor (SCH772984, 10−5 m) for 24 h. D) mRNA expression level of M1 maker (IL‐12) and M2 marker (TGF‐β) with treatment of STAT3 inhibitor (Stattic, 2 × 10⁻⁶ m) for 24 h. E) mRNA expression level of M1 maker (iNOS) and M2 marker (Arg‐1) with treatment of NF‐κB inhibitor (JSH‐23, 10−5 m) for 24 h. Date are presented as mean + s.d. Statistical significance was calculated by using one‐way ANOVA. *p < 0.05; **p < 0.01; ***p < 0.001.
Figure 8
Figure 8
Schematic diagram of checkpoint inhibitor therapy combined with cancer immunoediting through LDH@155.

Similar articles

Cited by

References

    1. Rosenberg S. A., Nature 2001, 411, 380. - PubMed
    1. Rosenberg S. A., Yang J. C., Restifo N. P., Nat. Med. 2004, 10, 909. - PMC - PubMed
    1. Rook A. H., Raphael B. A., N. Engl. J. Med. 2012, 367, 1168. - PubMed
    1. Beatty G. L., Moon E. K., OncoImmunology 2014, 3, 3.
    1. Sowell R. T., Kaech S. M., Cell 2016, 166, 1362. - PMC - PubMed

LinkOut - more resources