. 2019 Apr 17:5:6.
doi: 10.1038/s41531-019-0076-6. eCollection 2019.

Moving beyond neurons: the role of cell type-specific gene regulation in Parkinson's disease heritability

Collaborators, Affiliations

Moving beyond neurons: the role of cell type-specific gene regulation in Parkinson's disease heritability

Regina H Reynolds et al. NPJ Parkinsons Dis. .

Abstract

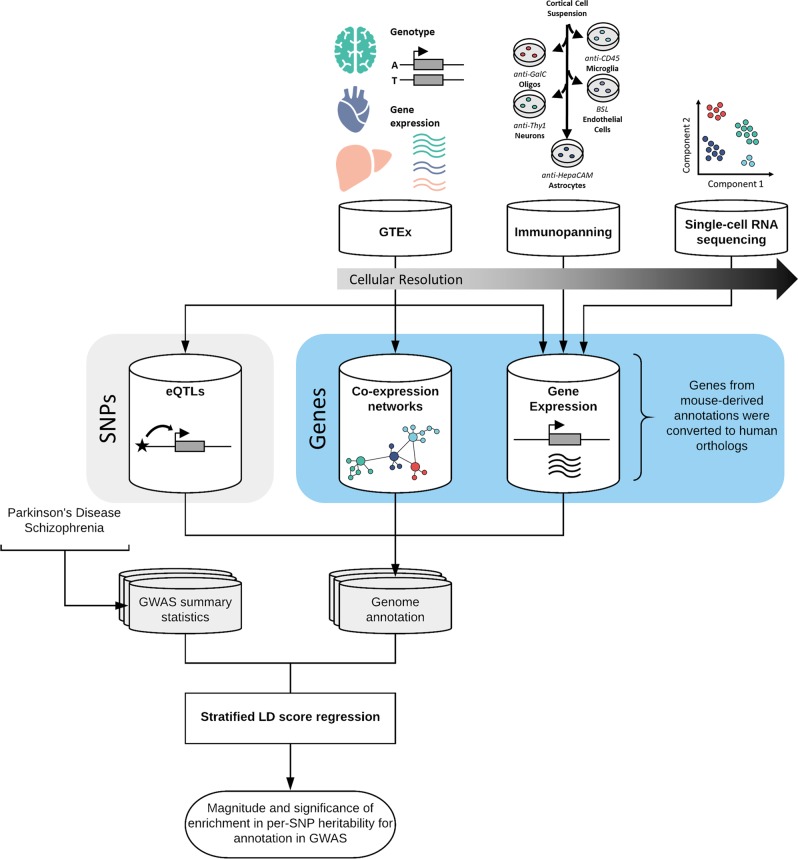
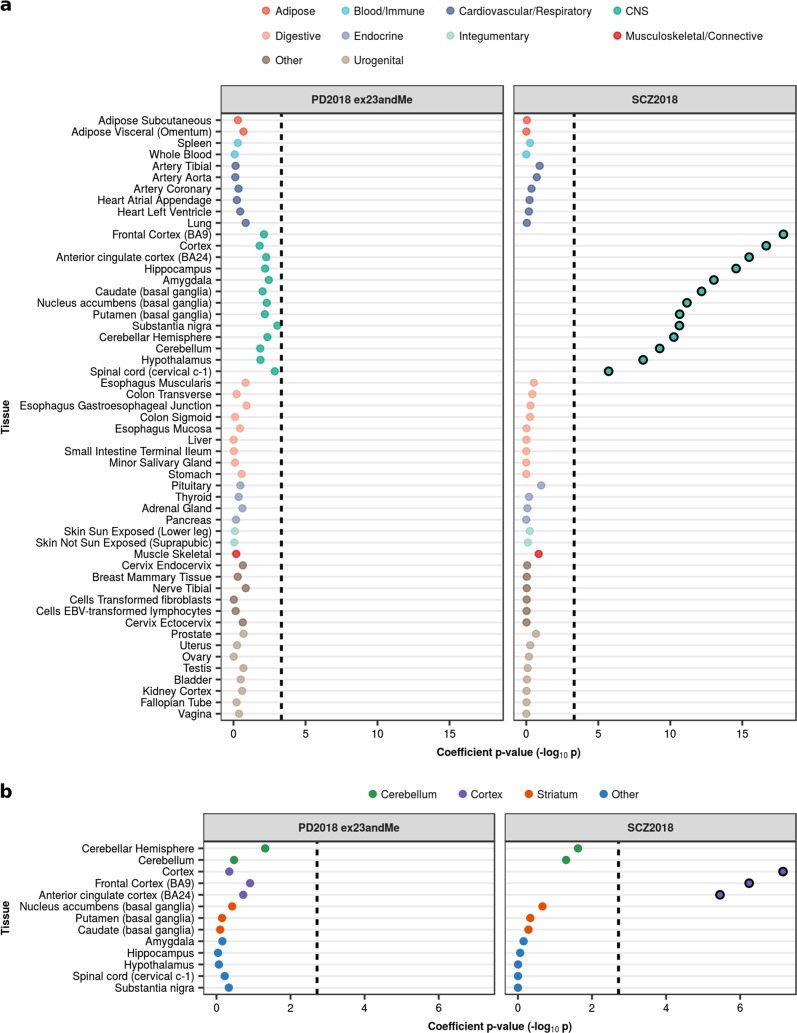
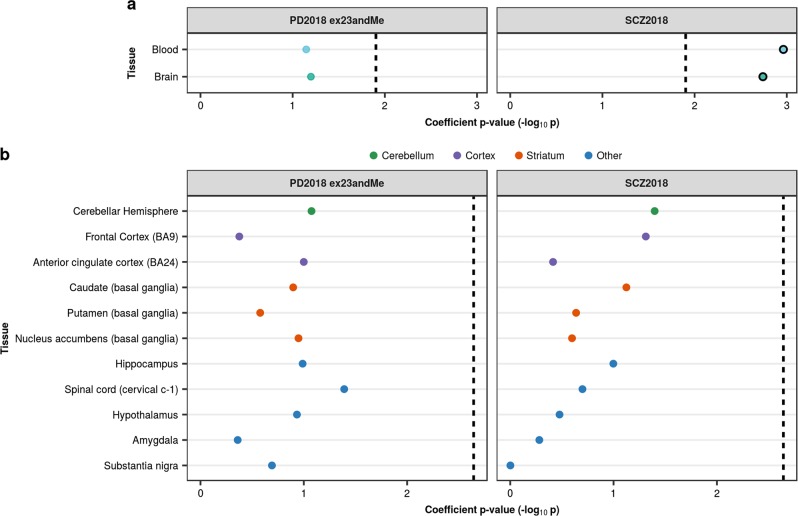
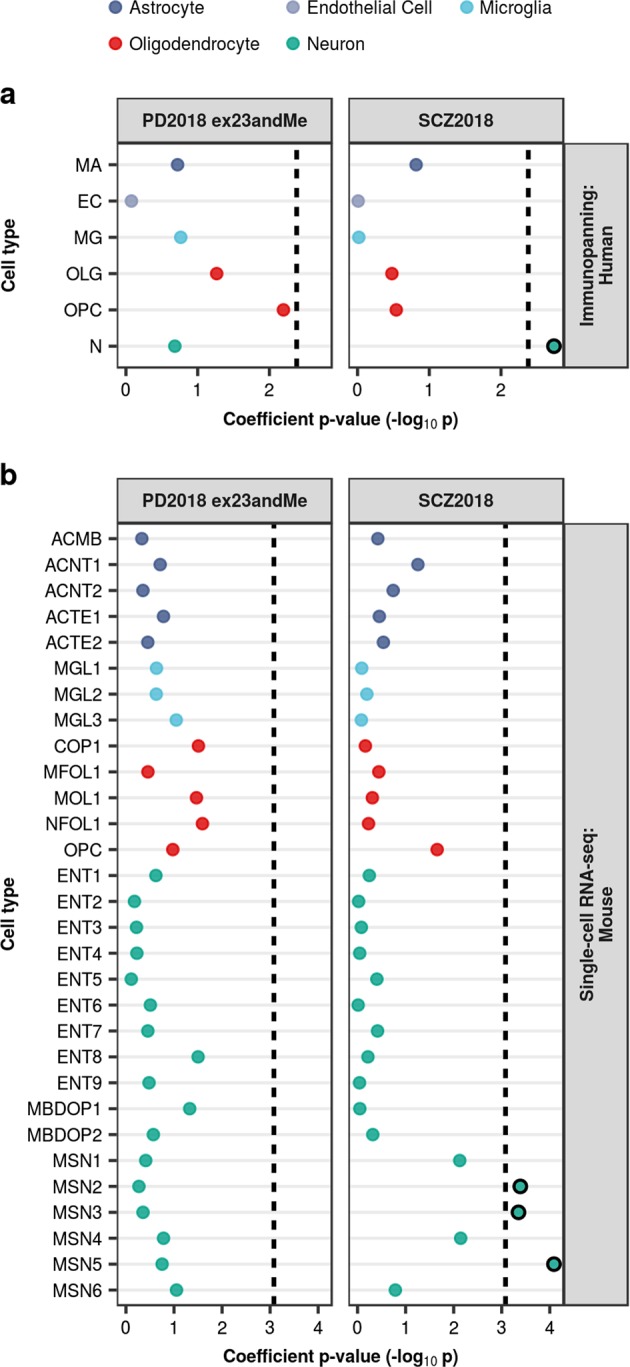
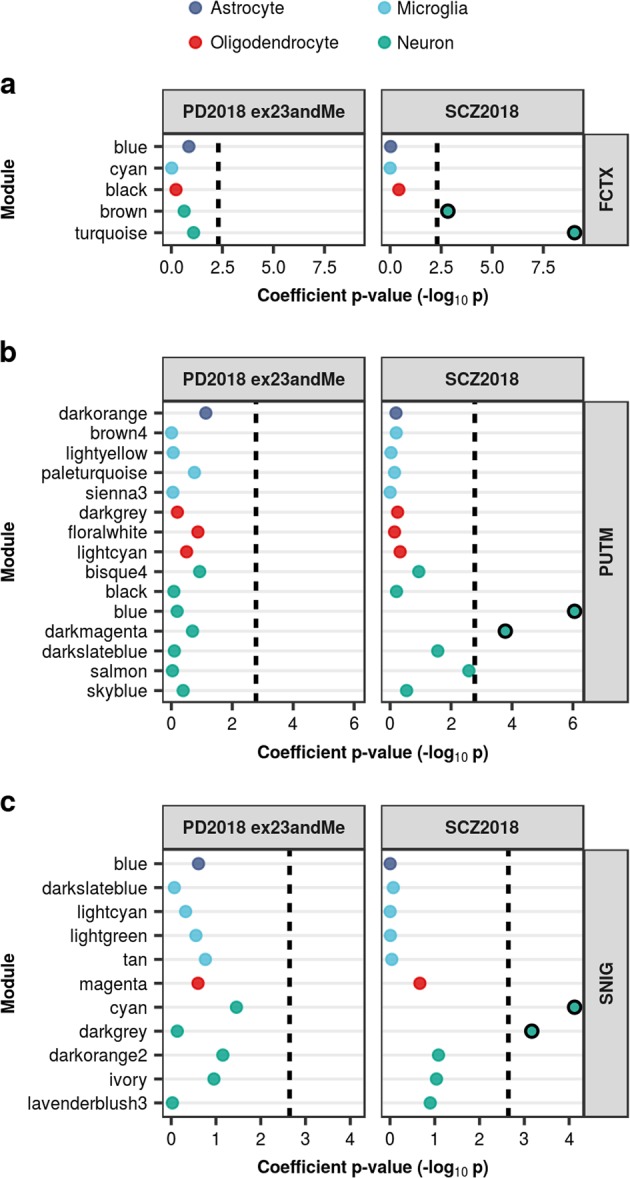
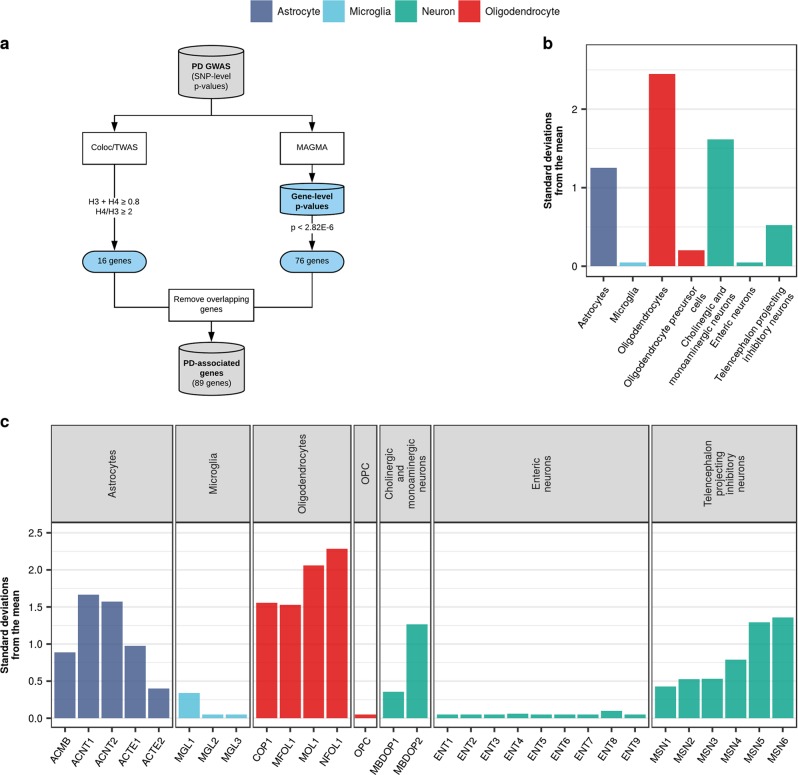
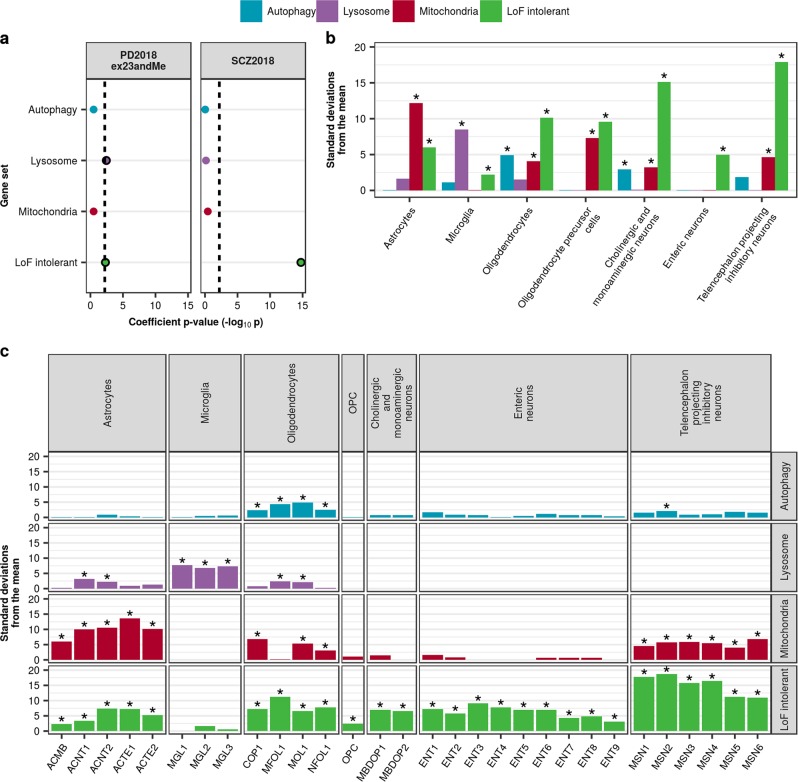
Parkinson's disease (PD), with its characteristic loss of nigrostriatal dopaminergic neurons and deposition of α-synuclein in neurons, is often considered a neuronal disorder. However, in recent years substantial evidence has emerged to implicate glial cell types, such as astrocytes and microglia. In this study, we used stratified LD score regression and expression-weighted cell-type enrichment together with several brain-related and cell-type-specific genomic annotations to connect human genomic PD findings to specific brain cell types. We found that PD heritability attributable to common variation does not enrich in global and regional brain annotations or brain-related cell-type-specific annotations. Likewise, we found no enrichment of PD susceptibility genes in brain-related cell types. In contrast, we demonstrated a significant enrichment of PD heritability in a curated lysosomal gene set highly expressed in astrocytic, microglial, and oligodendrocyte subtypes, and in LoF-intolerant genes, which were found highly expressed in almost all tested cellular subtypes. Our results suggest that PD risk loci do not lie in specific cell types or individual brain regions, but rather in global cellular processes detectable across several cell types.

Keywords: Neuroscience; Parkinson's disease.


Conflict of interest statement

As a possible conflict of interest M.A.N. also consults for Illumina Inc, Lysosomal Therapeutics Inc, the Michael J. Fox Foundation and Vivid Genomics among others. The remaining authors declare no competing interests.

Figures

Fig. 1
Fig. 1
Overview of approach and datasets used. This study compiled several brain-related genomic annotations reflecting tissue- and cell-type-specific activity, using data generated by the GTEx project, the Barres group and the Linnarsson group. These annotations, each of which varied in their cellular resolution, included: tissue-specific eQTLs (reflecting the effect of genetic variation on gene expression); tissue-specific co-expression networks (reflecting the connectivity of a gene to all other expressed genes in the tissue), and tissue- and cell-type-specific gene expression. All annotations were constructed in a binary format (1 if the SNP is present within the annotation and 0 if not). For annotations where the primary input was a gene, all SNPs with a minor allele frequency > 5% within ± 100 kb of the transcription start and end site were assigned a value of 1. For more details of how each individual annotation was generated see Methods. Stratified LDSC was then used to test whether an annotation was significantly enriched for the common-SNP heritability of PD or SCZ
Fig. 2
Fig. 2
Enrichment of PD and SCZ common-SNP heritability in tissue-specific gene expression annotations as used in Finucane et al. a Stratified LDSC analyses showed significant enrichment of SCZ heritability in all GTEx brain regions but no enrichment of PD heritability. GTEx tissue annotations represent the top 10% most upregulated genes in each tissue with respect to the remaining tissues, excluding those from a similar tissue category. b Stratified LDSC analyses showed significant enrichment of SCZ heritability in cortical brain regions, but no enrichment for PD heritability. GTEx brain-only annotations represent the top 10% most upregulated genes in each brain region with respect to the remaining regions. Tissues were ordered within each tissue category by the coefficient p-value obtained for SCZ. The black dashed lines indicate the cut-off for Bonferroni significance (a, p < 0.05/(2 × 53); b, p < 0.05/(2 × 13)). Bonferroni-significant results are marked with black borders. The proportion of SNPs accounted for by each annotation (compared to the baseline model), the regression coefficient calculated for the latest PD and SCZ GWASs, and the coefficient p-values for previous iterations of the PD and SCZ GWASs are displayed in Supplementary Figs 1–4. Numerical results are reported in Supplementary Table 1
Fig. 3
Fig. 3
Enrichment of PD and SCZ common-SNP heritability in tissue-specific eQTL annotations. a Stratified LDSC analyses showed significant enrichment of SCZ heritability in brain-specific and blood-specific GTEx eQTLs. b A within-brain analysis of GTEx eQTLs showed no significant enrichment of PD and SCZ heritability in one region relative to others. In both analyses, eQTLs were assigned to a tissue/brain region based on their effect size (i.e. the absolute value of the linear regression slope). Tissues were ordered within each tissue category by the coefficient p-value obtained for SCZ. The black dashed lines indicate the cut-off for Bonferroni significance (a, p < 0.05/(2 × 2); b, p < 0.05/(2 × 11)). Bonferroni-significant results are marked with black borders. The proportion of SNPs accounted for by each annotation (compared to the baseline model), the regression coefficient calculated for the latest PD and SCZ GWASs, and the coefficient p-values for previous iterations of the PD and SCZ GWASs are displayed in Supplementary Figures 5–7. Numerical results are reported in Supplementary Table 2
Fig. 4
Fig. 4
Enrichment of PD and SCZ common-SNP heritability in brain-related cell-type-specific gene expression annotations. Stratified LDSC analyses using cell-type-specific annotations derived from bulk RNA-sequencing of immunopanned cell types from human temporal lobe cortex (a) and single-cell RNA-sequencing of the adolescent mouse nervous system (b) demonstrated an enrichment of SCZ heritability in neuronal cell types (in particular, medium spiny neurons), but no cell-type enrichment for PD. All cell-type annotations were generated using the top 10% of enriched genes within a cell type compared to all others. Cell types were ordered alphabetically within each overarching cell type category. The black dashed lines indicate the cut-off for Bonferroni significance (a, p < 0.05/(2 × 6); b, p < 0.05/(2 × 30)). Bonferroni-significant results are marked with black borders. The proportion of SNPs accounted for by each annotation (compared to the baseline model), the regression coefficient calculated for the latest PD and SCZ GWASs, and the coefficient p-values for previous iterations of the PD and SCZ GWASs are displayed in Supplementary Figs 8–10. Numerical results and cell-type abbreviations are reported in Supplementary Table 3
Fig. 5
Fig. 5
Enrichment of PD and SCZ common-SNP heritability in cell-type modules inferred from human tissue-level co-expression networks. Stratified LDSC analyses using cell-type-specific co-expression modules from frontal cortex (a), putamen (b), and substantia nigra (c) demonstrated significant enrichment of SCZ heritability in certain neuronal modules across all three tissues, but no enrichment for PD heritability. Genes were assigned to cell-type modules by module membership. Cell-type-specific modules were ordered alphabetically within each overarching cell type category. The black dashed lines indicate the cut-off for Bonferroni significance (a, p < 0.05/(2 × 5); b, p < 0.05/(2 × 15); c, p < 0.05/(2 × 11)). Bonferroni-significant results are marked with black borders. The proportion of SNPs accounted for by each annotation (compared to the baseline model), the regression coefficient calculated for the latest PD and SCZ GWASs, and the coefficient p-values for previous iterations of the PD and SCZ GWASs are displayed in Supplementary Figures 11–14. Numerical results and module descriptions are reported in Supplementary Table 4. FCTX, frontal cortex; PUTM, putamen; SNIG, substantia nigra
Fig. 6
Fig. 6
PD susceptibility genes do not enrich in brain-related cell types. a PD susceptibility genes were derived from MAGMA analyses and a study attempting to prioritise genes in PD using TWAS and colocalisation analyses. Genes overlapping between the two sets were removed, resulting in a list of 89 genes. Bootstrapping tests performed using the EWCE method revealed no enrichment of PD susceptibility genes in the major cell-type classes (b) or their cell subtypes (c) from the Linnarsson single-cell RNA-sequencing dataset. Gene lists and numerical results are available in Supplementary Table 5
Fig. 7
Fig. 7
PD heritability enriches in lysosomal and LoF-intolerant gene sets which are ubiquitously expressed. a Stratified LDSC analyses using gene sets implicated in PD demonstrated a significant enrichment of PD heritability in the lysosomal and LoF-intolerant gene sets. The black dashed lines indicate the cut-off for Bonferroni significance (p < 0.05/(2 × 4)). Bonferroni-significant results are marked with black borders. The proportion of SNPs accounted for by each annotation (compared to the baseline model), the regression coefficient calculated for the latest PD and SCZ GWASs, and the coefficient p-values for previous iterations of the PD and SCZ GWASs are displayed in Supplementary Figures 17 and 18. Bootstrapping tests performed using the EWCE method demonstrated enrichment of autophagy, lysosomal and mitochondrial gene sets in specific cell-type classes (b) and their cell subtypes (c) from the Linnarsson single-cell RNA-sequencing dataset. Asterisks denote significance at p < 0.05 after correcting for multiple testing with the Benjamini-Hochberg method over all gene sets and cell types tested. Gene lists and numerical results are reported in Supplementary Table 6

References

    1. Poewe W, et al. Parkinson disease. Nat. Rev. Dis. Prim. 2017;3:17013. doi: 10.1038/nrdp.2017.13. - DOI - PubMed
    1. Del Tredici K, Braak H. Review: Sporadic Parkinson’s disease: development and distribution of α-synuclein pathology. Neuropathol. Appl. Neurobiol. 2016;42:33–50. doi: 10.1111/nan.12298. - DOI - PubMed
    1. Bendor JT, Logan TP, Edwards RH. The function of α-synuclein. Neuron. 2013;79:1044–1066. doi: 10.1016/j.neuron.2013.09.004. - DOI - PMC - PubMed
    1. Spillantini MG, et al. Alpha-synuclein in Lewy bodies. Nature. 1997;388:839–840. doi: 10.1038/42166. - DOI - PubMed
    1. Polymeropoulos MH, et al. Mutation in the alpha-synuclein gene identified in families with Parkinson’s disease. Science. 1997;276:2045–2047. doi: 10.1126/science.276.5321.2045. - DOI - PubMed