

Postnatal ex vivo rat model for longitudinal bone growth investigations
- PMID: 31016285
- PMCID: PMC6431117
- DOI: 10.1002/ame2.12051
Postnatal ex vivo rat model for longitudinal bone growth investigations
Abstract
Background: Chondrocytes in the growth plate (GP) undergo increases in volume during different cascades of cell differentiation during longitudinal bone growth. The volume increase is reported to be the most significant variable in understanding the mechanism of long bone growth.
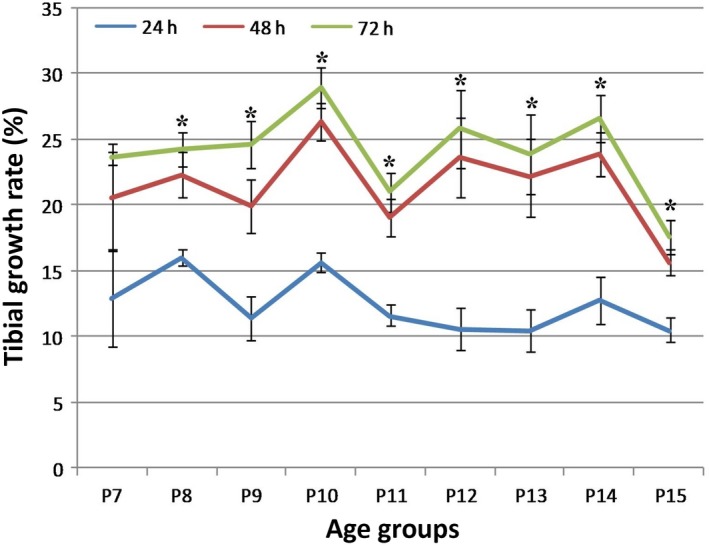
Methods: Forty-five postnatal Sprague-Dawley rat pups, 7-15 days old were divided into nine age groups (P7-P15). Five pups were allocated to each group. The rats were sacrificed and tibia and metatarsal bones were harvested. Bone lengths were measured after 0, 24, 48, and 72 hours of ex vivo incubation. Histology of bones was carried out, and GP lengths and chondrocyte densities were determined.
Results: There were significant differences in bone length among the age groups after 0 and 72 hours of incubation. Histological sectioning was possible in metatarsal bone from all age groups, and in tibia from 7- to 13-day-old rats. No significant differences in tibia and metatarsal GP lengths were seen among different age groups at 0 and 72 hours of incubation. Significant differences in chondrocyte densities along the epiphyseal GP of the bones between 0 and 72 hours of incubation were observed in most of the age groups.
Conclusion: Ex vivo growth of tibia and metatarsal bones of rats aged 7-15 days old is possible, with percentage growth rates of 23.87 ± 0.80% and 40.38 ± 0.95% measured in tibia and metatarsal bone, respectively. Histological sectioning of bones was carried out without the need for decalcification in P7-P13 tibia and P7-P15 metatarsal bone. Increases in chondrocyte density along the GP influence overall bone elongation.
Keywords: Sprague‐Dawley rat; bone growth model; chondrocytes; endochondral ossification; growth plate.
Conflict of interest statement
None.
Figures


Similar articles
-
Roles of Sodium Hydrogen Exchanger (NHE1) and Anion Exchanger (AE2) across Chondrocytes Plasma Membrane during Longitudinal Bone Growth.Membranes (Basel). 2022 Jul 14;12(7):707. doi: 10.3390/membranes12070707. Membranes (Basel). 2022. PMID: 35877910 Free PMC article.
-
Fluoride Inhibits Longitudinal Bone Growth by Acting Directly at the Growth Plate in Cultured Neonatal Rat Metatarsal Bones.Biol Trace Elem Res. 2020 Oct;197(2):522-532. doi: 10.1007/s12011-019-01997-9. Epub 2019 Dec 14. Biol Trace Elem Res. 2020. PMID: 31838736
-
Suppression of mammalian bone growth by membrane transport inhibitors.J Cell Biochem. 2013 Mar;114(3):658-68. doi: 10.1002/jcb.24408. J Cell Biochem. 2013. PMID: 23059814
-
Bone tissue and histological and molecular events during development of the long bones.Ann Anat. 2021 May;235:151704. doi: 10.1016/j.aanat.2021.151704. Epub 2021 Feb 16. Ann Anat. 2021. PMID: 33600952 Review.
-
Recent Insights into Long Bone Development: Central Role of Hedgehog Signaling Pathway in Regulating Growth Plate.Int J Mol Sci. 2019 Nov 20;20(23):5840. doi: 10.3390/ijms20235840. Int J Mol Sci. 2019. PMID: 31757091 Free PMC article. Review.
Cited by
-
Roles of Sodium Hydrogen Exchanger (NHE1) and Anion Exchanger (AE2) across Chondrocytes Plasma Membrane during Longitudinal Bone Growth.Membranes (Basel). 2022 Jul 14;12(7):707. doi: 10.3390/membranes12070707. Membranes (Basel). 2022. PMID: 35877910 Free PMC article.
References
-
- Mackie EJ, Tatarczuch L, Mirams M. The skeleton: a multi‐functional complex organ: the growth plate chondrocyte and endochondral ossification. J Endocrinol. 2011;211:109‐121. - PubMed
-
- Tsang KY, Chan D, Cheah KS. Fate of growth plate hypertrophic chondrocytes: death or lineage extension? Dev Growth Differ. 2015;57:179‐192. - PubMed
-
- Dowthwaite GP, Bishop JC, Redman SN, et al. The surface of articular cartilage contains a progenitor cell population. J Cell Sci. 2004;117:889‐897. - PubMed
-
- Loqman MY, Bush PG, Farquharson C, Hall AC. Suppression of mammalian bone growth by membrane transport inhibitors. J Cell Biochem. 2013;114:658‐668. - PubMed
LinkOut - more resources
Full Text Sources
