. 2019 Jul;62(7):1297-1311.
doi: 10.1007/s00125-019-4860-y. Epub 2019 Apr 24.

Nerve growth factor gene therapy improves bone marrow sensory innervation and nociceptor-mediated stem cell release in a mouse model of type 1 diabetes with limb ischaemia

Affiliations

Nerve growth factor gene therapy improves bone marrow sensory innervation and nociceptor-mediated stem cell release in a mouse model of type 1 diabetes with limb ischaemia

Zexu Dang et al. Diabetologia. 2019 Jul.

Abstract

Aims/hypothesis: Sensory neuropathy is common in people with diabetes; neuropathy can also affect the bone marrow of individuals with type 2 diabetes. However, no information exists on the state of bone marrow sensory innervation in type 1 diabetes. Sensory neurons are trophically dependent on nerve growth factor (NGF) for their survival. The aim of this investigation was twofold: (1) to determine if sensory neuropathy affects the bone marrow in a mouse model of type 1 diabetes, with consequences for stem cell liberation after tissue injury; and (2) to verify if a single systemic injection of the NGF gene exerts long-term beneficial effects on these phenomena.

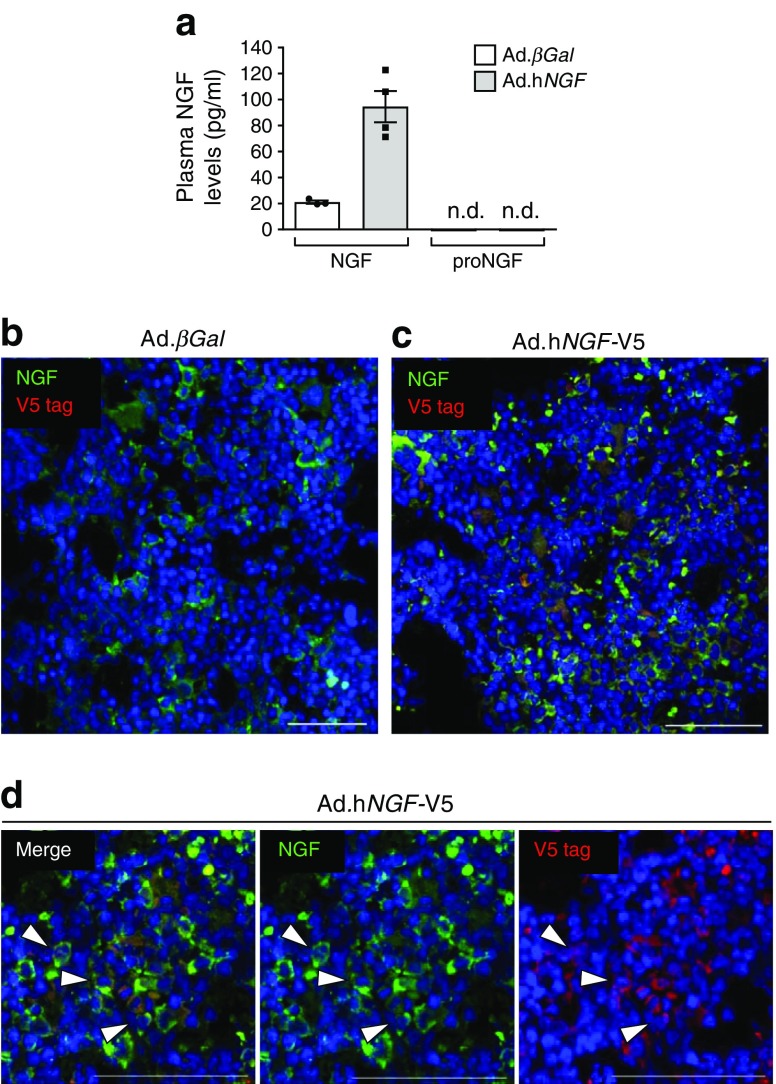
Methods: A mouse model of type 1 diabetes was generated in CD1 mice by administration of streptozotocin; vehicle was administered to non-diabetic control animals. Diabetic animals were randomised to receive systemic gene therapy with either human NGF or β-galactosidase. After 13 weeks, limb ischaemia was induced in both groups to study the recovery post injury. When the animals were killed, samples of tissue and peripheral blood were taken to assess stem cell mobilisation and homing, levels of substance P and muscle vascularisation. An in vitro cellular model was adopted to verify signalling downstream to human NGF and related neurotrophic or pro-apoptotic effects. Normally distributed variables were compared between groups using the unpaired Student's t test and non-normally distributed variables were assessed by the Wilcoxon-Mann-Whitney test. The Fisher's exact test was employed for categorical variables.

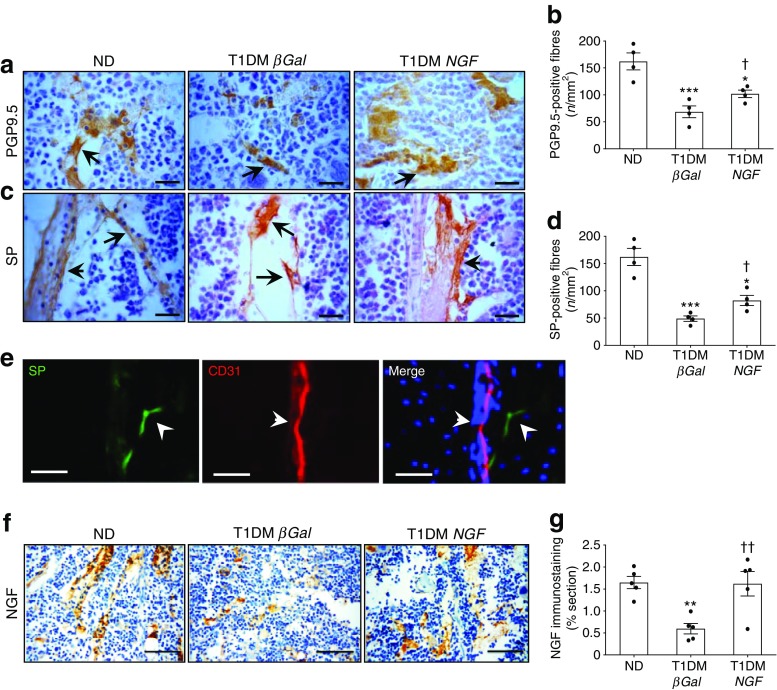
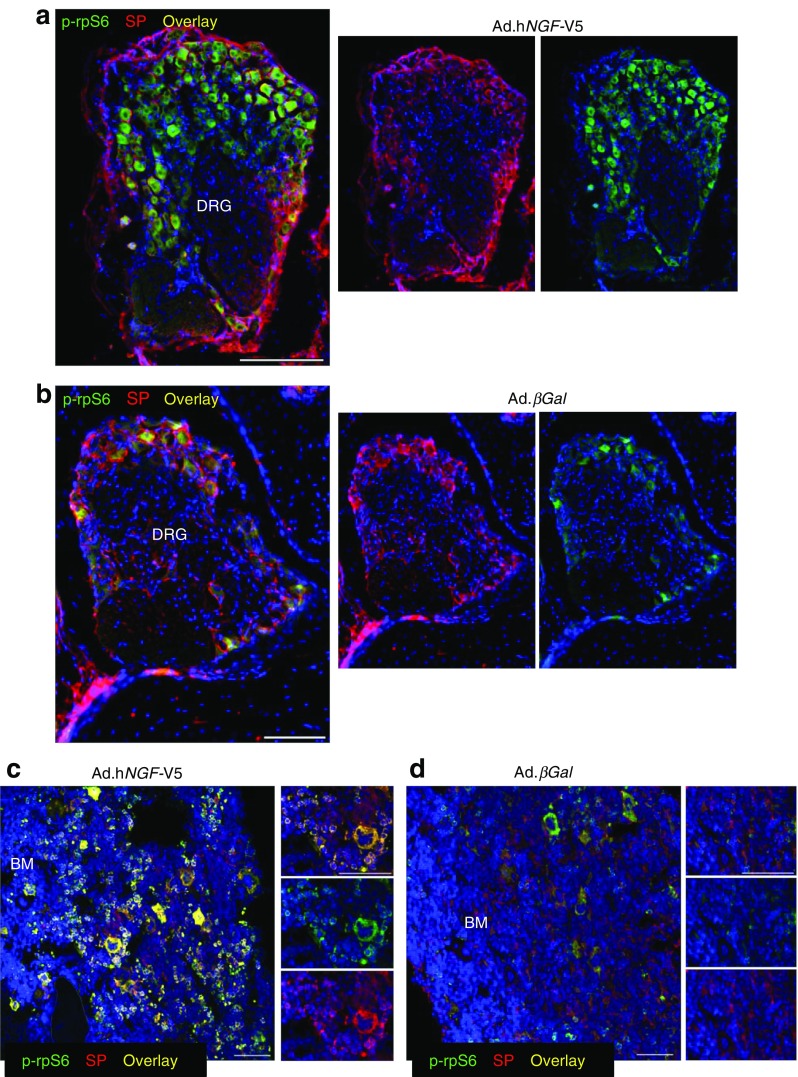
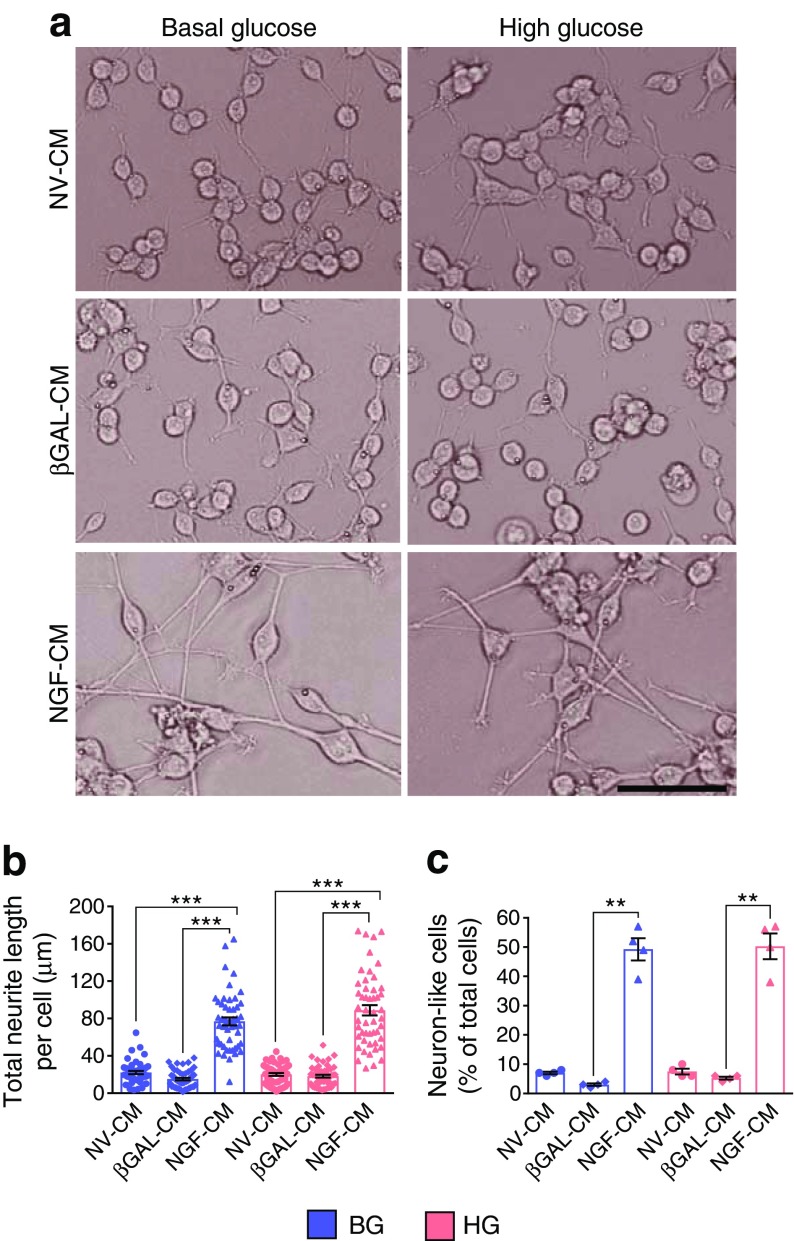
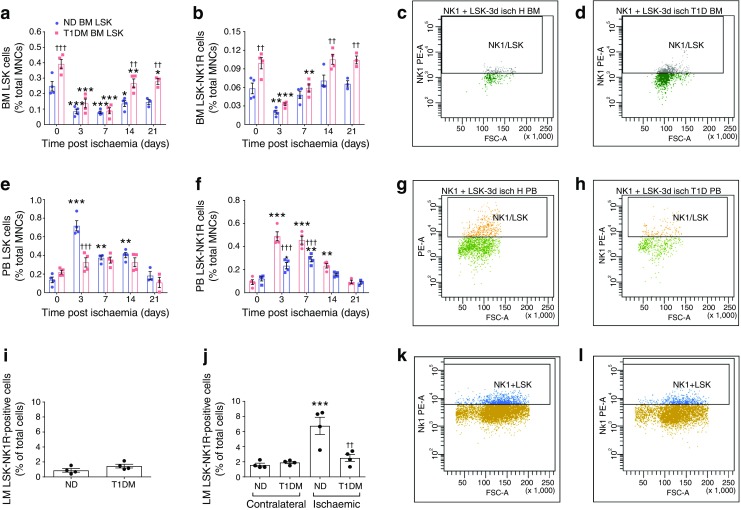
Results: Immunohistochemistry indicated a 3.3-fold reduction in the number of substance P-positive nociceptive fibres in the bone marrow of type 1 diabetic mice (p < 0.001 vs non-diabetic). Moreover, diabetes abrogated the creation of a neurokinin gradient which, in non-diabetic mice, favoured the mobilisation and homing of bone-marrow-derived stem cells expressing the substance P receptor neurokinin 1 receptor (NK1R). Pre-emptive gene therapy with NGF prevented bone marrow denervation, contrasting with the inhibitory effect of diabetes on the mobilisation of NK1R-expressing stem cells, and restored blood flow recovery from limb ischaemia. In vitro hNGF induced neurite outgrowth and exerted anti-apoptotic actions on rat PC12 cells exposed to high glucose via activation of the canonical neurotrophic tyrosine kinase receptor type 1 (TrkA) signalling pathway.

Conclusions/interpretation: This study shows, for the first time, the occurrence of sensory neuropathy in the bone marrow of type 1 diabetic mice, which translates into an altered modulation of substance P and depressed release of substance P-responsive stem cells following ischaemia. NGF therapy improves bone marrow sensory innervation, with benefits for healing on the occurrence of peripheral ischaemia. Nociceptors may represent a new target for the treatment of ischaemic complications in diabetes.

Keywords: Bone marrow; Bone marrow stem cells; Gene therapy; Nerve growth factor; Nociceptor; PC12 cells; Peripheral ischaemia; Sensory neuropathy; Substance P; Type 1 diabetes.


Figures

Fig. 1
Fig. 1
Gene therapy with NGF prevents bone marrow neuropathy. Immunohistochemical studies were carried out to compare the nerve fibre density in the bone marrow of non-diabetic and type 1 diabetic mice. The latter were randomised to receive Ad.hNGF or Ad.βGal. (ad) Representative micrographs and bar graphs showing the density of neuronal fibres expressing the pan-neuronal marker PGP9.5 (a, b) and nociceptive fibres positive for substance P (c, d) (scale bar, 20 μm). Arrows point to positive fibres. (e) Representative immunofluorescence microscopy images identify substance P-containing sensory terminals, which were often associated with CD31-positive vascular structures (arrows) (scale bar, 50 μm). (f, g) Representative micrographs and bar graphs showing the density of NGF-positive neuronal fibres in bone marrow (scale bar, 50 μm). n = 4 per group (b, d); n = 5 per group (g). Data are expressed as means ± SEM. *p < 0.05, **p < 0.01 and ***p < 0.001 vs non-diabetic animals; p < 0.05 and ††p < 0.01 vs type 1 diabetic mice with Ad.βGal. ND, non-diabetic; SP, substance P; T1DM, type 1 diabetic
Fig. 2
Fig. 2
Gene therapy with NGF activates TrkA signalling in sensory neurons and bone marrow cells of diabetic mice. (a, b) Representative immunofluorescence images showing that, 16 weeks post gene transfer, a higher number of substance P-positive sensory neuron bodies display phosphorylation of rpS6 in the DRG of diabetic mice receiving V5-tagged Ad.hNGF (a) compared with diabetic mice receiving Ad.βGal (b). Scale bar, 100 μm. (c, d) Representative immunofluorescence images showing that, in bone marrow of hNGF-treated mice, a higher number of cells are characterised by phosphorylation of rpS6 (c) compared with control mice receiving βGal (d). Scale bar, 50 μm. In all images, phospho-rpS6 is shown in green, substance P in red. DAPI, in blue, identifies nuclei. n = 3 mice, Ad.hNGF and n = 3 mice, Ad.βGal. BM, bone marrow; SP, substance P
Fig. 3
Fig. 3
Expression of recombinant hNGF in mouse plasma and bone marrow. (a) The expression of NGF and proNGF was measured by ELISA assay in mouse plasma 3 days post gene transfer (n = 4 Ad.hNGF and n = 3 Ad.βGal). Data are expressed as means ± SEM. (bd) The recombinant V5-tagged hNGF was detected by immunofluorescent staining in bone marrow cells of mice receiving gene therapy, at the end of the experimental procedure (16 weeks post gene transfer). Animals given Ad.βGal served as a negative control for the V5 staining. V5 is shown in red, NGF in green, and blue (DAPI) shows nuclei. Arrows point to some examples of double-positive cells. Scale bar, 50 μm. n.d., not detected
Fig. 4
Fig. 4
hNGF exerts neuroprotective effects in PC12 cells in vitro. (a) PC12 cells express the NGF receptors TrkA and p75NTR (green). DAPI identifies nuclei (blue). Scale bar, 50 μm. (b) Schematic showing the experimental model. Rat fibroblasts were transduced with Ad.hNGF or Ad.βGal; non-transduced cells served as the control. Conditioned medium from fibroblasts was collected after 48 h and used to mimic the paracrine action of circulating NGF on target PC12 cells in a basal- or high-glucose environment, or with mannitol as osmotic control. Endpoints of the experiments were NGF intracellular signalling, apoptosis assay and neural differentiation. (c) V5-tagged hNGF was detected by western blotting in fibroblast total cellular extracts and conditioned medium. Only the mature NGF was detected, indicating that preproNGF was successfully cleaved to the mature form. (d) ELISA detected 540 pg/ml mature NGF in the fibroblast-conditioned medium used for the experiments. No proNGF was detected. (e) Blots for phospho-proteins and corresponding non-phosphorylated forms associated with pro-survival TrkA and pro-apoptotic p75NTR signalling. (fk) Graphs showing blot densitometry (n = 1). In (gk), values are expressed as fold change of the basal glucose non-virus-conditioned medium. (l) Bar graph showing caspase 3/7 activity in PC12 exposed to either basal or high glucose or mannitol, for 48 h, in the presence of fibroblast-conditioned medium. Caspase activity, measured as relative luminescence units, is expressed as fold change of the basal glucose non-virus-conditioned-medium group (n = 4 per group). Data are expressed as means ± SEM. *p < 0.05 and **p < 0.01 between groups, as indicated. BG, basal glucose; CM, conditioned medium; Ctrl, control; E, total cellular extract; HG, high glucose; n.d., not detected; NV, non-virus; RLU, relative luminescence units
Fig. 5
Fig. 5
hNGF induces neuronal differentiation of PC12 cells in vitro. (a) Bright-field images showing that PC12 cells differentiate into neuron-like cells in the presence of hNGF for 3 days, in either basal- or high-glucose environments (for the schematic of the experiment, please see Fig. 4b). Scale bar, 50 μm. (b) Graph showing the total neurite length per cell (n = 50 cells per group assessed in four different imaging fields). (c) Graph showing the percentage of neuron-like cells, defined as cells presenting at least one axon longer than the cell body (n = 4 different imaging fields per group, for a total of n = 250–300 cells assessed per group). Data are expressed as means ± SEM. **p < 0.01 and ***p < 0.001 between groups, as indicated. Blue bars/symbols, basal glucose; pink bars/symbols, high glucose. BG, basal glucose; CM, conditioned medium; HG, high glucose; NV, non-virus
Fig. 6
Fig. 6
Impaired liberation and homing of nociceptor-expressing cells in type 1 diabetic mice subjected to unilateral limb ischaemia. (ah) Flow cytometry analyses showing the abundance of LSK and LSK-NK1R cells in the bone marrow (ad) and peripheral blood (e–h) of non-diabetic and type 1 diabetic mice before and after induction of limb ischaemia. Data are expressed as percentage of mononuclear cells. Representative images of gating performed on samples of bone marrow: (c) non-diabetic and (d) type 1 diabetic; and peripheral blood: (g) non-diabetic and (h) type 1 diabetic, collected at 3 days post limb ischaemia. n = 5 mice per group; *p < 0.05, **p < 0.01 and ***p < 0.001 vs time 0; ††p < 0.01 and †††p < 0.001 vs non-diabetic animals. (il) Flow cytometry analyses of LSK-NK1R cells in murine muscles. Bar graphs showing the levels of LSK-NK1R cells in normoperfused limb muscles from non-operated mice (i), and LSK-NK1R cells in contralateral and ischaemic limb muscles collected 3 days post limb ischaemia from non-diabetic and type 1 diabetic mice (j). Typical gates of flow cytometry analyses performed on ischaemic limb muscles from non-diabetic (k) and type 1 diabetic (l) mice. n = 4 per group. ***p < 0.001 vs contralateral; ††p < 0.01 vs non-diabetic. All data are expressed as means ± SEM. BM, bone marrow; FSC-A, forward scatter-area; LM, limb muscle; MNC, mononuclear cell; ND, non-diabetic; PB, peripheral blood; PE-A, phycoerythrin area; T1DM, type 1 diabetic
Fig. 7
Fig. 7
Systemic NGF therapy improves recovery from limb ischaemia. (a, b) Line graph (a) and representative laser Doppler images (b) of limb muscle reperfusion. (ce) Bar graph (c, d) and representative fluorescent microphotographs (e) of capillary and arteriole density in limb muscles of non-diabetic and type 1 diabetic mice treated with Ad.hNGF or Ad.βGal. (e) Capillary endothelial cells are stained with isolectin B4 (green) and arterioles with α-smooth muscle actin (red). Nuclei are stained with DAPI (blue). Scale bar, 50 μm. Bar graphs (c, d) summarise capillary and arteriole density data. In (c) n = 6 per non-diabetic group and type 1 diabetic NGF; n = 7 per type 1 diabetic βGal. In (d) n = 6 per group. Data are expressed as means ± SEM. **p < 0.01 vs non-diabetic; ††p < 0.01 vs type 1 diabetic βGal. ND, non-diabetic; T1DM, type 1 diabetic
Fig. 8
Fig. 8
Systemic NGF therapy restores proper mobilisation of nociceptor-expressing cells in diabetic mice with limb ischaemia. (ac) Bar graphs (a, b) and representative gating (c) from the flow cytometry analysis of bone marrow collected 3 days after limb ischaemia in non-diabetic and type 1 diabetic mice treated with Ad.βGal or Ad.hNGF. (df) Bar graphs (d, e) and representative gating (f) from the flow cytometry analysis of cells in peripheral blood collected 3 days after limb ischaemia. (gi) Bar graphs (g, h) and representative gating (i) from the flow cytometry analysis of adductor limb muscles collected 3 days after limb ischaemia. Data are expressed as fold change in the number of positive cells vs pre-ischaemia (a, b, d, e) or contralateral limb muscle (g, i). n = 4 per group. Data are expressed as means ± SEM. *p < 0.05, **p < 0.01 and ***p < 0.001 vs non-diabetic mice; p < 0.05, ††p < 0.01 and †††p < 0.001 vs type 1 diabetic βGal mice. BM, bone marrow; LM, limb muscle; ND, non-diabetic; PB, peripheral blood; T1DM, type 1 diabetic
Fig. 9
Fig. 9
Systemic NGF therapy restores the substance P gradient in diabetic mice with limb ischaemia. (ac) Bar graphs showing the results of ELISA measurements of substance P in bone marrow (a), peripheral blood (b) and limb muscles (c) before (day 0) and after (days 1 and 3) induction of limb ischaemia in non-diabetic and type 1 diabetic mice treated with Ad.βGal or Ad.hNGF. n = 5 per non-diabetic group 0 and 3 days; n = 4 per remaining groups. (d, e) Representative images (d) and bar graph (e) showing the expression of substance P in limb muscles before (day 0) and after limb ischaemia (day 1). Scale bar, 20 μm. n = 3 per group. *p < 0.05, **p < 0.01 and ***p < 0.01 vs pre-ischaemia; p < 0.05 and ††p < 0.01 vs type 1 diabetic mice treated with Ad.βGal; p < 0.05, ‡‡p < 0.01 and ‡‡‡p < 0.001 vs non-diabetic mice. (f) Bar graph showing the in vitro migration capacity of LSK and LSK-NK1R bone marrow cells from non-diabetic and type 1 diabetic mice towards substance P. n = 10 per group; **p < 0.01 and ***p < 0.001 vs non-diabetic mice. All data are expressed as means ± SEM. AU, arbitrary units; BM, bone marrow; LM, limb muscle; ND, non-diabetic; PB, peripheral blood; SP, substance P; T1DM, type 1 diabetic

Similar articles

Cited by

References

    1. (2008) The global challenge of diabetes. Lancet 371: 1723 - PubMed
    1. Ismail-Beigi Faramarz, Craven Timothy, Banerji Mary Ann, Basile Jan, Calles Jorge, Cohen Robert M, Cuddihy Robert, Cushman William C, Genuth Saul, Grimm Richard H, Hamilton Bruce P, Hoogwerf Byron, Karl Diane, Katz Lois, Krikorian Armand, O'Connor Patrick, Pop-Busui Rodica, Schubart Ulrich, Simmons Debra, Taylor Harris, Thomas Abraham, Weiss Daniel, Hramiak Irene. Effect of intensive treatment of hyperglycaemia on microvascular outcomes in type 2 diabetes: an analysis of the ACCORD randomised trial. The Lancet. 2010;376(9739):419–430. doi: 10.1016/S0140-6736(10)60576-4. - DOI - PMC - PubMed
    1. Pop-Busui R., Evans G. W., Gerstein H. C., Fonseca V., Fleg J. L., Hoogwerf B. J., Genuth S., Grimm R. H., Corson M. A., Prineas R. Effects of Cardiac Autonomic Dysfunction on Mortality Risk in the Action to Control Cardiovascular Risk in Diabetes (ACCORD) Trial. Diabetes Care. 2010;33(7):1578–1584. doi: 10.2337/dc10-0125. - DOI - PMC - PubMed
    1. Boulton AJ, Vinik AI, Arezzo JC, et al. Diabetic neuropathies: a statement by the American Diabetes Association. Diabetes Care. 2005;28(4):956–962. doi: 10.2337/diacare.28.4.956. - DOI - PubMed
    1. Reinisch CM, Traxler H, Piringer S, Tangl S, Nader A, Tschachler E. Rarefaction of the peripheral nerve network in diabetic patients is associated with a pronounced reduction of terminal Schwann cells. Diabetes Care. 2008;31(6):1219–1221. doi: 10.2337/dc07-1832. - DOI - PubMed

Publication types

Substances