. 2019 Jun;43(6):2303-2318.
doi: 10.3892/ijmm.2019.4158. Epub 2019 Apr 9.

Analysis of a nanoparticle‑enriched fraction of plasma reveals miRNA candidates for Down syndrome pathogenesis

Affiliations

Analysis of a nanoparticle‑enriched fraction of plasma reveals miRNA candidates for Down syndrome pathogenesis

Alessandro Salvi et al. Int J Mol Med. 2019 Jun.

Erratum in

Abstract

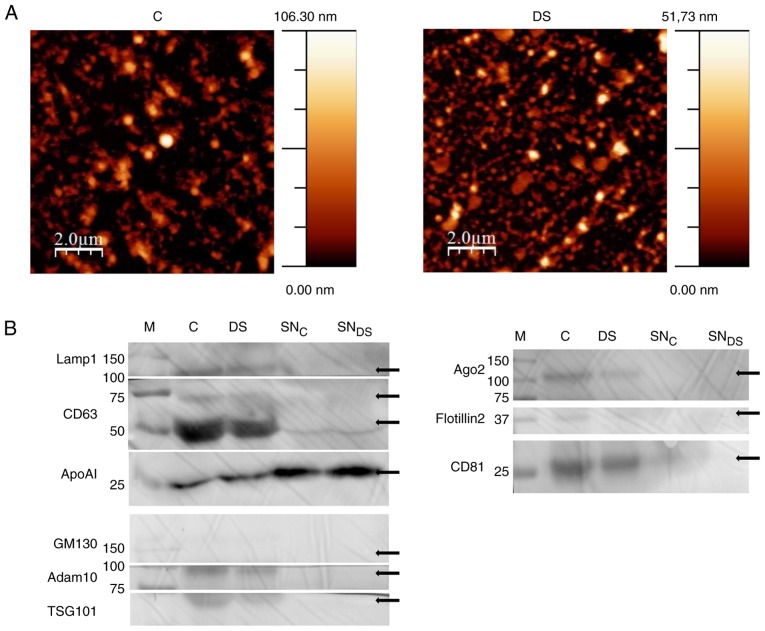
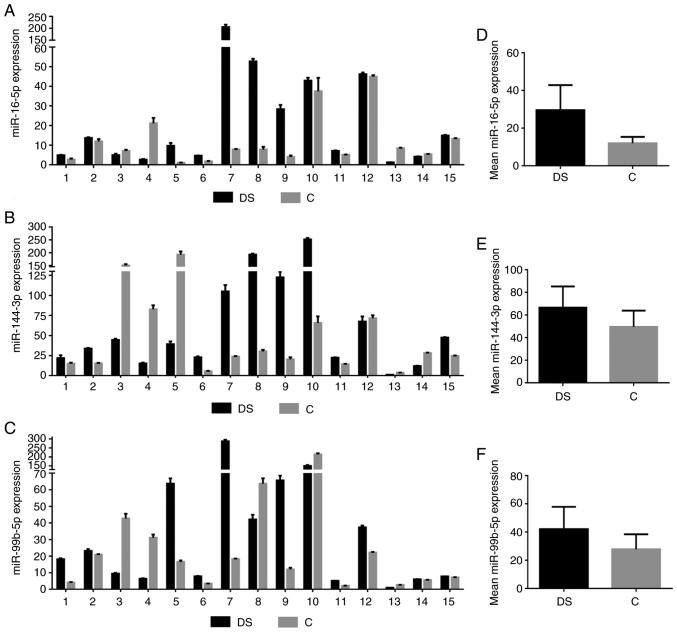
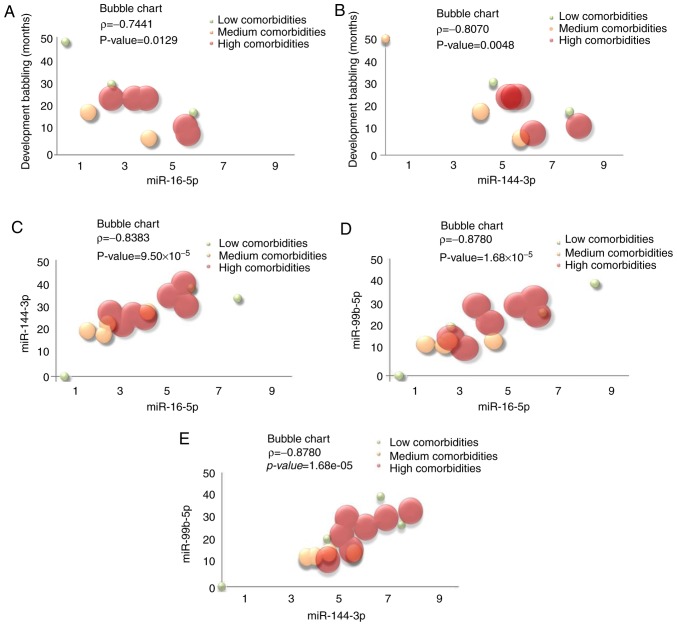
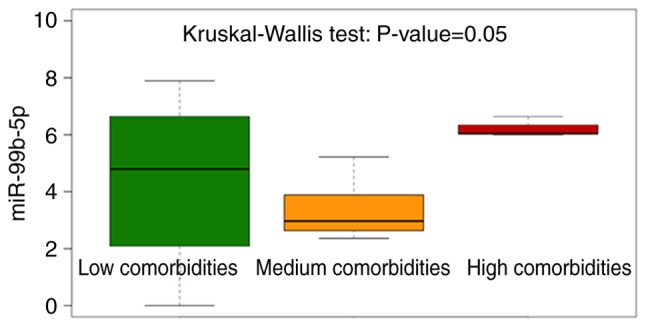
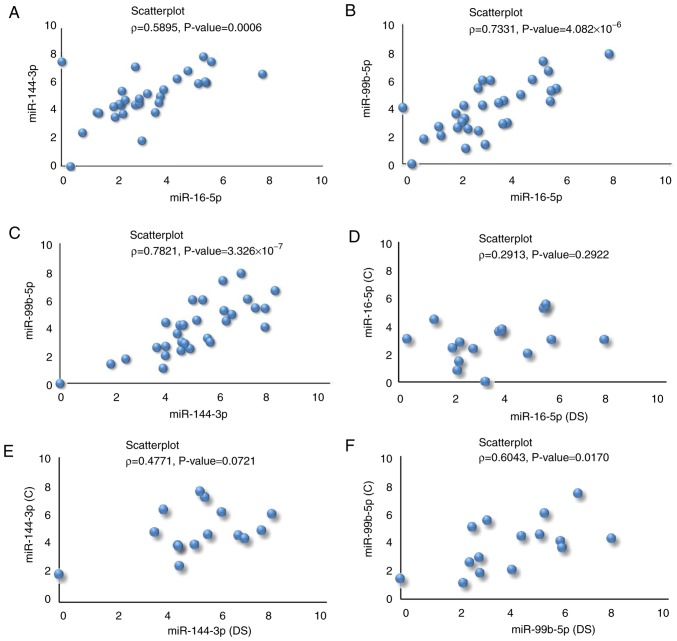
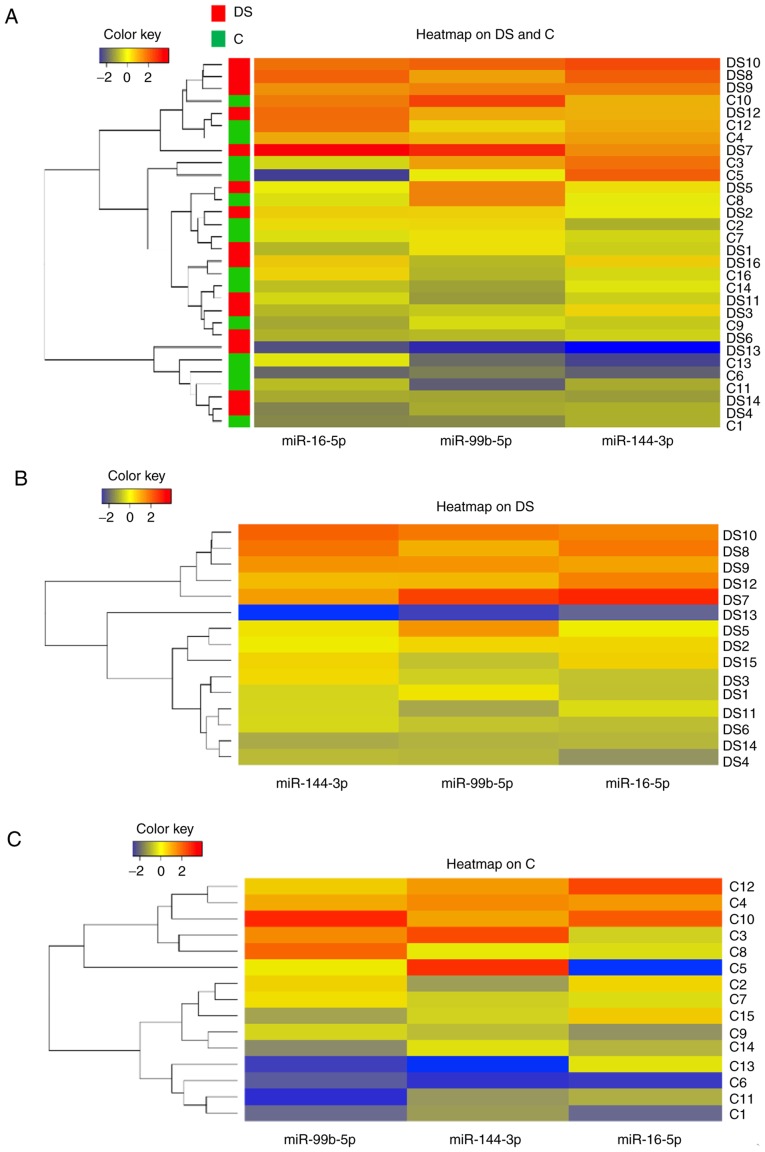
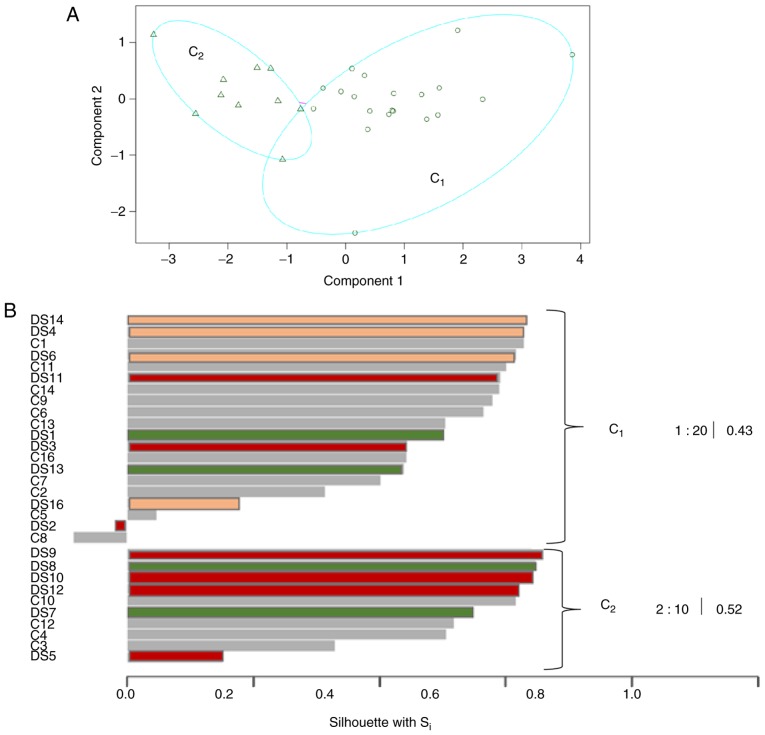
Down syndrome (DS) is caused by the presence of part or all of a third copy of chromosome 21. DS is associated with several phenotypes, including intellectual disability, congenital heart disease, childhood leukemia and immune defects. Specific microRNAs (miRNAs/miR) have been described to be associated with DS, although none of them so far have been unequivocally linked to the pathology. The present study focuses to the best of our knowledge for the first time on the miRNAs contained in nanosized RNA carriers circulating in the blood. Fractions enriched in nanosized RNA‑carriers were separated from the plasma of young participants with DS and their non‑trisomic siblings and miRNAs were extracted. A microarray‑based analysis on a small cohort of samples led to the identification of the three most abundant miRNAs, namely miR‑16‑5p, miR‑99b‑5p and miR‑144‑3p. These miRNAs were then profiled for 15 pairs of DS and non‑trisomic sibling couples by reverse transcription‑quantitative polymerase chain reaction (RT‑qPCR). Results identified a clear differential expression trend of these miRNAs in DS with respect to their non‑trisomic siblings and gene ontology analysis pointed to their potential role in a number of typical DS features, including 'nervous system development', 'neuronal cell body' and certain forms of 'leukemia'. Finally, these expression levels were associated with certain typical quantitative and qualitative clinical features of DS. These results contribute to the efforts in defining the DS‑associated pathogenic mechanisms and emphasize the importance of properly stratifying the miRNA fluid vehicles in order to probe biomolecules that are otherwise hidden and/or not accessible to (standard) analysis.


Figures

Figure 1
Figure 1
NEF characterization by AFM and western blotting. (A) Morphological analysis by AFM of C and DS NEF preparations. Images are representative of 3 independent experiments. (B) NEF obtained from C and DS plasma and the corresponding supernatants (SNC and SNDS) were immunoblotted for the indicated extracellular vesicles and high density lipoprotoeins markers (see text for details). Due to antibody-unspecific signals, the original image of western blotting membranes has been cropped. The uncropped, original image is available upon request. DS, Down syndrome; C, healthy control; NEF, nanoparticle-enriched fraction; AFM, atomic force microscopy; miR, microRNA; SNC, SNDS, C and DS plasma corresponding supernatants; M, marker; CD, cluster of differentiation.
Figure 2
Figure 2
Expression levels of miRNAs in NEF from the couples of siblings. Relative expression levels of (A) mature miR-16-5p, (B) miR-144-3p and (C) miR-99b-5p in each of the 15 siblings couples obtained by quantitative polymerase chain reaction. Average expression levels of (D) miR-16-5p, (E) miR-114-3p and (F) miR-99b-5p in individuals with DS and in control subjects. miR, microRNA; DS, Down syndrome; C, healthy control.
Figure 3
Figure 3
Bubble charts for the graphical representation of the significant association (ϱ > |0.7|, P<0.05) between the quantitative variables. The bubble diameter is proportional to the variable Number of comorbidities: High number of comorbidities is represented with a red circle while few numbers of comorbidities with a green circle and the orange circles are a middle way. (A) Linear negative association between miR-16-5p expression levels and the clinical feature 'development babbling' expressed in months. (B) Linear negative association between miR-144-3p and the clinical feature 'development babbling' expressed in months. (C) Linear positive association between miR16-5p and miR-144-3p expression levels. (D) Linear positive association between miR16-5p and miR-99b-5p expression levels. (E) Linear positive association between miR144-3p and miR-99b-5p expression levels.
Figure 4
Figure 4
Box plot on miR-99b-5p expression level using like grouping variable classification based on the number of comorbidities (Low, Medium and High). The individuals with Down syndrome bearing high comorbidities display the highest miR-99b-5p expression levels. miR, microRNA.
Figure 5
Figure 5
Scatter plots (with r and corresponding P-value) computed on all subjects (DS+C) evidencing the significant linear positive association between the miRs expression levels: (A) miR-16-5p vs. miR144-3p, (B) miR-16-5p vs. miR-99b-5p and (C) miR-144-3p vs. miR-99b-5p expression. Scatter plot (with ρ and corresponding P-value) of each miR expression levels [(D) miR-16-5p; (E) miR-144-3p and (F) miR-99b-5p], measured on DS vs. their corresponding siblings, C. The unique significant positive linear correlation is for miR-99b-5p. miR, microRNA; DS, Down syndrome; C, healthy.
Figure 6
Figure 6
Heatmaps of the expression levels of miR-16-5p, miR-144-3p and miR-99b-5p. (A) Heatmaps on the entire sample DS+C, (B) on subjects with DS and (C) on healthy individuals. DS, Down syndrome; C, healthy individuals.
Figure 7
Figure 7
Partitioning around medoids algorithm based on miRs expression levels of DS and C, highlighting 2 well separated clusters [Cluster 1(C1), subjects indicated with circles and cluster 2, (C2), subjects indicated with triangles]. (A) Silhouettes computed for each subject in the analysis. The ID of each subject is reported on the left side of the graph and the DS silhouettes are colored using the classification based on number of comorbidities. Cluster 1 (C1) contains subjects with low median and mean expression values for each miR with a prevalence of C subjects. Cluster 2 (C2) (comprising 60% of individuals with DS) with higher miR expressions and furthermore 60% of their corresponding siblings belongs to the same cluster. (B) miR, microRNA; DS, Down syndrome; C, healthy.

References

    1. Strippoli P, Pelleri MC, Caracausi M, Vitale L, Piovesan A, Locatelli C, Mimmi MC, Berardi AC, Ricotta D, Radeghieri A, et al. An integrated route to identifying new pathogenesis-based therapeutic approaches for trisomy 21 (Down Syndrome) following the thought of Jérôme Lejeune. Sci Postprint. 2013;1:e00010. doi: 10.14340/spp.2013.12R0005. - DOI
    1. Delabar JM, Allinquant B, Bianchi D, Blumenthal T, Dekker A, Edgin J, O'Bryan J, Dierssen M, Potier MC, Wiseman F, et al. Changing paradigms in down syndrome: The first international conference of the trisomy 21 research society. Mol Syndromol. 2016;7:251–261. doi: 10.1159/000449049. - DOI - PMC - PubMed
    1. Lejeune J, Gauthier M, Turpin R. Human chromosomes in tissue cultures. C R Hebd Seances Acad Sci. 1959;248:602–603. In French. - PubMed
    1. Chen YQ, Li T, Guo WY, Su FJ, Zhang YX. Identification of altered pathways in down syndrome-associated congenital heart defects using an individualized pathway aberrance score. Genet Mol Res. 2016;15 - PubMed
    1. Pelleri MC, Gennari E, Locatelli C, Piovesan A, Caracausi M, Antonaros F, Rocca A, Donati CM, Conti L, Strippoli P, et al. Genotype-phenotype correlation for congenital heart disease in down syndrome through analysis of partial trisomy 21 cases. Genomics. 2017;109:391–400. doi: 10.1016/j.ygeno.2017.06.004. - DOI - PubMed