. 2019 Jul;33(7):8504-8518.
doi: 10.1096/fj.201802635R. Epub 2019 Apr 24.

Correlative SICM-FCM reveals changes in morphology and kinetics of endocytic pits induced by disease-associated mutations in dynamin

Affiliations

Correlative SICM-FCM reveals changes in morphology and kinetics of endocytic pits induced by disease-associated mutations in dynamin

Tayyibah Ali et al. FASEB J. 2019 Jul.

Abstract

Dynamin 2 (DNM2) is a GTP-binding protein that controls endocytic vesicle scission and defines a whole class of dynamin-dependent endocytosis, including clathrin-mediated endocytosis by caveoli. It has been suggested that mutations in the DNM2 gene, associated with 3 inherited diseases, disrupt endocytosis. However, how exactly mutations affect the nanoscale morphology of endocytic machinery has never been studied. In this paper, we used live correlative scanning ion conductance microscopy (SICM) and fluorescence confocal microscopy (FCM) to study how disease-associated mutations affect the morphology and kinetics of clathrin-coated pits (CCPs) by directly following their dynamics of formation, maturation, and internalization in skin fibroblasts from patients with centronuclear myopathy (CNM) and in Cos-7 cells expressing corresponding dynamin mutants. Using SICM-FCM, which we have developed, we show how p.R465W mutation disrupts pit structure, preventing its maturation and internalization, and significantly increases the lifetime of CCPs. Differently, p.R522H slows down the formation of CCPs without affecting their internalization. We also found that CNM mutations in DNM2 affect the distribution of caveoli and reduce dorsal ruffling in human skin fibroblasts. Collectively, our SICM-FCM findings at single CCP level, backed up by electron microscopy data, argue for the impairment of several forms of endocytosis in DNM2-linked CNM.-Ali, T., Bednarska, J., Vassilopoulos, S., Tran, M., Diakonov, I. A., Ziyadeh-Isleem, A., Guicheney, P., Gorelik, J., Korchev, Y. E., Reilly, M. M., Bitoun, M., Shevchuk, A. Correlative SICM-FCM reveals changes in morphology and kinetics of endocytic pits induced by disease-associated mutations in dynamin.

Keywords: Charcot-Marie-Tooth; caveolin; clathrin; myopathy.


Conflict of interest statement

The authors thank Dr. P. Novak (Queen Mary University of London) for scanning software development, Dr. Andy Rogers (Royal Brompton and Harefield NHS Trust) for expertise in TEM, and Dr. Benedict Reilly-O’Donnell (National Heart and Lung Institute, Department of Cardiac Medicine, Imperial College London, London, United Kingdom) for proofreading of the manuscript. This work was supported by PhD studentship to T.A. from Muscular Dystrophy UK (Grant P49914 to A.S.), Biotechnology and Biological Sciences Research Council (BBSRC) funding to A.S. (BB/M022080/1), the Agence Nationale de la Recherche (Grant ANR-14-CE12-0009 to M.B. and Young Researcher Grant ANR-14-CE12-0001-01 to S.V.), and British Heart Foundation (BHF) funding for J.G. and I.A.D. (RG/17/13/33173). A.S. and Y.K. are shareholders in ICAPPIC, Ltd., a company commercializing nanopipette-based instrumentation. The authors declare no other conflicts of interest.

Figures

Figure 1
Figure 1
Schematic diagram and principle of operation of SICM-FCM imaging setup. A) Diagram showing SICM nanopipette mounted on Z piezo actuator and positioned above living cells grown in a Petri dish. The sample stage is raster scanned in horizontal plane by the XY piezo. The nanopipette is aligned to be coaxial with the laser beam that is fed through the inverted microscope objective to enable simultaneous, correlative topographical and fluorescence confocal imaging. The same objective is used to collect the excited fluorescence, which is then detected by the photomultiplier (PMT). B) Principle of SICM operation diagram showing the cross section of the setup arrangement. The laser beam (blue) is focused at the tip of the nanopipette where it (beam) creates confocal volume and excites fluorescence (green). Bias voltage is applied between the measuring electrode inside the nanopipette and the reference electrode in the dish and results in ion current that drops to predefined set-point every time pipette approaches the cell surface. C) Experimental measurement showing the trace of the vertical (Z) piezo position during hopping (top trace) and corresponding ion current drop at the lowest point of each approach (bottom). D) Example images of CCP seen as an indentation in 3D topography (left) and corresponding CLC-GFP fluorescence image (right).
Figure 2
Figure 2
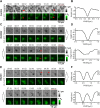
Correlative SICM-FCM time-lapse imaging of CME in Cos-7 cells transfected with DNM2-GFP. A) Sequence of topographical (top row) and fluorescence images (bottom row) showing CCP (red arrow) nucleation, maturation, and closure in cells transfected with DNM2-WT-GFP. B) Individual cross section profiles of single CCP showing topographically resolved pit width and depth (top trace) and corresponding DNM2-WT-GFP fluorescence. C) Series of cross section profiles at locations shown with white dashed lines in sequence A concatenated in 1 continuous record, demonstrating highest dynamin recruitment during CCP closure (red arrow). D) Sequence of topographical and fluorescence images showing CCP nucleation, widening, and disintegration in cells transfected with mutant DNM2-R465W-GFP. E) Topographical cross section profiles of CCP at consecutive stages of disintegration corresponding to white dashed lines in sequence D illustrating pit widening. F) Sequence of topographical and fluorescence images showing CCP nucleation, widening, and disintegration in cell transfected with mutant DNM2-R522H-GFP.
Figure 3
Figure 3
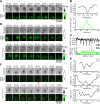
Correlative SICM-FCM time-lapse imaging of CME in human skin fibroblasts transfected with CLC-GFP. A) Sequence of topographical (top row) and fluorescence images (bottom row) showing CCP (red arrow) nucleation, maturation, and closure in cells from healthy individuals transfected with CLC-GFP. B) Individual cross section profile of CCP corresponding to white dashed line in sequence A. C) Sequence of topographical and fluorescence images showing CCP nucleation, widening, and disintegration in cells from patients with p.R465W mutation. D) Topographical cross section profiles of CCP at consecutive stages of disintegration corresponding to white dashed lines in sequence C illustrating pit widening. E) Sequence of topographical and fluorescence images showing CCP cluster in cell from patient with p.R522H mutation. F) Topographical cross section profiles of CCP corresponding to white dashed lines in sequence E illustrating 2 static pits.
Figure 4
Figure 4
TEM analysis of CCPs and caveoli in human skin fibroblasts. A–C) Control (Ctrl; healthy individual) (A); cells with p.R465W mutation (B); cells with p.R522H mutation (C). White bold arrows point at CCPs, black arrows point at caveoli, and arrowhead points at internalized caveoli. Asterisk marks caveolar stomatal diaphragms. Scale bars, 200 nm. D) Densities of CCPs at different stages of life cycle. E) Densities of total CCPs and caveoli. F) Densities of membrane-bound and internalized caveoli. The density is expressed as pits per micrometer of membrane length. *P < 0.05, **P < 0.005.
Figure 5
Figure 5
TEM views of the cytoplasmic surface of the plasma membrane from unroofed human skin fibroblasts. Representative images from a healthy individual (AD), subject with p.R465W mutation (EI), and subject with p.R522H mutation (JL) are shown. A) Survey view of the cytoplasmic surface of the plasma membrane from unroofed primary human fibroblasts of a healthy individual. B) Higher magnification view of caveolae-rich region corresponding to the boxed region in A. C) Higher magnification view of the caveolae-rich region in B. D) Higher magnification views of CCPs and caveolae from the cell presented in C. E) Survey view of the cytoplasmic surface of the plasma membrane from unroofed primary human fibroblasts of a subject with p.R465W mutation. F) Higher magnification view corresponding to the boxed region in E. G) Higher magnification view of the caveolae-rich region in F. H) Survey view of the cytoplasmic surface of the plasma membrane from unroofed primary human fibroblasts of a subject with R465W mutation. I) Higher magnification view of CCPs corresponding to the boxed region in H. J) Survey view of the cytoplasmic surface of the plasma membrane from unroofed primary human fibroblasts of a subject with p.R522H mutation. K) Higher magnification view of caveolae-rich region corresponding to the boxed region in J. L) Higher magnification views of caveolae and CCPs from the cell pictured in J. Arrowheads point at CCPs, and small arrows in D point at caveolae. Scale bars, 1 µm (I, K, L); 2 µm (B, F); 10 µm (A, E, H, J); 500 µm [C, D, G, I (inset)].
Figure 6
Figure 6
Simultaneous uptake of fluorescently labeled Tfn AlexaFluor 647 (red) and CTxB FITC (green) in human skin fibroblasts. Epi-fluorescence images of fibroblasts. A) Control (healthy individual). B) Cells with p.R465W mutation. C) Cells with p.R522H mutation. Image size 333 × 333 μm (AC). D, E) Comparison of uptake levels of Tfn (D) and CTxB (E) measured in individual cells; n = 79 (control), n = 100 (p.R465W), n = 69 (p.R522H). *P < 0.05, **P < 0.005, ****P < 0.0001.
Figure 7
Figure 7
Characterization of human skin fibroblast morphology using SICM topographical imaging. Large-scale SICM 3D topographical images (left column) showing human skin fibroblasts. A) Control (healthy individual). B) Cells with p.R465W. C) Cells with p.R522H mutations. Middle column shows higher-resolution images of corresponding cells, revealing membrane morphology with characteristic membrane ruffling. Right column shows distribution of the membrane surface area stored in membrane ruffles and microvilli calculated as a difference between the cell total surface area and surface area calculated for low-pass filtered cell surface. Inset shows unprocessed (black trace) and low-pass filtered (red trace) cross section profiles of SICM topographical image.

References

    1. Van der Bliek A. M., Redelmeier T. E., Damke H., Tisdale E. J., Meyerowitz E. M., Schmid S. L. (1993) Mutations in human dynamin block an intermediate stage in coated vesicle formation. J. Cell Biol. 122, 553–563 - PMC - PubMed
    1. Praefcke G. J. K., McMahon H. T. (2004) The dynamin superfamily: universal membrane tubulation and fission molecules? Nat. Rev. Mol. Cell Biol. 5, 133–147 - PubMed
    1. Oh P., McIntosh D. P., Schnitzer J. E. (1998) Dynamin at the neck of caveolae mediates their budding to form transport vesicles by GTP-driven fission from the plasma membrane of endothelium. J. Cell Biol. 141, 101–114 - PMC - PubMed
    1. Mooren O. L., Kotova T. I., Moore A. J., Schafer D. A. (2009) Dynamin2 GTPase and cortactin remodel actin filaments. J. Biol. Chem. 284, 23995–24005 - PMC - PubMed
    1. Bitoun M., Maugenre S., Jeannet P.-Y., Lacène E., Ferrer X., Laforêt P., Martin J.-J., Laporte J., Lochmüller H., Beggs A. H., Fardeau M., Eymard B., Romero N. B., Guicheney P. (2005) Mutations in dynamin 2 cause dominant centronuclear myopathy. Nat. Genet. 37, 1207–1209 - PubMed

Publication types

LinkOut - more resources