. 2019 Apr 24;14(4):e0213422.
doi: 10.1371/journal.pone.0213422. eCollection 2019.

Sustained Ca2+ mobilizations: A quantitative approach to predict their importance in cell-cell communication and wound healing

Affiliations

Sustained Ca2+ mobilizations: A quantitative approach to predict their importance in cell-cell communication and wound healing

Yoonjoo Lee et al. PLoS One. .

Abstract

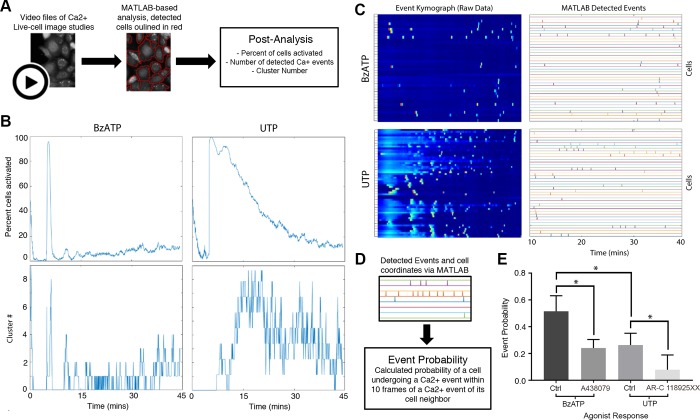
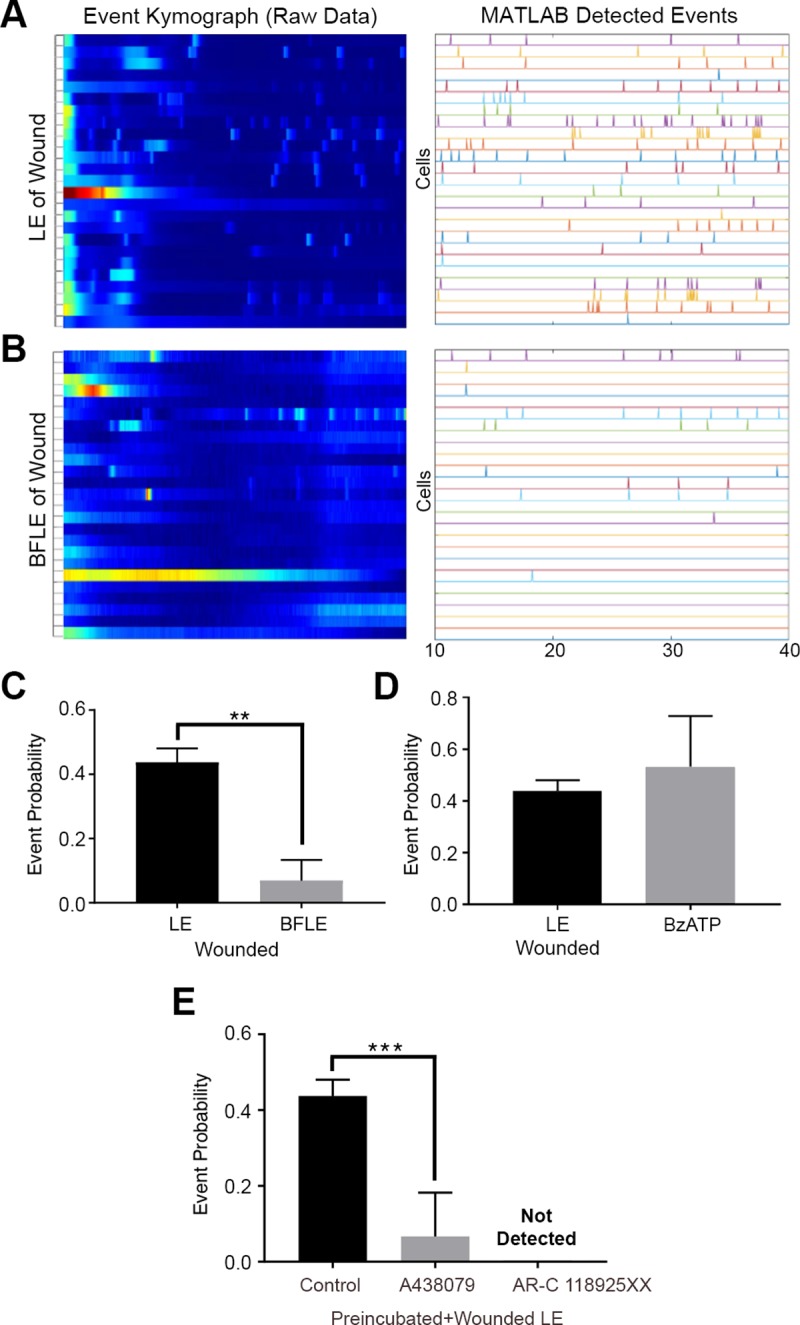
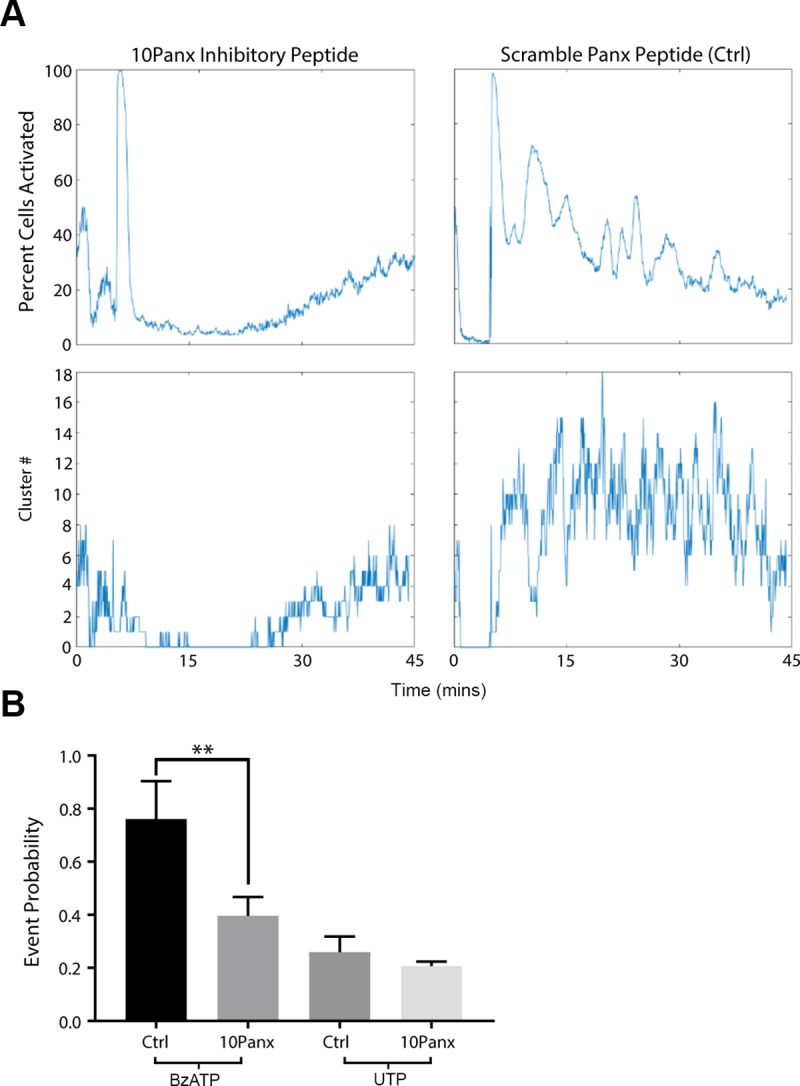
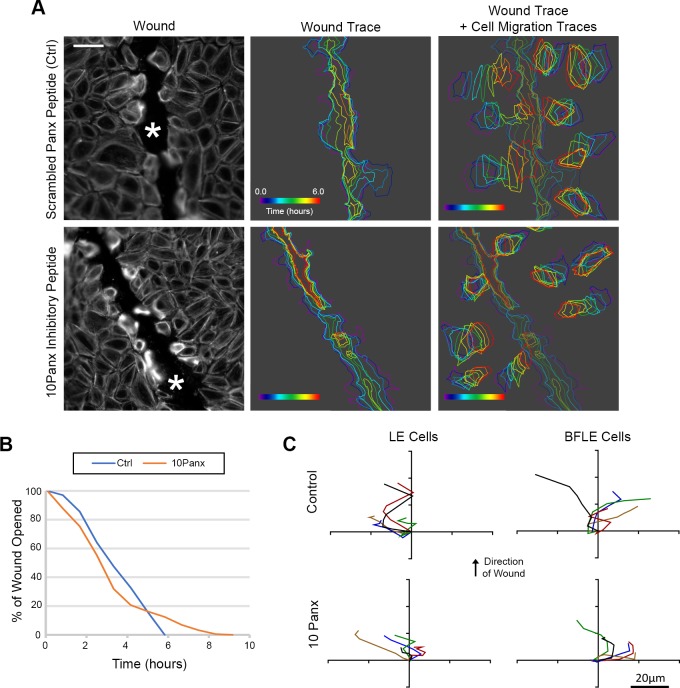
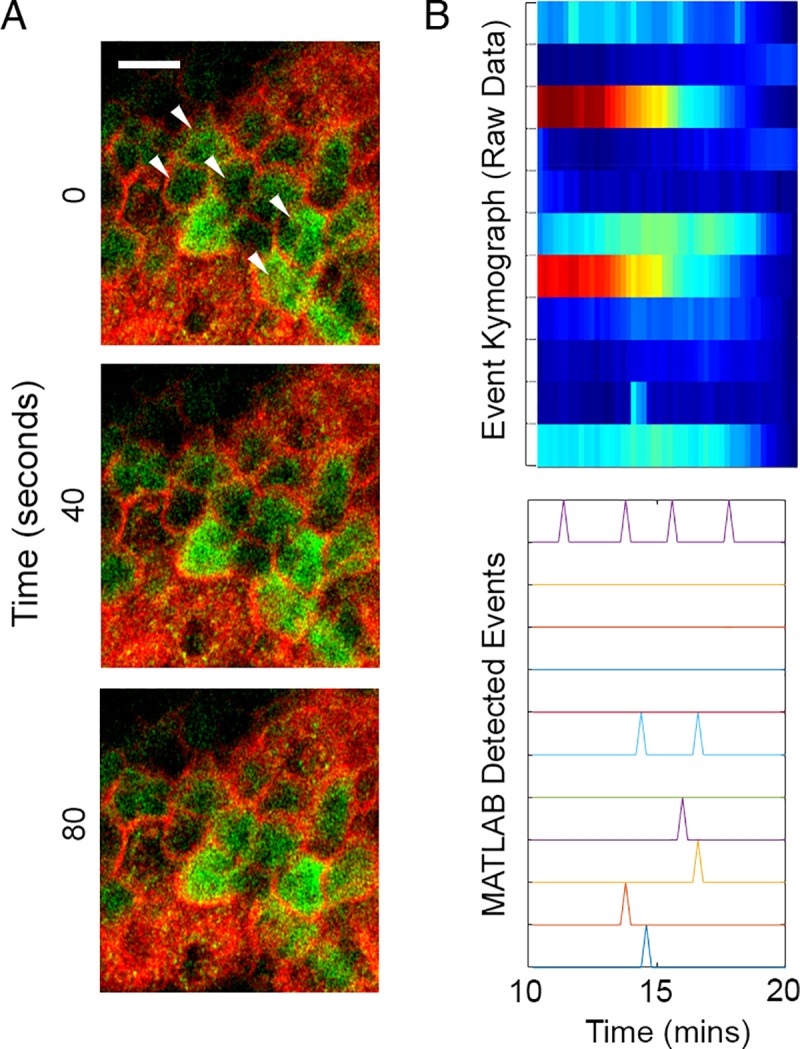
Epithelial wound healing requires the coordination of cells to migrate as a unit over the basement membrane after injury. To understand the process of this coordinated movement, it is critical to study the dynamics of cell-cell communication. We developed a method to characterize the injury-induced sustained Ca2+ mobilizations that travel between cells for periods of time up to several hours. These events of communication are concentrated along the wound edge and are reduced in cells further away from the wound. Our goal was to delineate the role and contribution of these sustained mobilizations and using MATLAB analyses, we determined the probability of cell-cell communication events in both in vitro models and ex vivo organ culture models. We demonstrated that the injury response was complex and represented the activation of a number of receptors. In addition, we found that pannexin channels mediated the cell-cell communication and motility. Furthermore, the sustained Ca2+ mobilizations are associated with changes in cell morphology and motility during wound healing. The results demonstrate that both purinoreceptors and pannexins regulate the sustained Ca2+ mobilization necessary for cell-cell communication in wound healing.


Conflict of interest statement

The authors have declared that no competing interests exist.

Figures

Fig 1
Fig 1. Communication between cells after injury is inhibited by purinergic inhibitors.
(A) Representative images of the initial Ca2+ wave and the sustained Ca2+ mobilizations upon scratch wounding (wound marked with asterisks). Based on the outlined cells closest to the wound edge (in white), kymographs of the cells closest to the wound edge were generated to observe fluorescent intensity changes over time. The brackets on the left of each horizontal row represents the activity of a single cell. Cells were preincubated in 5 μM Fluo3-AM for 30 minutes and imaged on the Zeiss Axiovert LSM 880 confocal laser scanning microscope. Scale bar = 60 μm. (n = 7). (B) Graph of the mean extracellular ATP concentration over time after injury compared to unwounded control. Error bars represent SEM (n = 3). (C) Comparison of representative fluorescence over time after treatment with ATP, ATP and apyrase, and EGF. Black arrowhead marks the time apyrase was added. Apyrase abrogated the Ca2+ response. EGF induced negligible Ca2+ mobilizations compared to that of ATP. (n = 4). (D) Injury induced response (Normalized intensity value of fluorescence) in presence or absence of inhibitors: A438079 (P2X7 competitive inhibitor) or AR-C 118925XX (P2Y2 competitive inhibitor) (n = 4).
Fig 2
Fig 2. Analysis of UTP and BzATP induced Ca2+ mobilizations.
(A) Schematic of cell-based approach of the Ca2+ analysis. Cells are identified using coordinates from the image study video and event kymographs generated. (B) Representative graphs of percent cells activated over time and cluster number versus time for BzATP and UTP agonist image studies (n = 6). (C) Representative kymographs and event charts of UTP and BzATP agonist image studies. To reduce the background noise from the high-intensity initial Ca2+ oscillations, mobilizations are analyzed 10 minutes after inducing the Ca2+ mobilizations with agonist (n = 6). (D) Schematic of event probability based on MATLAB-detected events. (E) Comparison of the average event probability values for each of the agonists and their specific inhibitors, A438079 (P2X7 competitive inhibitor), AR-C 118925XX (P2Y2 competitive inhibitor). Data are means ± SEM and were analyzed with a Tukey's multiple comparisons test (*p<0.05 for each of the indicated comparisons, n = 4).
Fig 3
Fig 3. Communication events between cells depend on distance from wound.
(A and B) Representative kymographs and detected event charts of the leading edge (LE) (A) and back from the leading edge (BFLE) (B). Analysis was performed 10 minutes after wounding. (n = 3). (C) Event probability values for LE and BFLE cells after wounding. Data are mean ± SEM and were analyzed with a two-tailed unpaired t-test (**p<0.002, n = 3). (D) Event probability values for the LE wound and BzATP agonist response. Data are mean ± SEM and were analyzed with a two-tailed unpaired t-test (ns, n = 3). (E) Event probability values for the LE when cells were preincubated in the presence or absence of A438079 or AR-C 118925XX before scratch-wounding. Data are mean ± SEM and were analyzed with a one-way ANOVA with the Tukey’s multiple comparisons test (***p<0.001, n = 4).
Fig 4
Fig 4. Ca2+ mobilizations between cells correlate with changes in cell shape.
(A) Live-cell imaging of the wound edge. Cells were incubated with CellMask membrane dye (Fire LUT) and Fluo-3AM (cyan) 10 minutes after injury to examine cell shape changes and Ca2+ mobilizations. The edge of the wound is marked with an asterisk. (B) Cell traces were made for cells that exhibited active and inactive Ca2+ mobilization. When Ca2+ mobilizations are present between cells (Active), changes in cell shape are detected. When Ca2+ mobilizations are absent (Inactive), there is no detectable change in cell morphology. Scale bar = 34 μm. (n = 3 for both A and B).
Fig 5
Fig 5. Connexin-43 (Cx43) channels do not mediate the mean event probability.
(A) Localization of Cx43 (white in the Cx43 only image, yellow in the composite image). Cells were counter-stained with rhodamine phalloidin (red) and DAPI (blue). Higher cell density and confluence correlated with extend of localization of connexin along the cell membrane. Scale bar = 42 μm. (n = 4). (B) Representative graphs of percent cells activated over time and cluster number versus time for Ca2+ mobilization determined from videos of cells preincubated with 120 μM α-GA and control. (n = 4). (C) Event probability values for the control and α-GA treated group. Data are mean ± SEM and were analyzed with a two-tailed unpaired t-test (ns, n = 3).
Fig 6
Fig 6. Pannexin1 facilitates the propagation of Ca2+ mobilizations when purinergic receptors are activated.
(A) Representative graphs of percent cells activated over time and cluster number when cells were preincubated with 100 μM 10Panx inhibitory peptide or scrambled peptide control prior to stimulation. (n = 4). (B) Event probability values of cells preincubated with either 10Panx or Scrambled Panx control group and activated with either BzATP or UTP. Data are mean ± SEM and were analyzed with a two-tailed unpaired t-test. 10Panx significantly lowered cell-cell communication if cells were stimulated with BzATP (**p<0.009), while communication was unaffected when stimulated with UTP (ns, n = 4).
Fig 7
Fig 7. Pannexin1 localization is detected at wound edge during healing.
(A) Representative confocal immunofluorescence images of cultured cells stained for pannexin1 localization (yellow, including arrowheads) and counterstained with rhodamine phalloidin (red). Pannexin1 is concentrated adjacent to the leading edge of the wound. Scale bar = 23 μm. (n = 3). (B) Representative confocal immunofluorescence images of basal corneal epithelium stained for pannexin1 (yellow, including arrows) and counterstained for rhodamine phalloidin (red). After wounding (2 and 4 hours), the pannexin1 concentrated towards the leading edge of the wound. An asterisk indicates the leading edge of migrating epithelium. Scale bar = 18.5 μm. (n = 3). (C) Ca2+ mobilizations are represented over time in event charts of LE and BFLE cells 10 minutes after wounding, with cells preincubated with inhibitory peptide 10Panx or scrambled peptide control (Ctrl) (n = 3). (D) Event probability values for LE cells after wounding for both treated and Ctrl groups. Data are mean ± SEM and were analyzed with a one-way ANOVA with the Tukey’s multiple comparisons test (**p<0.01, n = 3).
Fig 8
Fig 8. Inhibition of pannexin channels affect cell migration and wound healing.
(A) Live-cell imaging of the wound edge of cells preincubated with SiR-Actin Spirochrome (in grayscale) to determine cell migration over a 16 hour period. Scale bar = 66 μm. Traces of the wound area and 8 random cells in the field were drawn over time to observe the rate of cell migration and wound closure for the experimental and control conditions. Colors reflect time and are indicated by time wedge (n = 3). (B) Representative percent wound closure graph of cells preincubated with 10Panx or Panx scrambled peptide control over time (n = 3). (C) Representative cell migration trajectory diagrams of LE and BFLE cells preincubated in either 10Panx or Panx scrambled peptide control. Each line represents the migration path of a single cell plotted from a common origin. Scale bar = 20 μm.
Fig 9
Fig 9. Ca2+ mobilizations are present in ex vivo organ cultures after stimulation with ATP.
(A) Representative images of Ca2+ mobilizations in mouse corneal epithelium (white arrowheads) Similar to in vitro experiments, images were not recorded until 10 minutes after addition of agonist. Scale bar = 15 μm. (n = 2). (B) Representative kymograph of Ca2+ mobilizations and graph representing detected events after stimulation.

References

    1. Barrios J, Patel KR, Aven L, Achey R, Minns MS, Lee Y, et al. Early life allergen-induced mucus overproduction requires augmented neural stimulation of pulmonary neuroendocrine cell secretion. The FASEB Journal. 2017. May 31;31(9):4117–28. 10.1096/fj.201700115R - DOI - PMC - PubMed
    1. Klepeis VE, Cornell-Bell A, Trinkaus-Randall V. Growth factors but not gap junctions play a role in injury-induced Ca2+ waves in epithelial cells. Journal of Cell Science. 2001. December 1;114(23):4185–95. - PubMed
    1. Lu W, Hu H, Sévigny J, Gabelt BT, Kaufman PL, Johnson EC, et al. Rat, mouse, and primate models of chronic glaucoma show sustained elevation of extracellular atp and altered purinergic signaling in the posterior eye. Invest Ophthalmol Vis Sci. 2015. May 1;56(5):3075–83. 10.1167/iovs.14-15891 - DOI - PMC - PubMed
    1. Adinolfi E. New intriguing roles of ATP and its receptors in promoting tumor metastasis. Purinergic Signalling. 2013. December 1;9(4):487–90. 10.1007/s11302-013-9401-4 - DOI - PMC - PubMed
    1. Boucher I, Yang L, Mayo C, Klepeis V, Trinkaus-Randall V. Injury and nucleotides induce phosphorylation of epidermal growth factor receptor: MMP and HB-EGF dependent pathway. Experimental Eye Research. 2007. July 1;85(1):130–41. 10.1016/j.exer.2007.03.009 - DOI - PMC - PubMed

Publication types