. 2019 Apr 24;14(4):e0214474.
doi: 10.1371/journal.pone.0214474. eCollection 2019.

Mapping Europe into local climate zones

Affiliations

Mapping Europe into local climate zones

Matthias Demuzere et al. PLoS One. .

Abstract

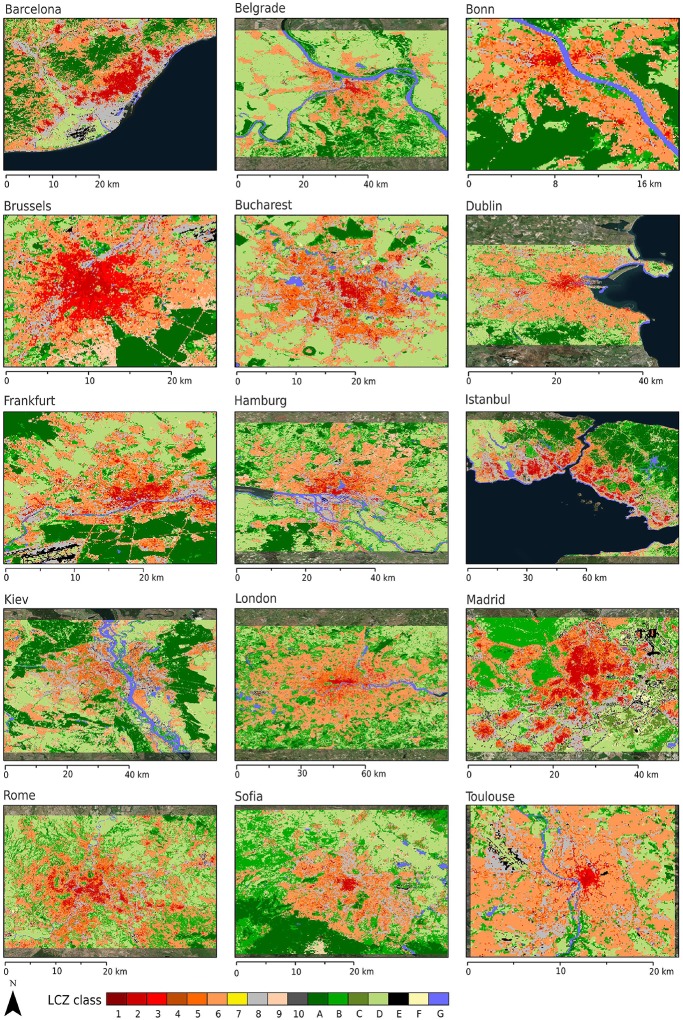
Cities are major drivers of environmental change at all scales and are especially at risk from the ensuing effects, which include poor air quality, flooding and heat waves. Typically, these issues are studied on a city-by-city basis owing to the spatial complexity of built landscapes, local topography and emission patterns. However, to ensure knowledge sharing and to integrate local-scale processes with regional and global scale modelling initiatives, there is a pressing need for a world-wide database on cities that is suited for environmental studies. In this paper we present a European database that has a particular focus on characterising urbanised landscapes. It has been derived using tools and techniques developed as part of the World Urban Database and Access Portal Tools (WUDAPT) project, which has the goal of acquiring and disseminating climate-relevant information on cities worldwide. The European map is the first major step toward creating a global database on cities that can be integrated with existing topographic and natural land-cover databases to support modelling initiatives.


Conflict of interest statement

The authors have declared that no competing interests exist.

Figures

Fig 1
Fig 1. Abridged definitions for local climate zones [18].
©American Meteorological Society. Used with permission.
Fig 2
Fig 2. European training areas.
Colours depict the number of training areas per LCZ class and city. Values between brackets are the total number of training areas per city.
Fig 3
Fig 3. Illustration of training areas: Toulouse (France, left panel), Birmingham (United Kingdom, middle panel), and Athens (Greece, right panel).
Colours denote the LCZ classes. Sources background map: Esri, DigitalGlobe, Earthstar Geographics, CNES/Airbus DS, GeoEye, USDA FSA, USGS, Aerogrid, IGN, IGP, and the GIS User Community.
Fig 4
Fig 4. Input feature importance ranking.
The vertical dashed line separates the top-10 features. The error bars are derived from the bootstrapping procedure. Note that the spectral indices are also derived from Landsat 8; they are given a different color for clarity.
Fig 5
Fig 5. Feature importance ranking per LCZ class.
Left panel: Built LCZs, right panel: Natural LCZs. Thick lines and shadings respectively present the importance mean and standard deviation from the bootstrapping.
Fig 6
Fig 6. Classification accuracy assessment.
Results are based on All pixels and all input features (left panel), All pixels and the top 10 input features (middle panel), and the reduced pixels and all input features (right panel).
Fig 7
Fig 7. European local climate zone map.
A selection of cities are depicted in more details in the Figures below.
Fig 8
Fig 8. Binary urban maps extracted from ESA CCI and LCZ.
Black refers to urban, white to non-urban. For the LCZs, classes 1-10 with the exception of 9 (Sparsely built) are considered urban. Sources background maps: Esri, DigitalGlobe, Earthstar Geographics, CNES/Airbus DS, GeoEye, USDA FSA, USGS, Aerogrid, IGN, IGP, and the GIS User Community.
Fig 9
Fig 9. Accuracy assessment urban land cover for all European countries.
Abbreviations refer to Large Scale International Boundary (LSIB) country codes: AL: Albania, AN: Andorra, AU: Austria, BE: Belgium, BK: Bosnia & Herzegovina, BO: Belarus, BU: Bulgaria, CY: Cyprus, DA: Denmark, EI: Ireland, EN: Estonia, EZ: Czech Republic, FI: Finland, FR: France, GM: Germany, GR: Greece, HR: Croatia, HU: Hungary, IC: Iceland, IT: Italy, KV: Kosovo, LG: Latvia, LH: Lithuania, LO: Slovakia, LS: Liechtenstein, LU: Luxembourg, MD: Moldova, MJ: Montenegro, MK: Macedonia, MN: Monaco, MT: Malta, NL: The Netherlands, NO: Norway, PL: Poland, PO: Portugal, RI: Serbia, RO: Romania, SI: Slovenia, SM: San Marino, SP: Spain, SW: Sweden, SZ: Switzerland, TU: Turkey, UK: United Kingdom, UP: Ukraine, VT: Vatican City.
Fig 10
Fig 10. LCZ map (left panel) and EU Urban Atlas building height (right panel) for Budapest (Hungary).
Fig 11
Fig 11. LCZ map, impervious density (IMD, %) and mean annual anthropogenic heat flux (AHF, W/m2) for Germany.
Fig 12
Fig 12. Sky view factors for 15 European cities.
Sources background map: Esri, DigitalGlobe, Earthstar Geographics, CNES/Airbus DS, GeoEye, USDA FSA, USGS, Aerogrid, IGN, IGP, and the GIS User Community.
Fig 13
Fig 13. Local climate zones for 15 European cities.
Sources background map: Esri, DigitalGlobe, Earthstar Geographics, CNES/Airbus DS, GeoEye, USDA FSA, USGS, Aerogrid, IGN, IGP, and the GIS User Community.

References

    1. Grimm NB, Faeth SH, Golubiewski NE, Redman CL, Wu J, Bai X, et al. Global Change and the Ecology of Cities. Science (New York, NY). 2008;319(5864):756–760. 10.1126/science.1150195 - DOI - PubMed
    1. Baklanov A, Grimmond CSB, Carlson D, Terblanche D, Tang X, Bouchet V, et al. From urban meteorology, climate and environment research to integrated city services. Urban Climate. 2017;.
    1. Schär C, Vidale PL, Lüthi D, Frei C, Häberli C, Liniger MA, et al. The role of increasing temperature variability in European summer heatwaves. Nature. 2004;427(January):332–336. 10.1038/nature02300 - DOI - PubMed
    1. Miralles DG, Teuling AJ, Heerwaarden CCV. Mega-heatwave temperatures due to combined soil desiccation and atmospheric heat accumulation. Nature Geoscience. 2014;7(5):345–349. 10.1038/ngeo2141 - DOI
    1. Robine JM, Cheung SLK, Le Roy S, Van Oyen H, Griffiths C, Michel JP, et al. Death toll exceeded 70,000 in Europe during the summer of 2003. Comptes Rendus—Biologies. 2008;331(2):171–178. 10.1016/j.crvi.2007.12.001 - DOI - PubMed

Publication types