. 2019 Apr 23;27(4):1293-1306.e6.
doi: 10.1016/j.celrep.2019.03.099.

The Major Risk Factors for Alzheimer's Disease: Age, Sex, and Genes Modulate the Microglia Response to Aβ Plaques

Affiliations

The Major Risk Factors for Alzheimer's Disease: Age, Sex, and Genes Modulate the Microglia Response to Aβ Plaques

Carlo Sala Frigerio et al. Cell Rep. .

Abstract

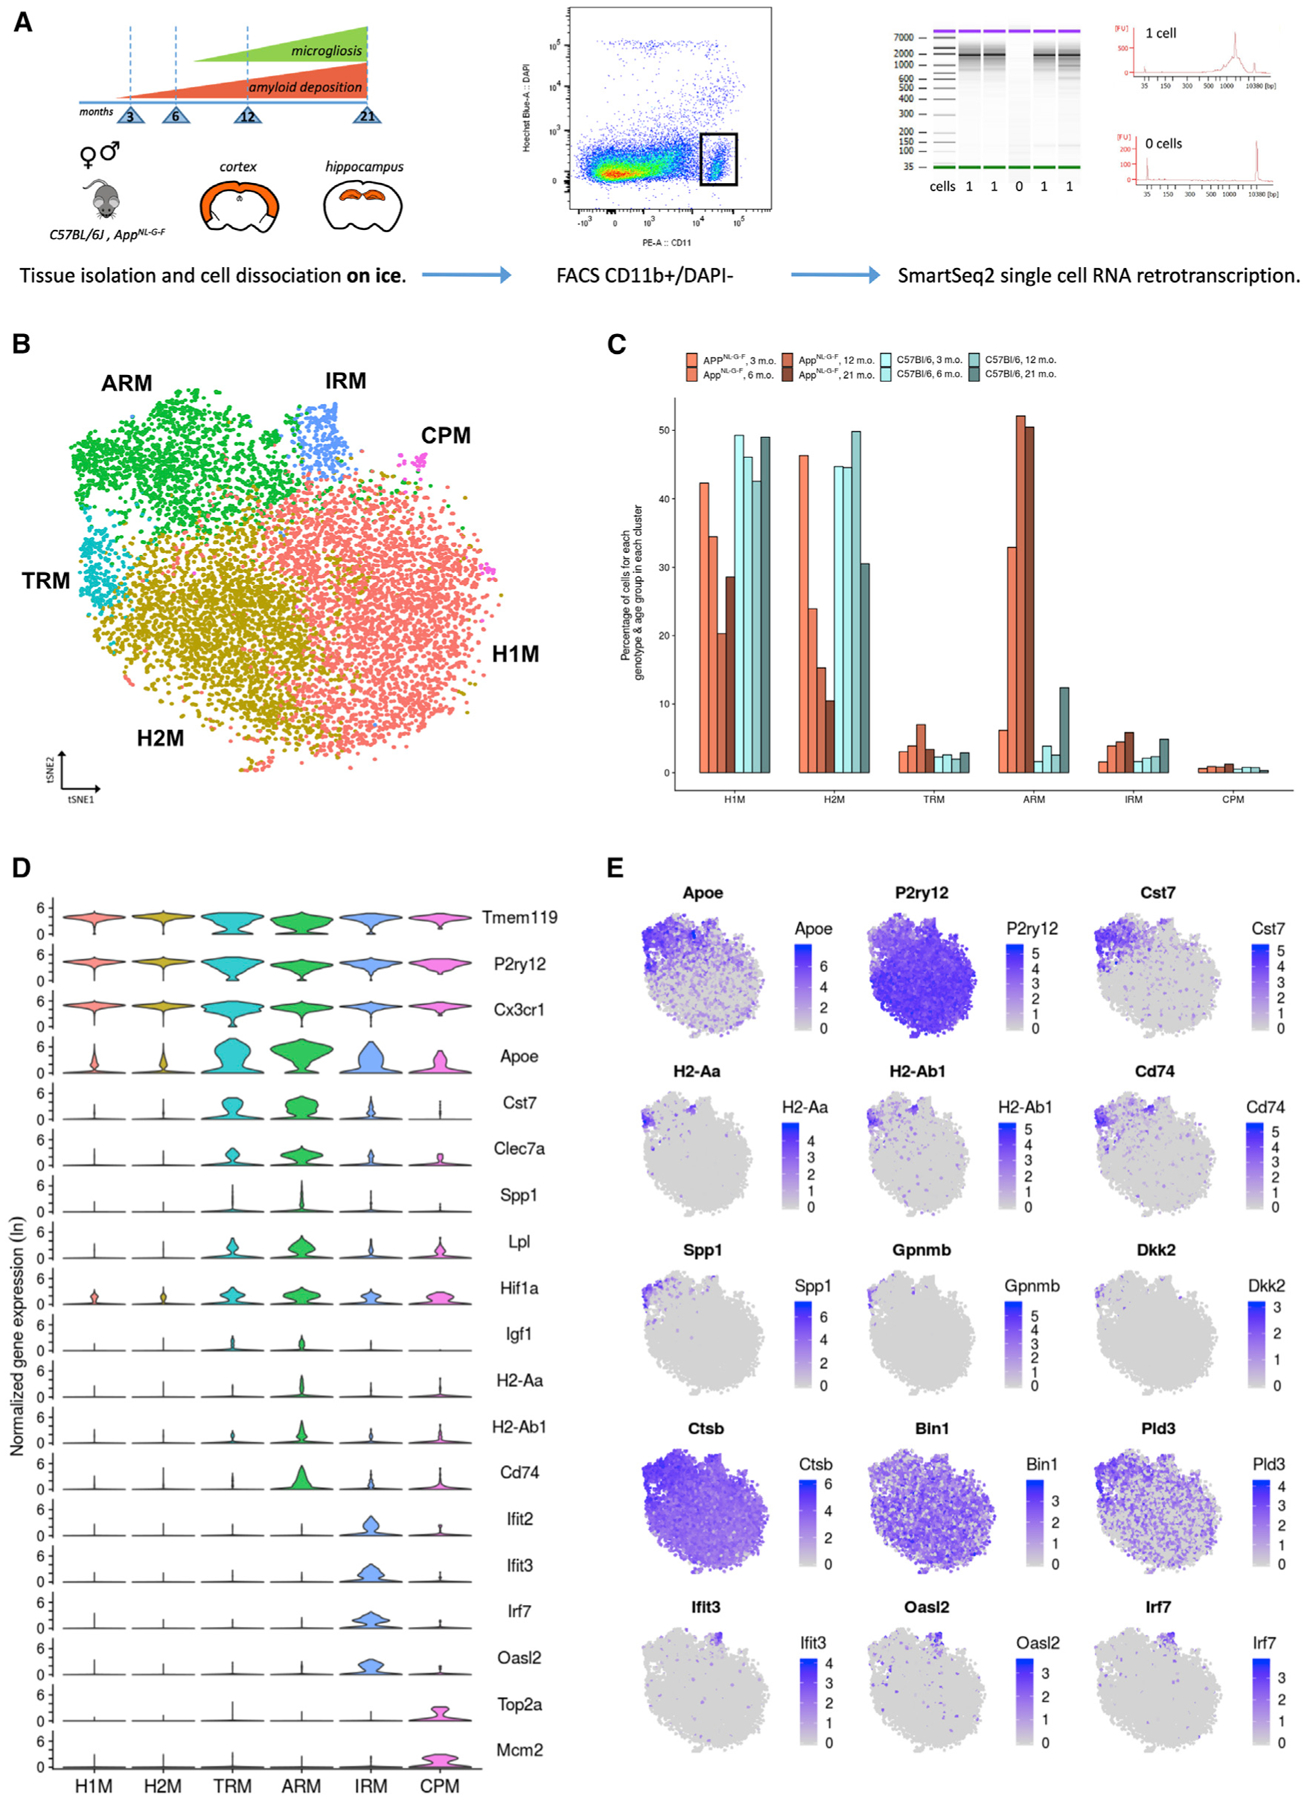
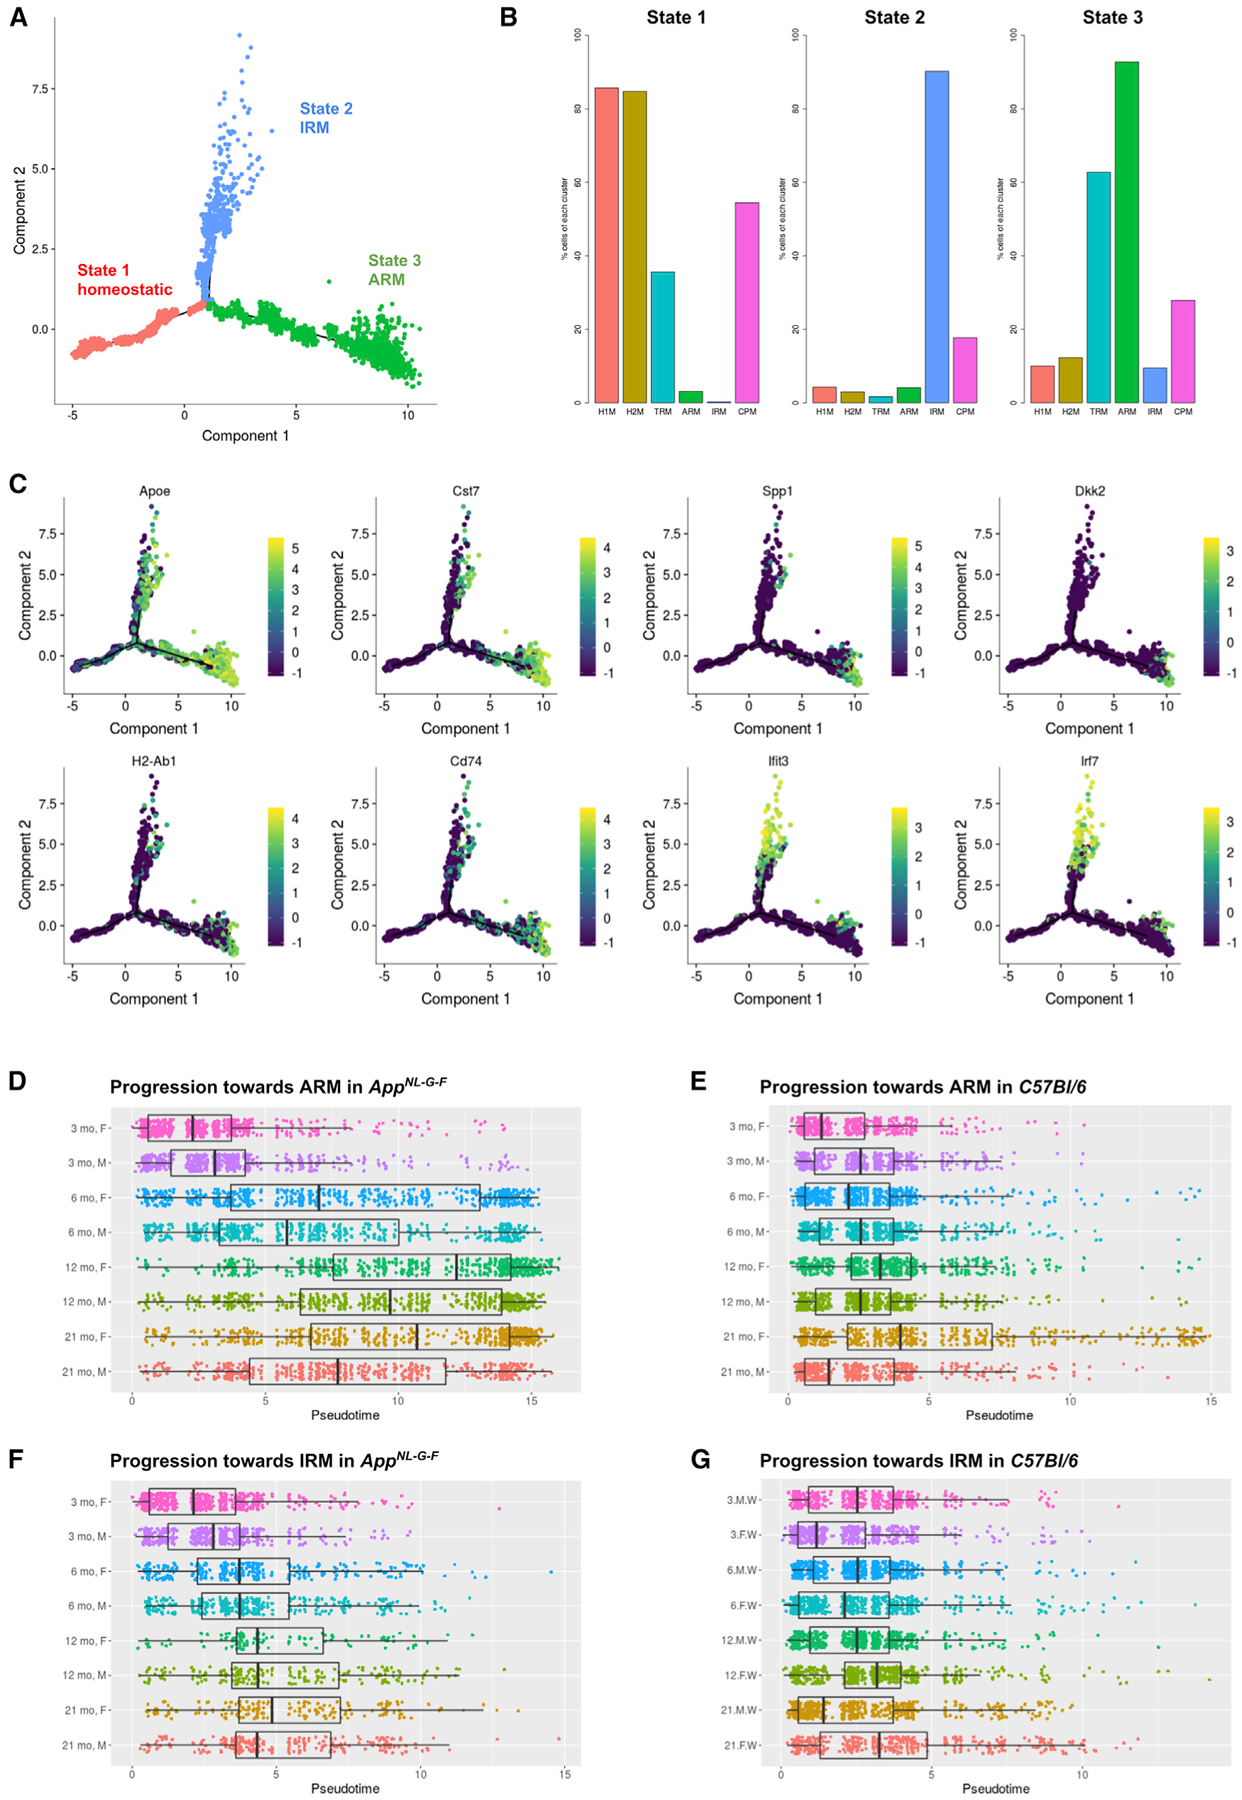
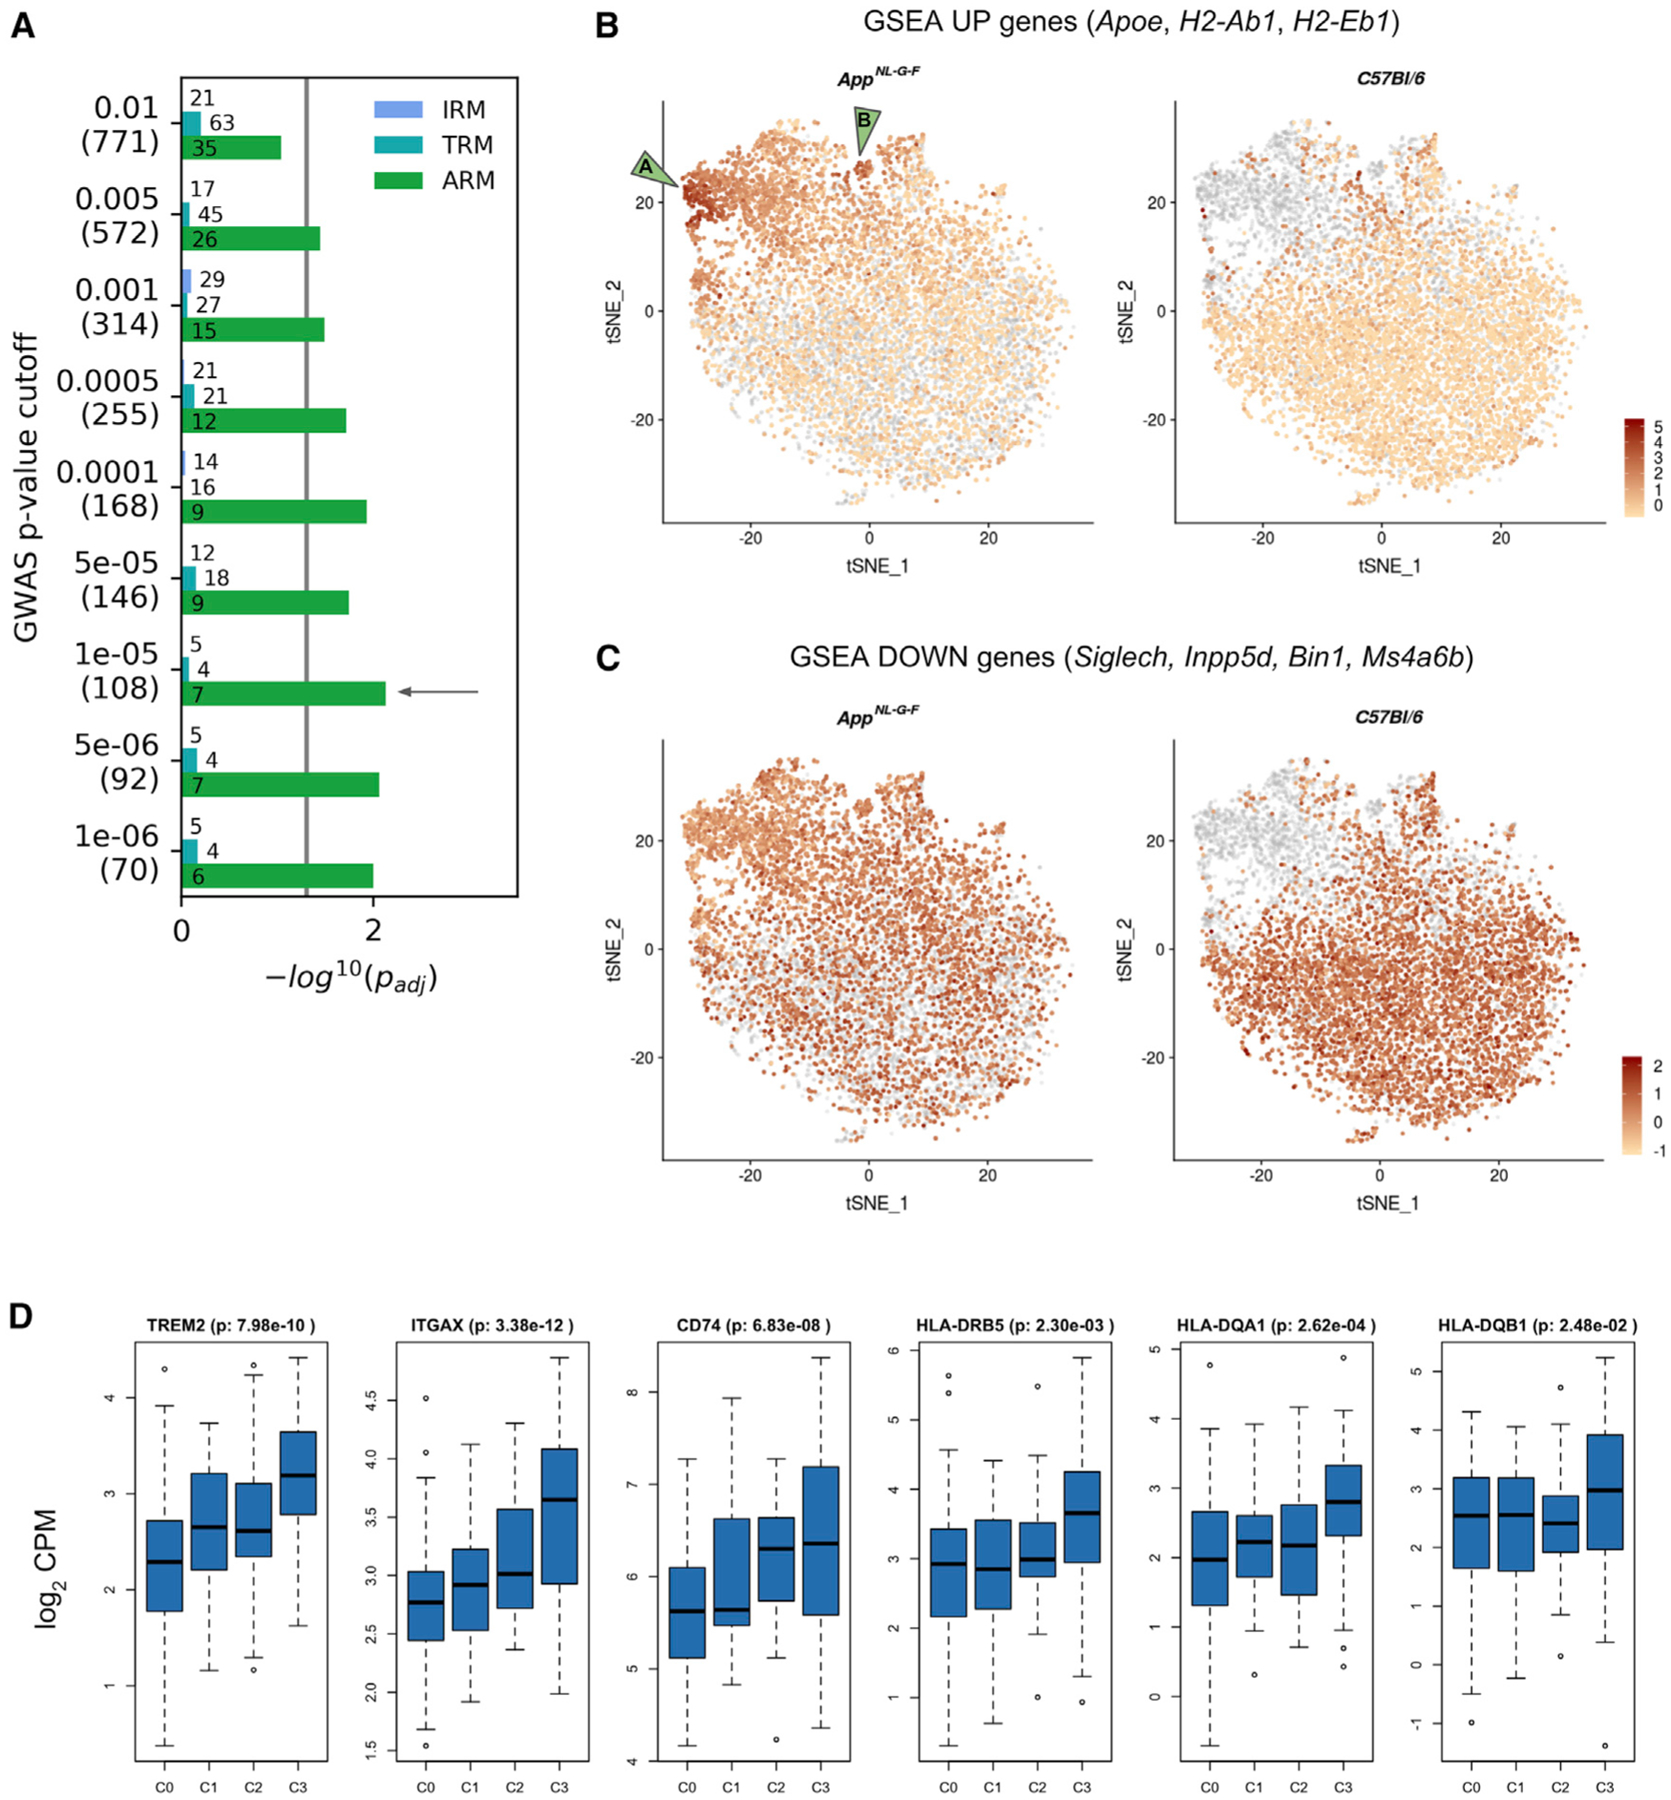
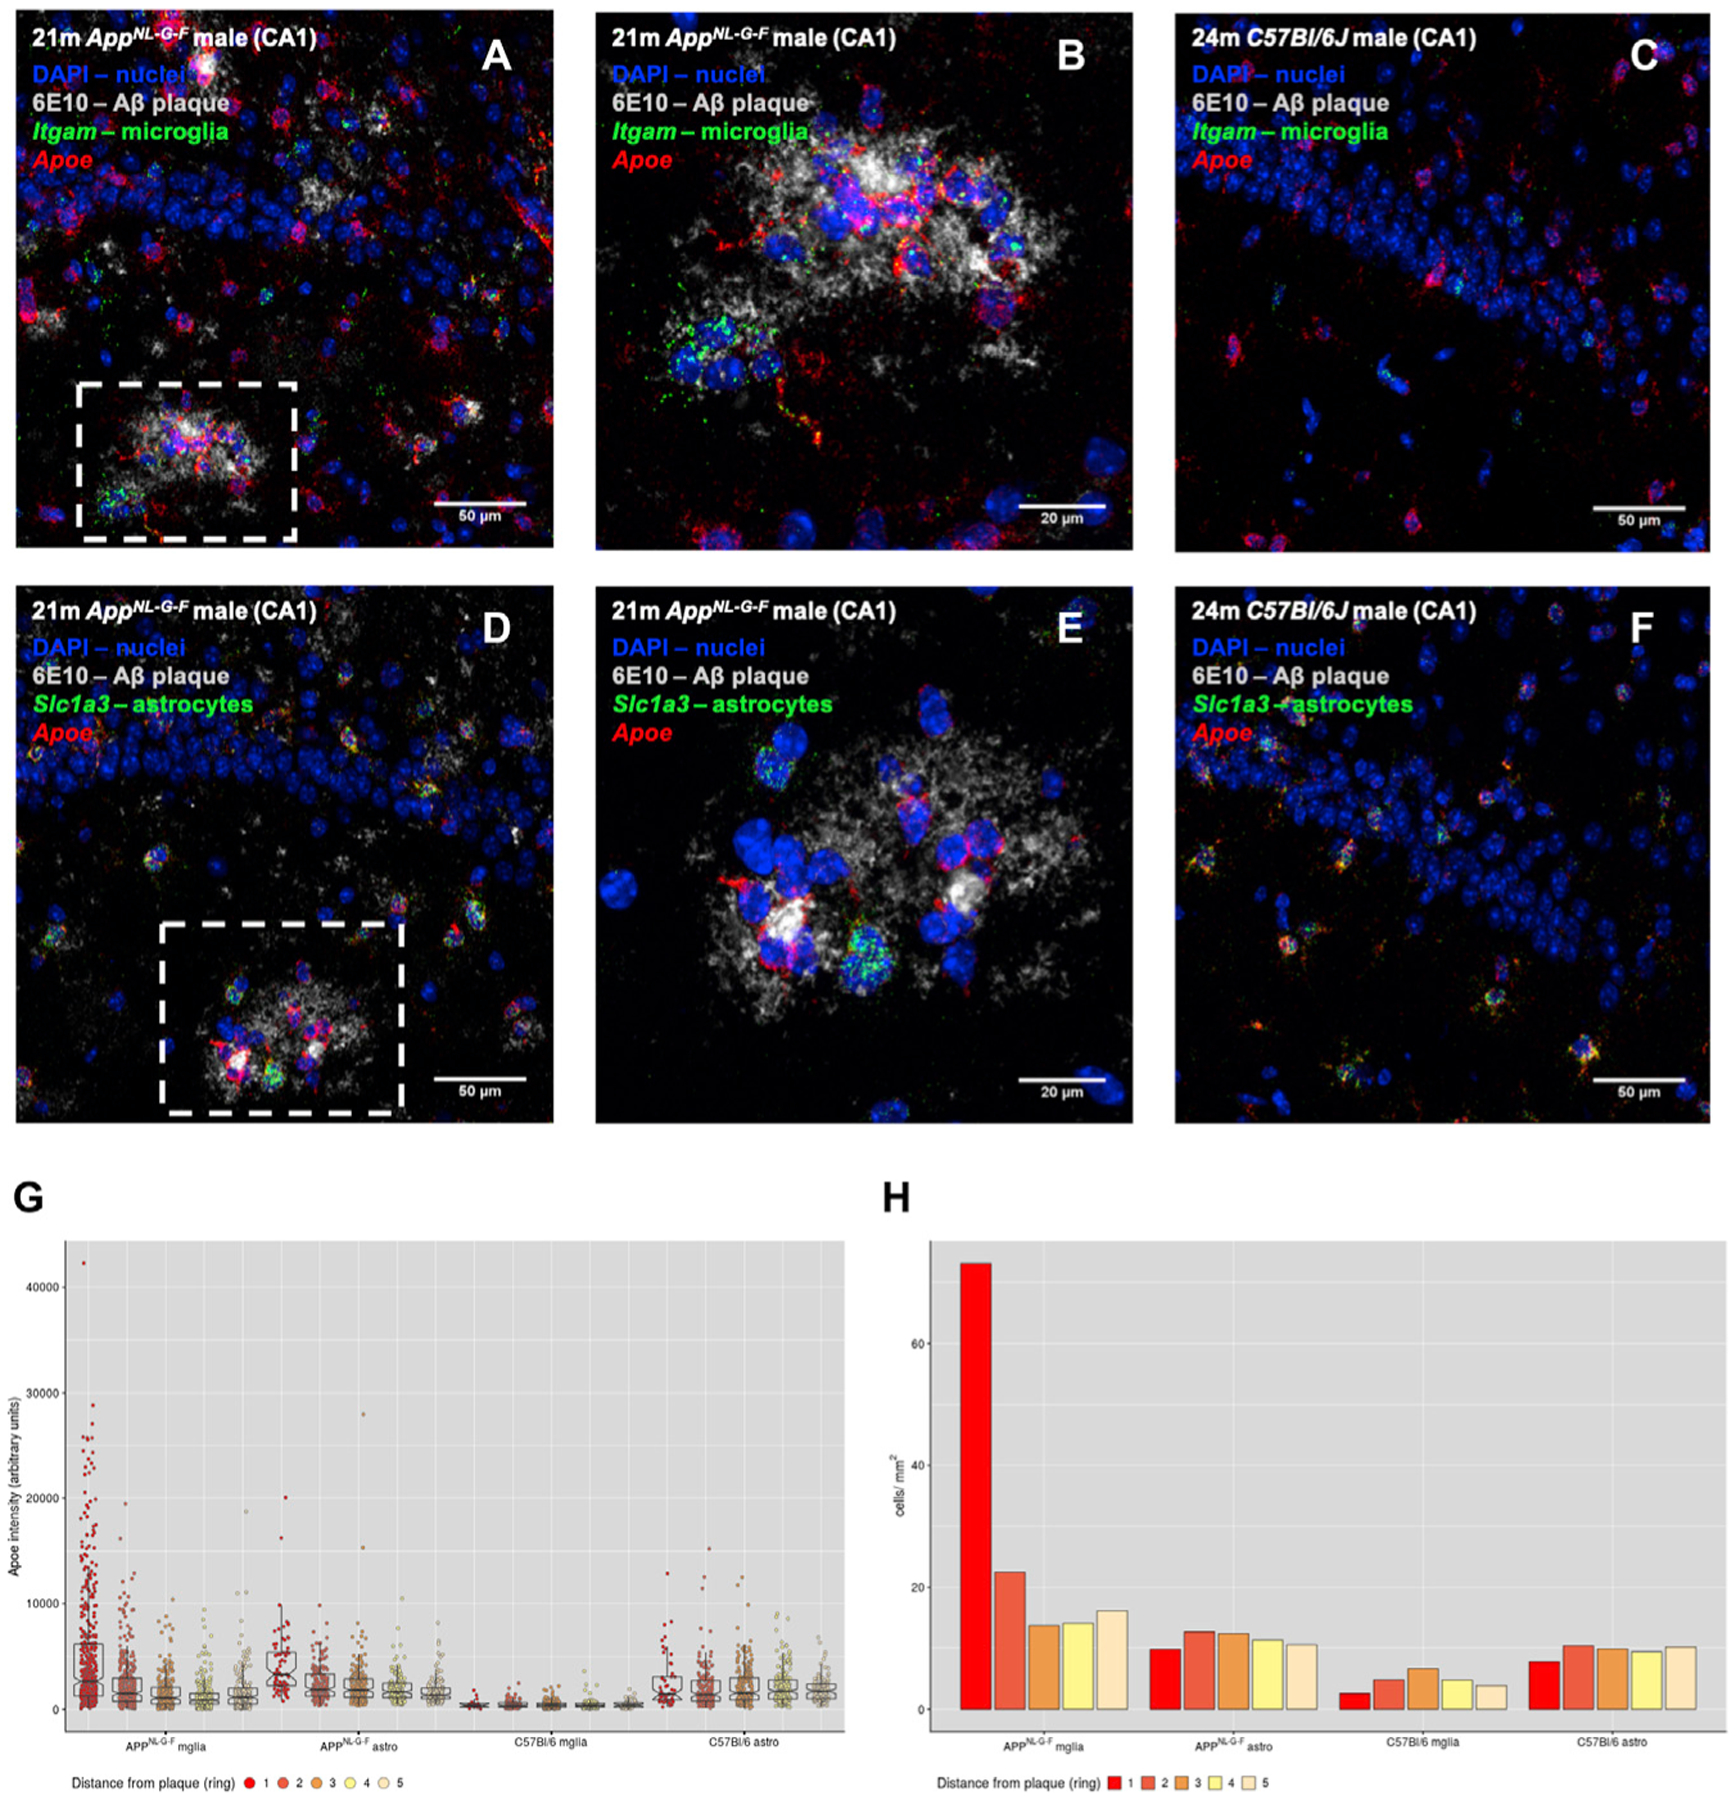
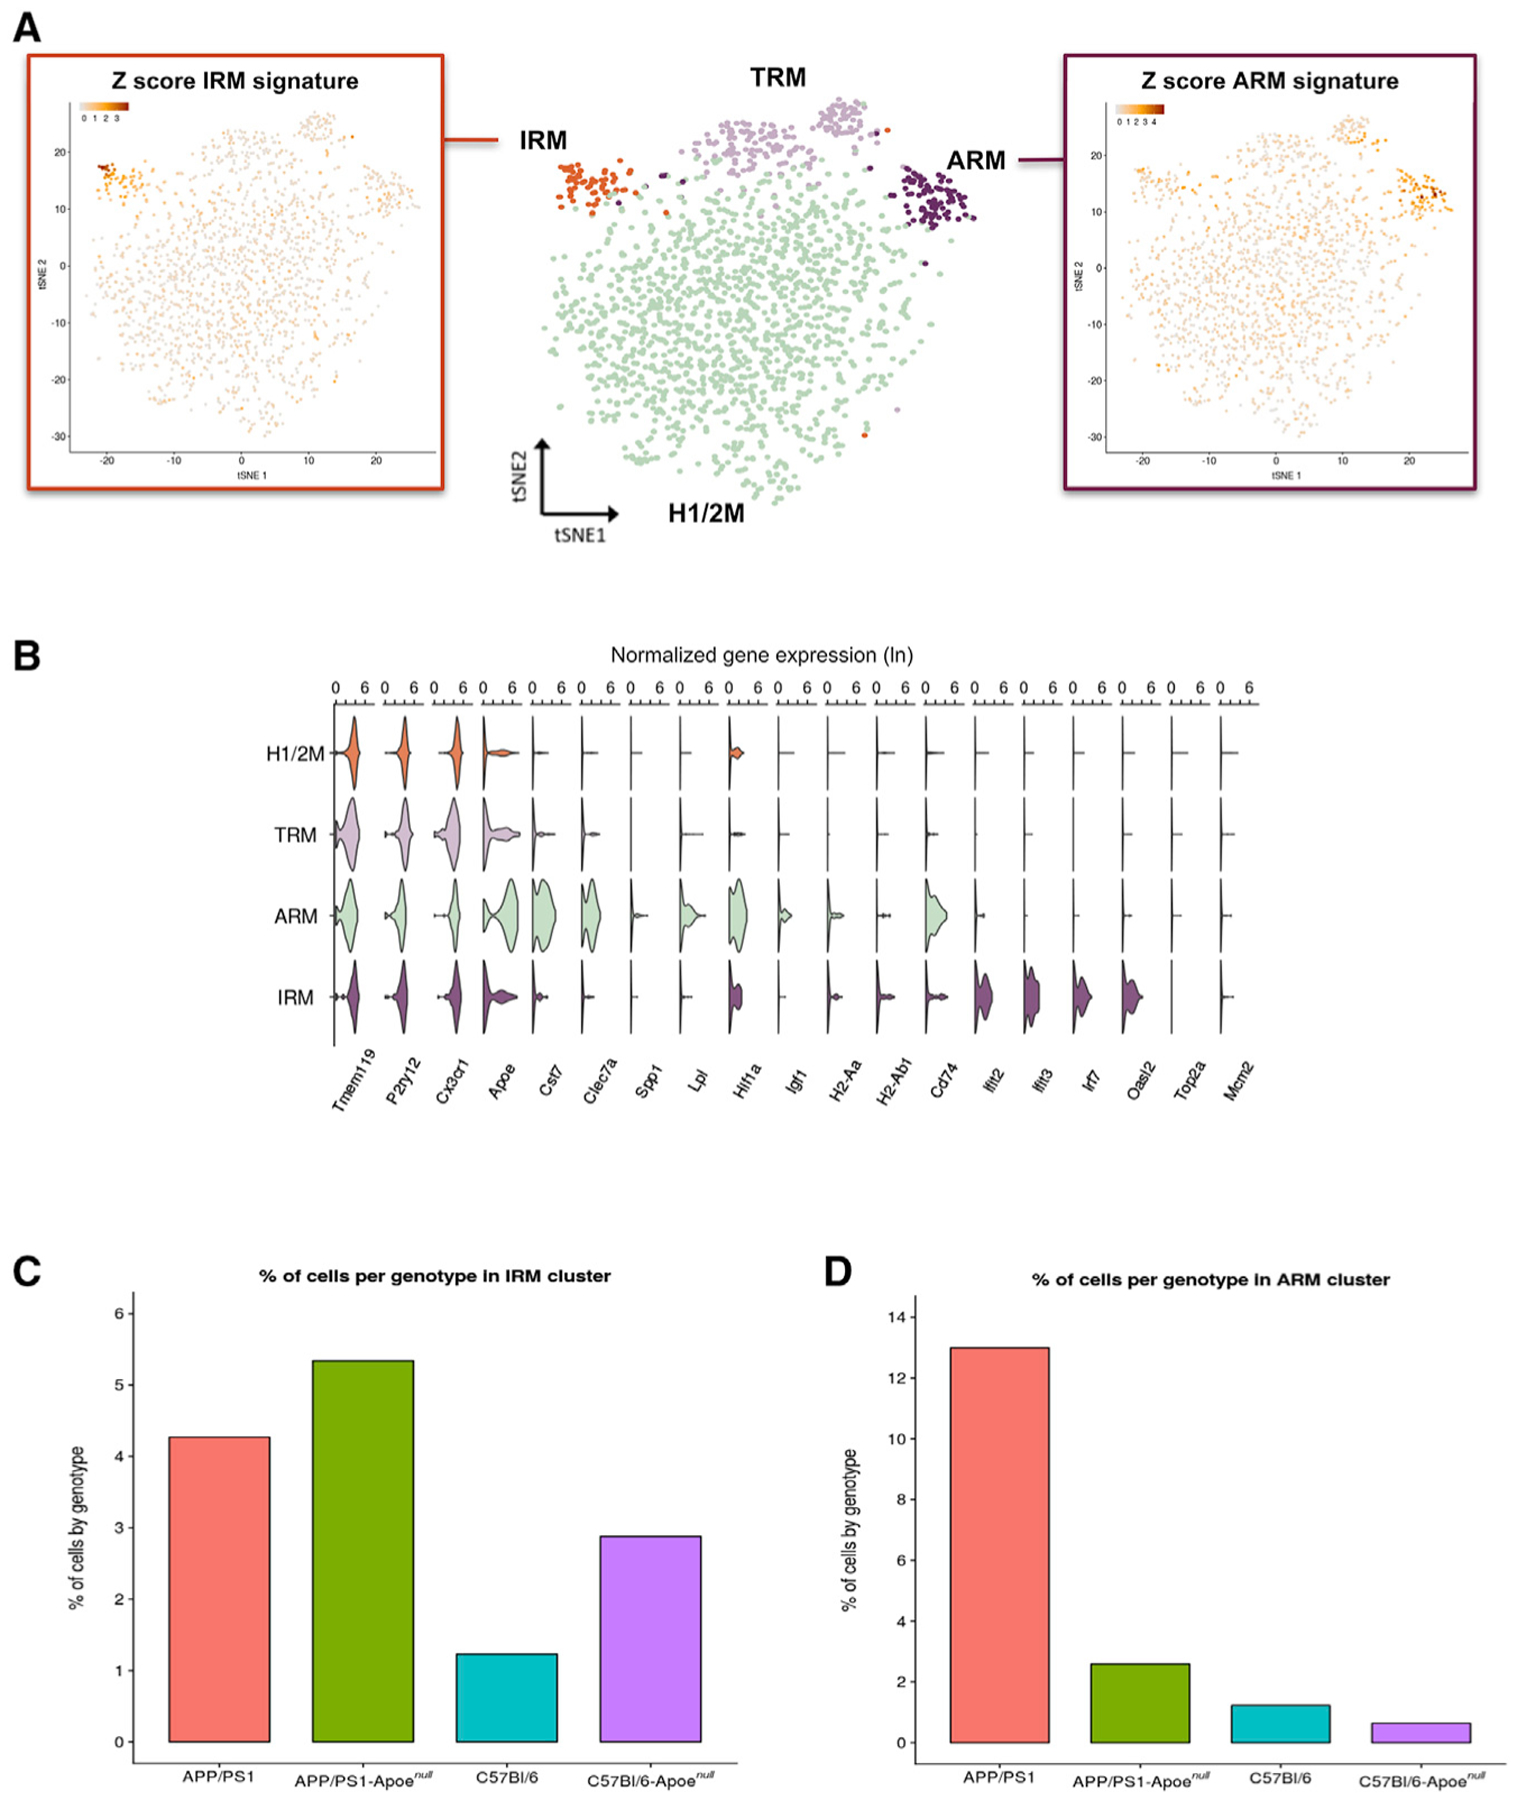
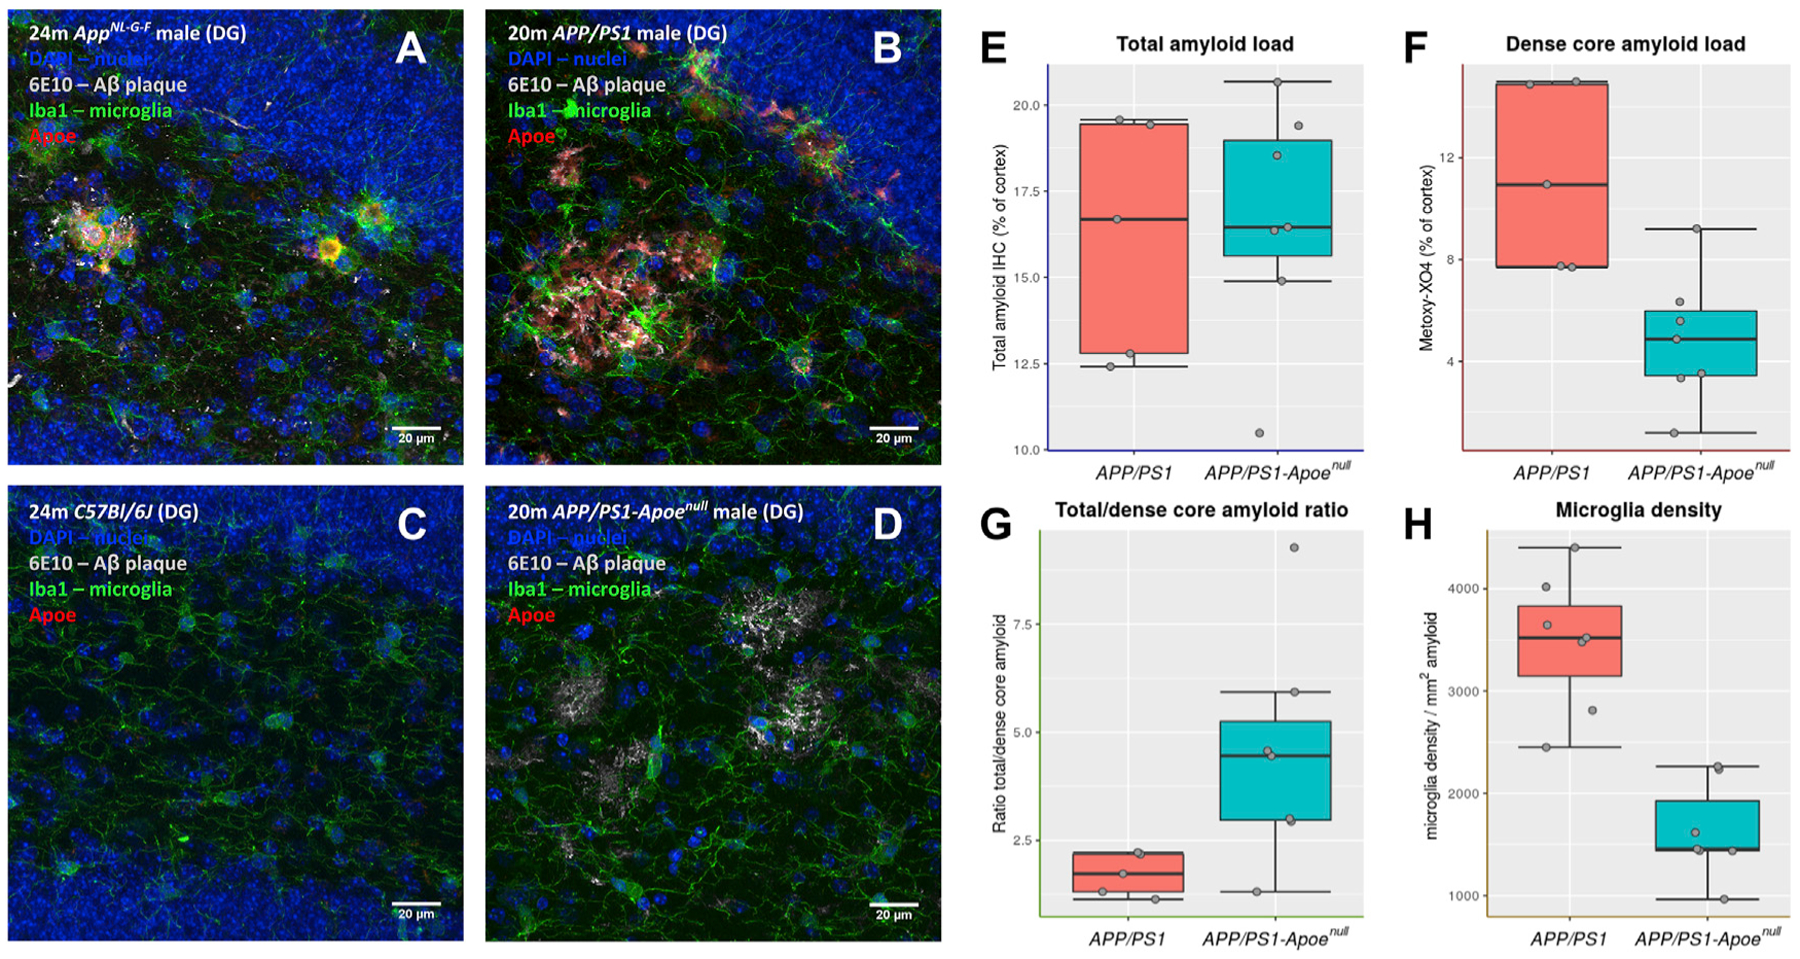
Gene expression profiles of more than 10,000 individual microglial cells isolated from cortex and hippocampus of male and female AppNL-G-F mice over time demonstrate that progressive amyloid-β accumulation accelerates two main activated microglia states that are also present during normal aging. Activated response microglia (ARMs) are composed of specialized subgroups overexpressing MHC type II and putative tissue repair genes (Dkk2, Gpnmb, and Spp1) and are strongly enriched with Alzheimer's disease (AD) risk genes. Microglia from female mice progress faster in this activation trajectory. Similar activated states are also found in a second AD model and in human brain. Apoe, the major genetic risk factor for AD, regulates the ARMs but not the interferon response microglia (IRMs). Thus, the ARMs response is the converging point for aging, sex, and genetic AD risk factors.

Keywords: ARM; Alzheimer; IRM; apoe; app knock in; in situ RNA hybridization; microglia; single cell RNA-seq; single cell sequencing.


Conflict of interest statement

DECLARATION OF INTERESTS

M.E.W., G.S., T.M., and E.K. are employed by AbbVie, Inc. AbbVie, Inc., has subsidized part of the study. B.D.S. is a consultant for several companies. All the other authors declare no competing interests.

Figures

Figure 1.
Figure 1.. Microglia Mount a Heterogeneous Response to β-amyloid, Marked by Apoe Overexpression
(A) Dataset presentation. We used male and female AppNL-G-F and wild-type C57BL/6J mice from four time points over the course of amyloid pathology and microgliosis as indicated. We dissected separately cortex and hippocampal tissues. The tissue from two animals for each experimental condition (age, sex, tissue, genotype) was pooled before microglia isolation. All procedures were performed on ice. Single live microglial cells were isolated by FACS (CD11b+, DAPI), and single-cell RNA-sequencing (RNA-seq) libraries were prepared according to the SmartSeq2 and Nextera methods. (B) t-distributed stochastic neighbor embedding (t-SNE) plot visualizing the 10,801 single microglial cells passing quality control after removal of peripheral cells. Cells are colored according to clusters identified with Seurat’s k-nearest neighbors (kNN) approach (H1M and H2M, homeostatic microglia; TRM, transiting response microglia; ARM, activated response microglia; IRM, interferon response microglia; CPM, cycling and proliferating microglia). (C) Percentage of cells from each genotype-age group for each cluster identified. AppNL-G-F cells are indicated in shades of red, while wild-type cells are indicated in shades of blue. (D) Violin plots of selected marker genes for each identified cluster. The y axis indicates normalized gene expression (ln scale). (E) t-SNE plots as in (B), colored by the level of ln normalized expression of selected genes. Clusters of TRMs and ARMs display increased expression of Apoe and inflammation markers (Cst7) and concurrently display a reduction of homeostatic markers (P2ry12). Two distinct regions of the ARMs cluster display increased expression of MHC class II genes (H2-Aa, H2-Ab1, and Cd74), suggesting the existence of microglial subpopulations. Further, a small subset of the ARMs cluster displays an enrichment for tissue repair genes (Spp1, Gpnmb, and Dkk2). The ARMs cluster also displays differential expression of several AD-related genes (e.g., Ctsb, Bin1, and Pld3) compared to clusters of H1Ms and H2Ms. The cluster of IRMs is enriched for interferon genes (Ifit3, Oasl2, and Irf7). See also Figure S5.
Figure 2.
Figure 2.. Microglia Diversify into Two Cell State Branches during Response to β-amyloid Plaques
(A) Plot of cell trajectories for all microglial cells, obtained by a semi-supervised pseudotime ordering with Monocle 2. Microglia are grouped into three stages (red: stage 1; blue: stage 2; green: stage 3). Homeostatic microglia (red) progress toward two separate fates: either the multifunctional ARMs response (green) or the IRMs response (blue). (B) Percentage of cells from each cluster (Figure 1B) per state. The majority (>80%) of homeostatic microglia (clusters of H1Ms and H2Ms) are in state 1, the majority of interferon response cells (cluster of IRMs) are in state 2, and the majority of the activated response cells (cluster of ARMs) are in state 3. (C) Expression levels of selected marker genes are plotted over a plot of cell trajectories, as in (A). (D) Pseudotime progression plot of homeostatic AppNL-G-F microglial cells to the ARMs branches, presented separately for each age-gender experimental condition. Box represents the interquantile range, and the thick bar represents the group median. (E) Pseudotime progression plot from homeostatic to ARMs for each wild-type microglial cell. (F) Pseudotime progression plot from homeostatic to IRMs response for each AppNL-G-F microglial cell. (G) Pseudotime progression plot from homeostatic to IRMs response for each wild-type microglial cell.
Figure 3.
Figure 3.. Enrichment Analysis of AD Genes Highlights Substructures of ARMs
(A) Bar plot showing the significance (−log10 p value adjusted for false discovery rate; padj) of enrichment of AD GWAS genes among the genes differentially expressed in each of the three reactive microglial clusters (IRMs, TRMs, and ARMs) compared to the homeostatic microglia (H1Ms + H2Ms), calculated using GSEA. A significant enrichment indicates that more AD GWAS genes than expected are found among genes most strongly affected in the differential expression analysis for each comparison. We tested a number of different AD GWAS sets using different p value cutoffs: the numbers in the parentheses indicate the number of genes for that specific cutoff. The numbers in the bars indicate the size of the GSEA-predicted leading edge (core enrichment genes), which can be interpreted as the genes responsible for the observed enrichment. The enrichment for the p < 1e−5 cutoff yielded the lowest padj. (B and C) Of the 7 core enrichment genes for the p < 1e−5 cutoff, 3 (Apoe, H2-Ab1, and H2-Eb1) were upregulated in ARMs compared to homeostatic microglia, while 4 genes (Siglech, Inpp5d, Bin1, and Ms4a6b) were downregulated. For each set of up- and downregulated core enrichment genes, we calculated a signature score (i.e., a composite expression score of a set of genes) using Seurat’s AddModuleScore function. Each cell’s score for either the upregulated (B) or downregulated (C) gene set is visualized on a t-SNE plot (as in Figure 1B). In both cases, cells of the two genotypes are plotted separately, as indicated in the titles, with cells of the other genotype plotted in gray. In (B), the AppNL-G-F cells clearly display a strong signature score for AD GWAS genes showing in the ARMs cluster. The two green arrowheads on the left in (B) indicate two areas with particularly strong expression of these genes. (D) Boxplots of gene expression across CERAD stages in the parahippocampal brain region from the MSBB cohort. The adjusted p values of CERAD score C3 (Alzheimer’s disease) versus C0 comparisons are displayed next to the gene names. Similar results were found in the ROSMAP dataset (data not shown).
Figure 4.
Figure 4.. Microglia Are the Major Contribu tors of Apoe Expression in the Vicinity of β-amyloid Plaques
(A–F) Combined RNAscope and immunofluorescent analyses of Apoe expression by microglia and astrocytes in the vicinity of β-amyloid plaques. Expressions of Apoe, the microglia marker Itgam (A–C), and the astrocyte marker Slc1a3 (D and E) were visualized using RNAscope probes, while plaques were visualized by staining with the anti-Aβ antibody 6E10. Nuclei were visualized with DAPI. Photos are representative of three mice per genotype. (A and D) are representative images of AppNL-G-F CA1 stained for microglia (Itgam) and astrocytes (Slc1a3), respectively. (B) Zoom-in of the boxed area in (A), taken as a separate image with a higher magnification lens. Similarly, (E) is a zoom-in of the boxed area in (D). (C) and (D) are representative images of male wild type C57Bl/6J CA1, stained for microglia (Itgam) and astrocytes (Slc1a3), respectively. Scale bars in (A), (C), (D), and (F) represent 50 μm, while in (B) and (E) represent 20 μm. (G) Quantification of Apoe staining intensity per cell, classified based on the genotype (AppNL-G-F or C57BL/6J), cell type (microglia [mglia] or astrocyte [astro]), and distance from a plaque (ring). For wild-type mice, measurements were made by selecting random regions of interest (ROIs) in the same brain areas as in AppNL-G-F. Measurements were made from at least 25 plaques or ROIs for each condition (AppNL-G-F mglia, C57BL/6J mglia, AppNL-G-F astro, and C57BL/6J astro), collected from 3 mice per genotype. (H) Number of microglia and astrocytes next to plaques. As in (G), cells were classified based on genotype and distance from plaques (AppNL-G-F) or random ROIs (C57BL/6J).
Figure 5.
Figure 5.. Apoe Deletion Prevents the Estab lishment of a Main Inflammatory Response to β-amyloid Plaques
Analysis by single-cell RNA-seq of single live microglial (CD11b+/DAPI−) cells, prepared as described in Figure 1A, from APP/PS1 and APP/PS1-Apoenull mice and their respective wild-type control strains C57BL/6J and C57BL/6J-Apoenull. (A) Middle: t-SNE plot visualizing the 1,880 single microglial cells passing quality control after removal of peripheral cells. Cells are indicated according to clusters identified with Seurat’s kNN approach (H1/2M, homeostatic microglia; TRM, transiting response microglia; ARM, activated response microglia; IRM, interferon response microglia). Left: t-SNE plot as in the middle, colored by the Z-score of gene signatures for the interferon response (IRM). Right: t-SNE plot as in the middle, colored by the Z score of gene signatures for the activated response (ARM). (B) Violin plots of selected marker genes for each identified cluster. The x axis indicates normalized gene expression (ln scale). (C) Percentages of cells from each mouse genotype in the IRMs cluster. (D) Percentages of cells from each mouse genotype in the ARMs cluster.
Figure 6.
Figure 6.. Lack of Apoe Prevents Migration of Microglia toward Plaques
(A–D) Immunofluorescent staining of microglia (Iba1, green), ApoE (red), and Aβ plaques (6E10, white) in sagittal sections of AppNL-G-F (A), APP/PS1 (B), C57BL/6J (C), and APP/PS1-Apoenull (D). Images are zoomed on the dentate gyrus (DG) region. Scale bars represent 20 μm. (E–G) Analysis of amyloid burden in 18- to 20-m.o. APP/PS1 and APP/PS1-Apoenull mice. Total amyloid burden as detected by anti-Aβ immunostaining (E), dense core plaque burden identified by Metoxy-XO4 staining (F), and the ratio between total amyloid burden and dense core plaques (G) are presented as boxplots (boxes represent the 25%–75% quartile range; whiskers represent the ±1.5 interquantile range; each experimental point is represented by a gray dot; n = 5–7 mice per group; *p < 0.05, Mann-Whitney test). (H) Stereological evaluation of the density of Iba-1 reactive microglia around amyloid deposits in APP/PS1 and APP/PS1-Apoenull mice; boxplot is as in (E), n = 5–7 mice per group. **p < 0.001, Mann-Whitney test.

Comment in

Similar articles

Cited by

References

    1. Allen M, Carrasquillo MM, Funk C, Heavner BD, Zou F, Younkin CS, Burgess JD, Chai H-S, Crook J, Eddy JA, et al. (2016). Human whole genome genotype and transcriptome data for Alzheimer’s and other neurodegenerative diseases. Sci. Data 3, 160089. - PMC - PubMed
    1. Askew K, Li K, Olmos-Alonso A, Garcia-Moreno F, Liang Y, Richardson P, Tipton T, Chapman MA, Riecken K, Beccari S, et al. (2017). Coupled proliferation and apoptosis maintain the rapid turnover of microglia in the adult brain. Cell Rep. 18, 391–405. - PMC - PubMed
    1. Bateman RJ, Xiong C, Benzinger TLS, Fagan AM, Goate A, Fox NC, Marcus DS, Cairns NJ, Xie X, Blazey TM, et al.; Dominantly Inherited Alzheimer Network (2012). Clinical and biomarker changes in dominantly inherited Alzheimer’s disease. N. Engl. J. Med 367, 795–804. - PMC - PubMed
    1. Behl C, and Ziegler C (2017). Beyond amyloid—widening the view on Alzheimer’s disease. J. Neurochem 143, 394–395. - PubMed
    1. Bihlmeyer NA, Merrill EM, Lambert Y, Srivastava GP, Clark TW, Hyman BT, and Das S (2019). Novel Methods for Integration and Visualization of Genomics and Genetics Data in Alzheimer’s Disease. Alzheimers Dement. Published online March 29, 2019. 10.1016/j.jalz.2019.01.011. - DOI - PMC - PubMed

Publication types

MeSH terms