

Chemoradiation induces epithelial-to-mesenchymal transition in esophageal adenocarcinoma
- PMID: 31018252
- PMCID: PMC6767775
- DOI: 10.1002/ijc.32364
Chemoradiation induces epithelial-to-mesenchymal transition in esophageal adenocarcinoma
Abstract
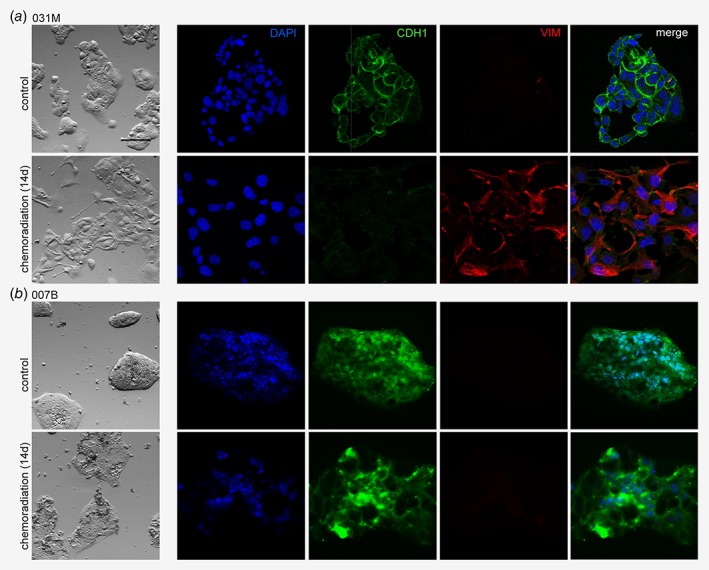
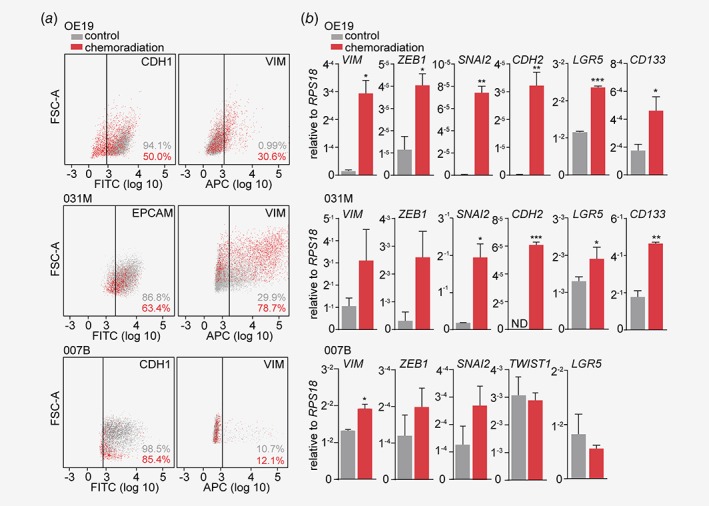
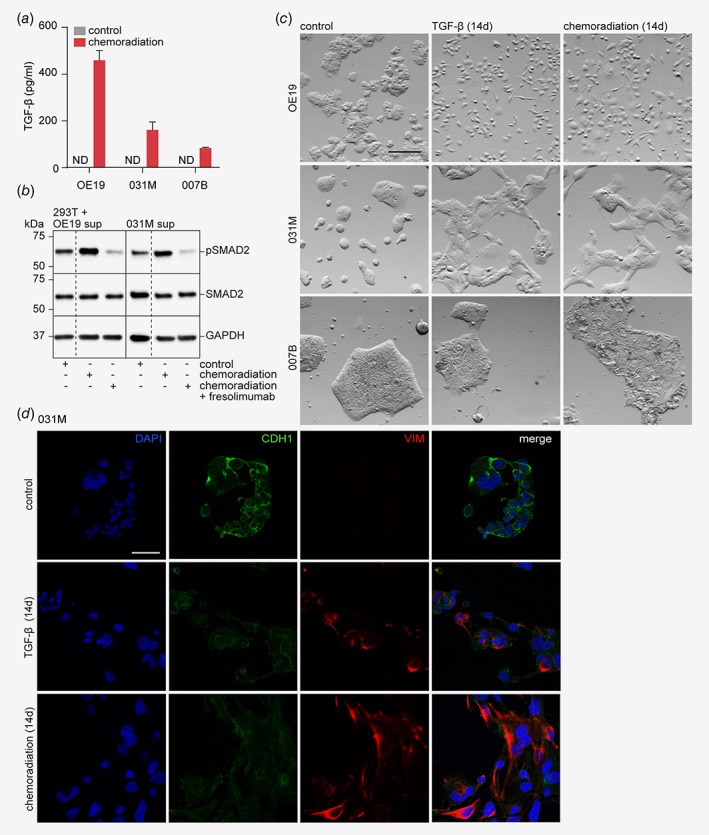
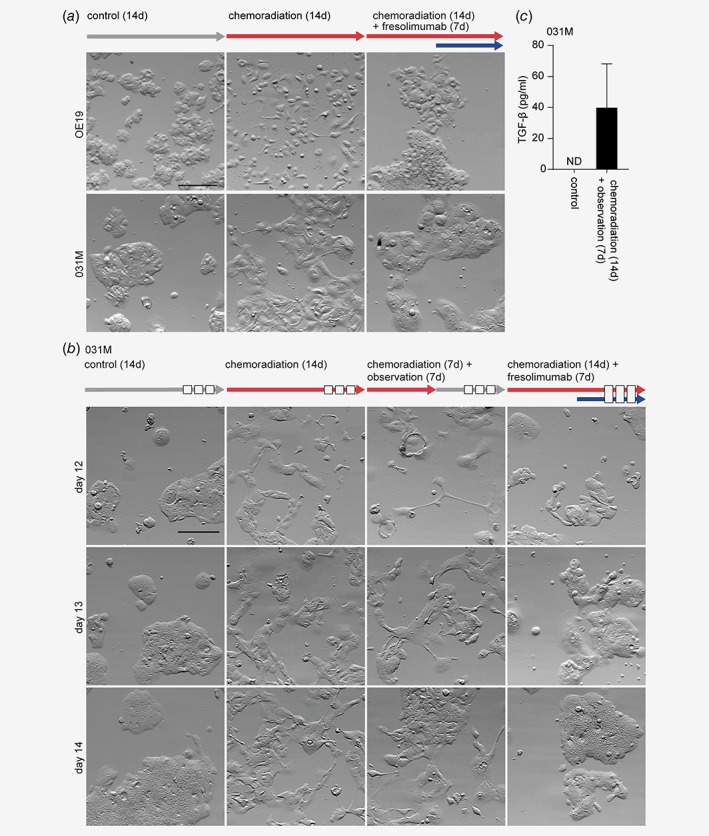
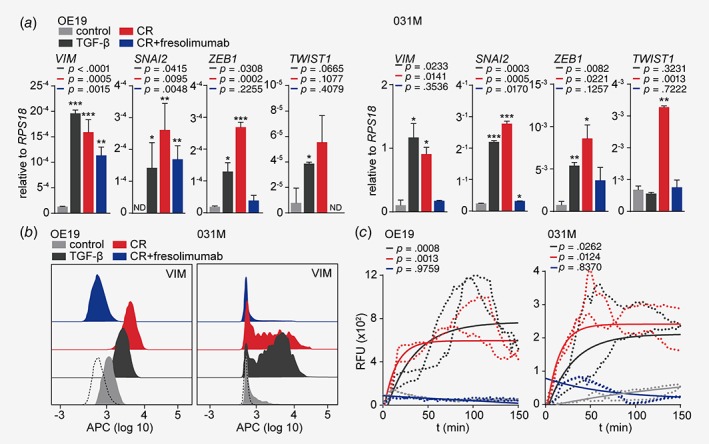
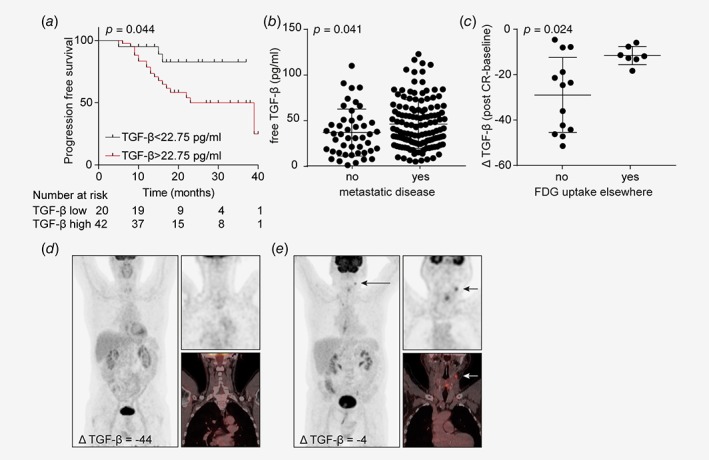
Multimodality treatment has advanced the outcome of esophageal adenocarcinoma (EAC), but overall survival remains poor. Therapeutic pressure activates effective resistance mechanisms and we characterized these mechanisms in response to the currently used neoadjuvant treatment against EAC: carboplatin, paclitaxel and radiotherapy. We developed an in vitro approximation of this regimen and applied it to primary patient-derived cultures. We observed a heterogeneous epithelial-to-mesenchymal (EMT) response to the high therapeutic pressure exerted by chemoradiation. We found EMT to be initiated by the autocrine production and response to transforming growth factor beta (TGF-β) of EAC cells. Inhibition of TGF-β ligands effectively abolished chemoradiation-induced EMT. Assessment of TGF-β serum levels in EAC patients revealed that high levels after neoadjuvant treatment predicted the presence of fluorodeoxyglucose uptake in lymph nodes on the post-chemoradiation positron emission tomography-scan. Our study shows that chemoradiation contributes to resistant metastatic disease in EAC patients by inducing EMT via autocrine TGF-β production. Monitoring TGF-β serum levels during treatment could identify those patients at risk of developing metastatic disease, and who would likely benefit from TGF-β targeting therapy.
Keywords: TGF-β; biomarker; chemoradiation; epithelial-to-mesenchymal transition; esophageal adenocarcinoma.
© 2019 The Authors. International Journal of Cancer published by John Wiley & Sons Ltd on behalf of UICC.
Figures
Similar articles
-
Esophageal Adenocarcinoma Cells and Xenograft Tumors Exposed to Erb-b2 Receptor Tyrosine Kinase 2 and 3 Inhibitors Activate Transforming Growth Factor Beta Signaling, Which Induces Epithelial to Mesenchymal Transition.Gastroenterology. 2017 Jul;153(1):63-76.e14. doi: 10.1053/j.gastro.2017.03.004. Epub 2017 Mar 9. Gastroenterology. 2017. PMID: 28286209
-
Predictive biomarkers for response to TGF- β inhibition in resensitizing chemo(radiated) esophageal adenocarcinoma.Pharmacol Res. 2024 Sep;207:107315. doi: 10.1016/j.phrs.2024.107315. Epub 2024 Jul 24. Pharmacol Res. 2024. PMID: 39059615
-
Neoadjuvant chemoradiotherapy with concurrent cisplatin/5-fluorouracil is associated with increased pathologic complete response and improved survival compared to carboplatin/paclitaxel in patients with locally advanced esophageal cancer.Dis Esophagus. 2017 Jul 1;30(7):1-7. doi: 10.1093/dote/dox015. Dis Esophagus. 2017. PMID: 28475724
-
Utility of PET, CT, and EUS to identify pathologic responders in esophageal cancer.Ann Thorac Surg. 2004 Oct;78(4):1152-60; discussion 1152-60. doi: 10.1016/j.athoracsur.2004.04.046. Ann Thorac Surg. 2004. PMID: 15464463 Review.
-
Role of neoadjuvant therapy for esophageal adenocarcinoma.Surg Oncol Clin N Am. 2009 Jul;18(3):533-46. doi: 10.1016/j.soc.2009.03.004. Surg Oncol Clin N Am. 2009. PMID: 19500742 Review.
Cited by
-
FOXO transcriptional activity is associated with response to chemoradiation in EAC.J Transl Med. 2022 Apr 25;20(1):183. doi: 10.1186/s12967-022-03376-w. J Transl Med. 2022. PMID: 35468793 Free PMC article.
-
miRNA-181a-5p Enhances the Sensitivity of Cells to Cisplatin in Esophageal Adenocarcinoma by Targeting CBLB.Cancer Manag Res. 2020 Jun 25;12:4981-4990. doi: 10.2147/CMAR.S251264. eCollection 2020. Cancer Manag Res. 2020. PMID: 32612385 Free PMC article.
-
Estrogen-related receptor alpha drives mitochondrial biogenesis and resistance to neoadjuvant chemoradiation in esophageal cancer.Cell Rep Med. 2022 Nov 15;3(11):100802. doi: 10.1016/j.xcrm.2022.100802. Epub 2022 Nov 4. Cell Rep Med. 2022. PMID: 36334593 Free PMC article.
-
Circulating proteins as predictive and prognostic biomarkers in breast cancer.Clin Proteomics. 2022 Jul 11;19(1):25. doi: 10.1186/s12014-022-09362-0. Clin Proteomics. 2022. PMID: 35818030 Free PMC article. Review.
-
Tumor Microenvironment of Esophageal Cancer.Cancers (Basel). 2021 Sep 18;13(18):4678. doi: 10.3390/cancers13184678. Cancers (Basel). 2021. PMID: 34572905 Free PMC article. Review.
References
-
- Shapiro J, van Lanschot JJB, Hulshof MCCM, et al. Neoadjuvant chemoradiotherapy plus surgery versus surgery alone for oesophageal or junctional cancer (CROSS): long‐term results of a randomised controlled trial. Lancet Oncol 2015;16:1090–8. - PubMed
-
- van Hagen P, Hulshof MCCM, van Lanschot JJB, et al. Preoperative chemoradiotherapy for esophageal or junctional cancer. N Engl J Med 2012;366:2074–84. - PubMed
-
- Oppedijk V, van der Gaast A, van Lanschot JJB, et al. Patterns of recurrence after surgery alone versus preoperative chemoradiotherapy and surgery in the CROSS trials. J Clin Oncol 2014;32:385–91. - PubMed
Publication types
MeSH terms
Substances
Supplementary concepts
LinkOut - more resources
Full Text Sources
Medical
