. 2019 Apr 23;11(4):571.
doi: 10.3390/cancers11040571.

Chronic Treatment with Multi-Kinase Inhibitors Causes Differential Toxicities on Skeletal and Cardiac Muscles

Affiliations

Chronic Treatment with Multi-Kinase Inhibitors Causes Differential Toxicities on Skeletal and Cardiac Muscles

Joshua R Huot et al. Cancers (Basel). .

Abstract

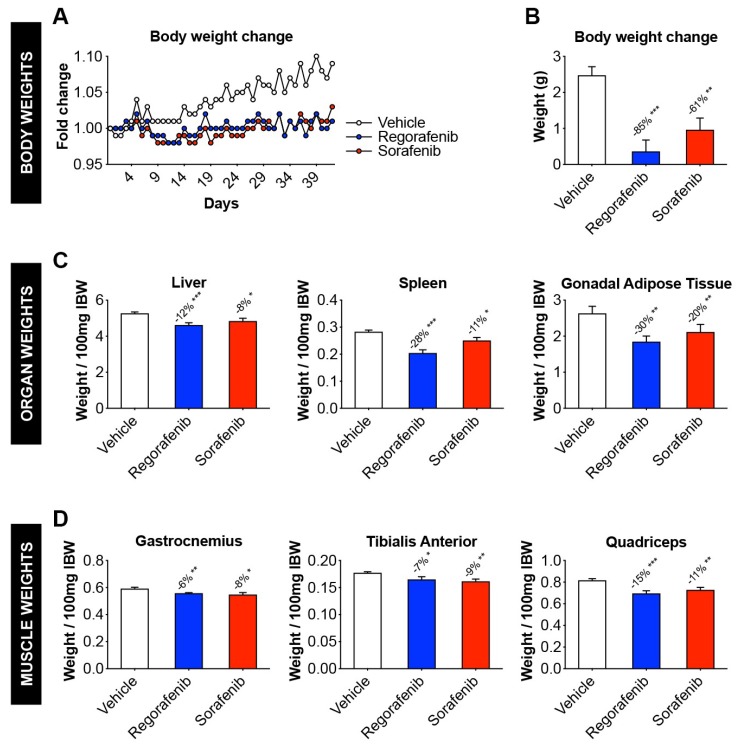
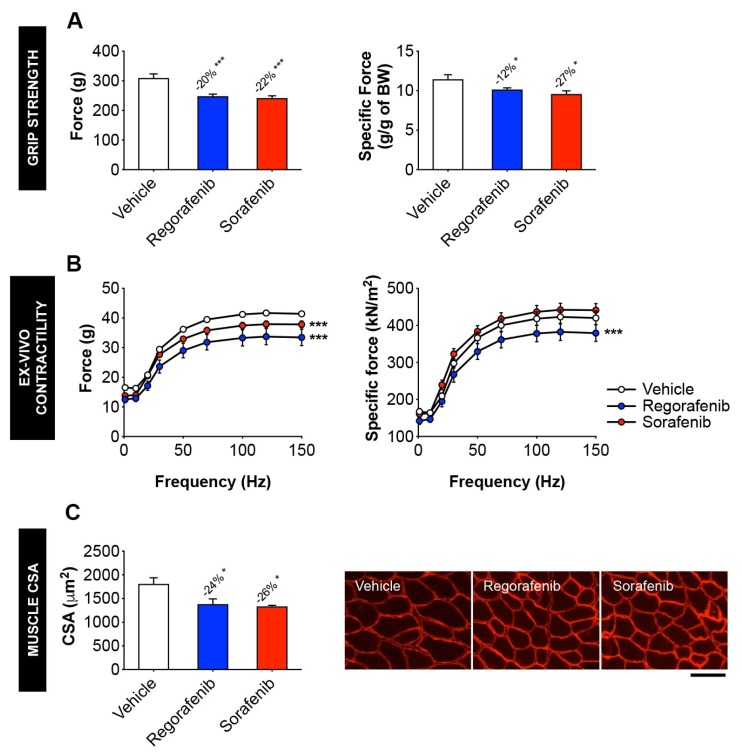
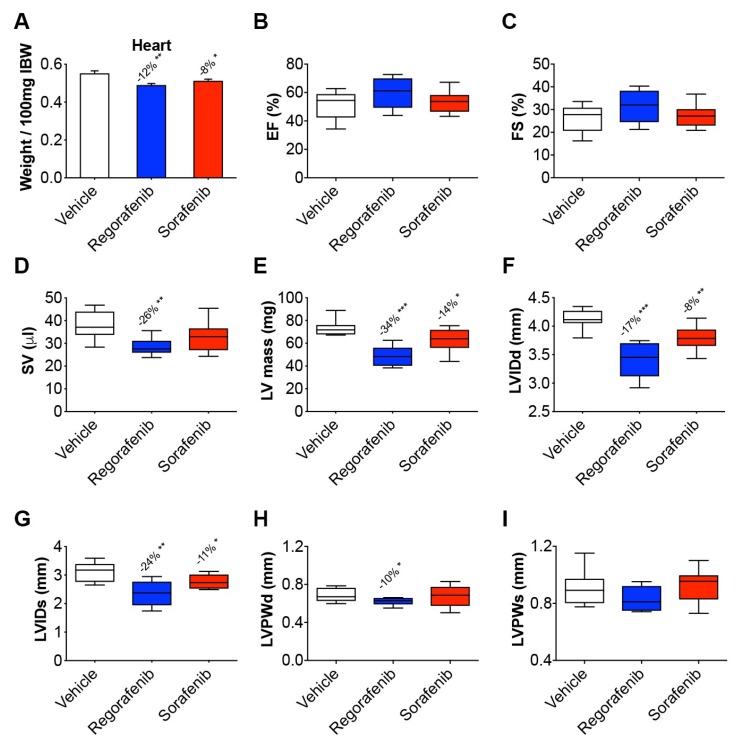
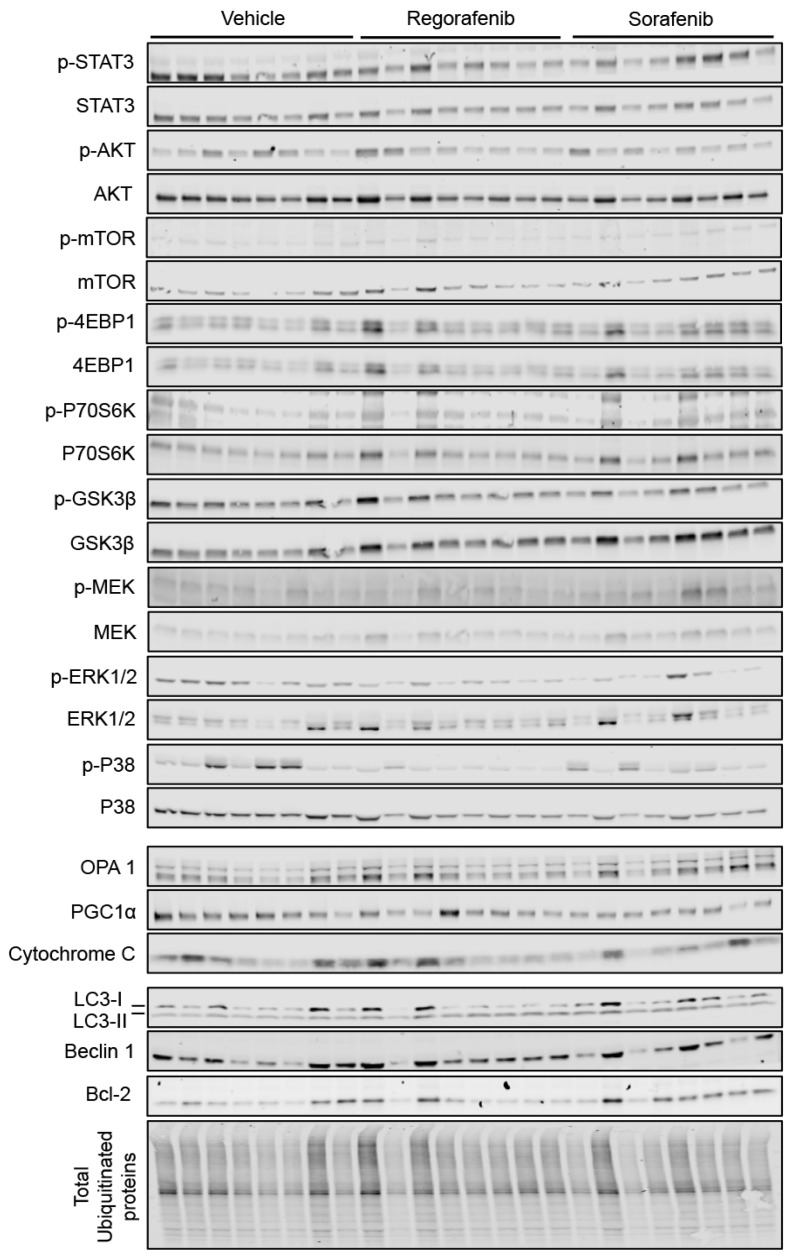
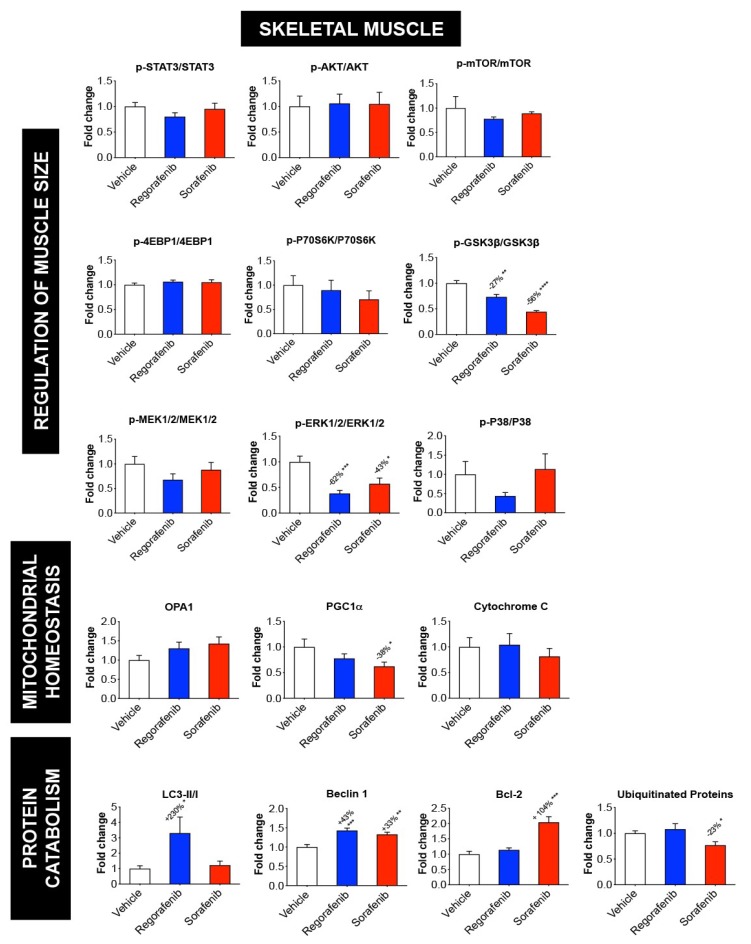
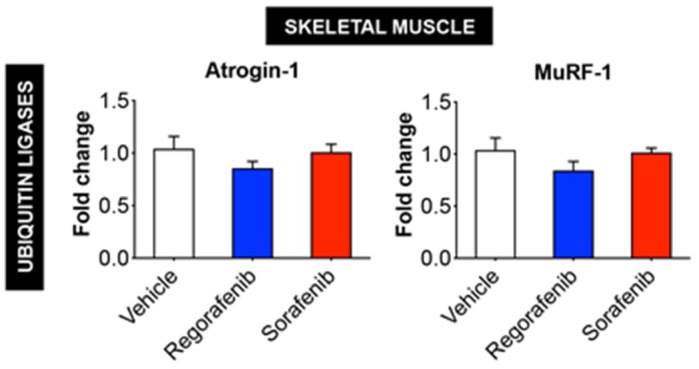
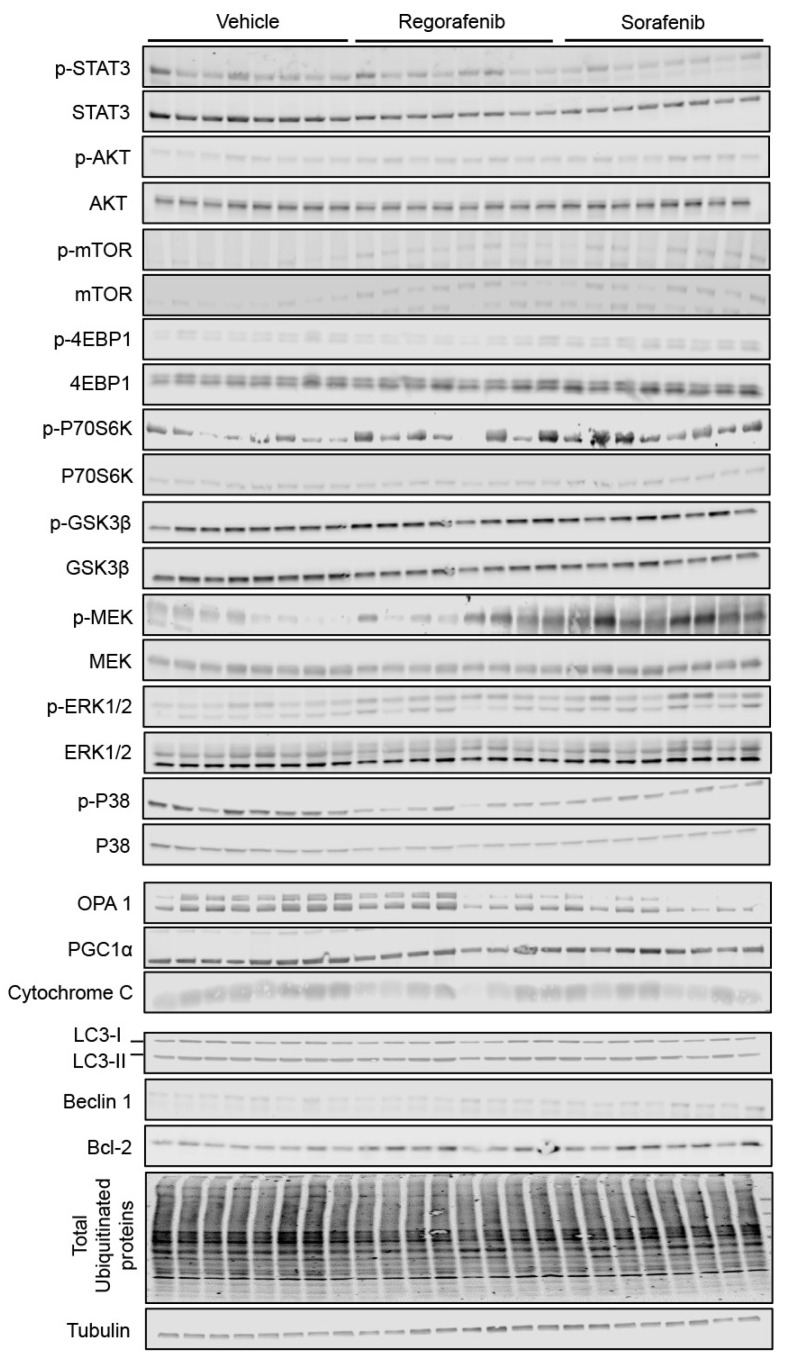
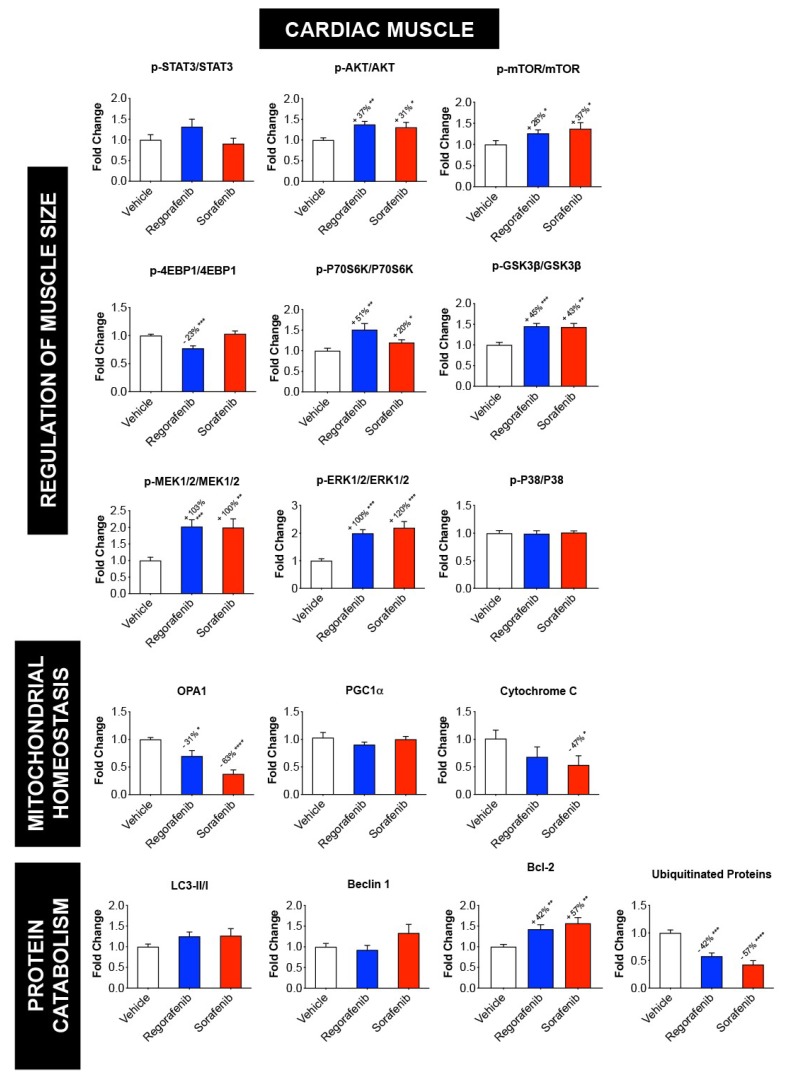
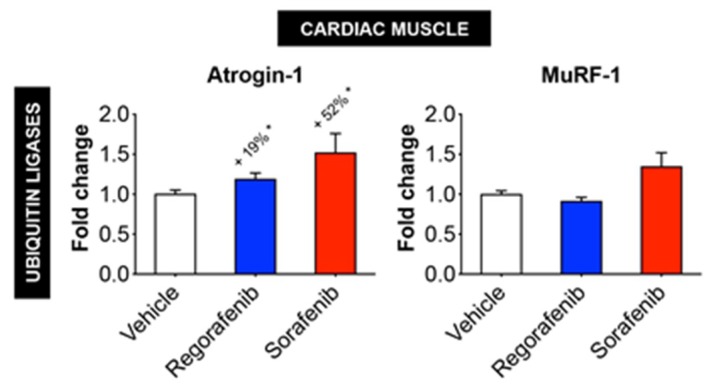
Despite recent progress, chemotherapy remains the preferred treatment for cancer. We have shown a link between anticancer drugs and the development of cachexia, i.e., body wasting accompanied by muscle loss. The multi-kinase inhibitors (MKIs) regorafenib and sorafenib, used as second-line treatment for solid tumors, are frequently accompanied by several side effects, including loss of muscle mass and strength. In the present study we aimed to investigate the molecular mechanisms associated with the occurrence of muscle toxicities in in vivo conditions. Hence, we treated 8-week old healthy CD2F1 male mice with MKIs for up to six weeks and observed decreased skeletal and cardiac muscle mass, consistent with muscle weakness. Modulation of ERK1/2 and GSK3β, as well as increased expression of markers of autophagy, previously associated with muscle atrophy conditions, were shown in skeletal muscle upon treatment with either drug. MKIs also promoted cardiac abnormalities consistent with reduced left ventricular mass, internal diameter, posterior wall thickness and stroke volume, despite unchanged overall function. Notably, different signaling pathways were affected in the heart, including reduced expression of mitochondrial proteins, and elevated AKT, GSK3β, mTOR, MEK1/2 and ERK1/2 phosphorylation. Combined, our data demonstrate detrimental effects on skeletal and cardiac muscle in association with chronic administration of MKIs, although different mechanisms would seem to contribute to the cachectic phenotype in the two tissues.

Keywords: cardiac cachexia; chemotherapy; regorafenib; skeletal muscle wasting; sorafenib.


Conflict of interest statement

The authors declare no conflict of interest.

Figures

Figure 1
Figure 1
Animals exposed to regorafenib or sorafenib display impaired growth. (A) Body weight change (normalized to initial body weight) in mice treated with 30 mg/kg/day regorafenib (blue; n = 8), 60 mg/kg/day sorafenib (red; n = 8), or vehicle (white; n = 8) over the course of 6 weeks. (B) Net body weight change (initial to final), expressed in grams. (C) Liver, spleen, and gonadal adipose tissue weights (expressed as weight/100 mg Initial Body Weight). (D) gastrocnemius, tibialis anterior, and quadriceps muscle weights (expressed as weight/100 mg Initial Body Weight). Data presented as mean ± SEM. Significance of the difference: * p < 0.05, ** p < 0.01, *** p < 0.001 vs. Vehicle.
Figure 2
Figure 2
MKIs promote skeletal muscle weakness. (A) Assessment of grip strength, reported as absolute force (expressed in grams) or specific force (expressed relative to body weight (BW)) in mice treated with 30 mg/kg/day regorafenib (blue; n = 8), 60 mg/kg/day sorafenib (red; n = 8), or vehicle (white; n = 8) over the course of 6 weeks. (B) Assessment of whole muscle contractility of EDL muscle, reported as absolute muscle force (expressed in grams) and specific force (expressed as kN/m2). (C) Cross-sectional area (CSA) of tibialis anterior muscles and representative CSA image of tibialis anterior muscle sections stained with anti-dystrophin antibody. Images taken at 20×, scale bar equals 100 µm. Data presented as mean ± SEM. Significance of the difference: * p < 0.05, *** p < 0.001 vs. Vehicle.
Figure 3
Figure 3
Regorafenib and sorafenib perturb cardiac muscle. Cardiac function measured by echocardiography in mice treated with 30 mg/kg/day regorafenib (blue; n = 8), 60 mg/kg/day sorafenib (red; n = 8), or vehicle (white; n = 8) over the course of 6 weeks. (A) Heart size (relative to initial body weight). (B) Ejection fraction (EF). (C) Fractional shortening (FS). (D) Stroke volume (SV). (E) Left ventricular (LV) mass. (F) Left ventricular inner wall diameter (LVID) during diastole. (G) LVID during systole. (H) Left ventricular posterior wall (LVPW) thickness during diastole. (I) LVPW thickness during systole. Data presented as mean ± SEM. Significance of the difference: * p < 0.05, ** p < 0.01, *** p < 0.001 vs. Vehicle.
Figure 4
Figure 4
MKIs determine skeletal muscle atrophy. Representative western blotting and quantification (expressed as fold change vs. Vehicle) of proteins involved in the regulation of muscle size (STAT3, AKT, mTOR, 4EBP1, P70S6K, GSK3β, P38, MEK1/2, ERK1/2) (Top), proteins involved in mitochondrial homeostasis (OPA1, PGC1α, Cytochrome C) (Middle), and protein markers of autophagy-dependent catabolism (LC3, Beclin 1, Bcl-2 and total ubiquitinated proteins) (Bottom) in whole skeletal muscle protein extracts from mice treated with 30 mg/kg/day regorafenib (blue; n = 8), 60 mg/kg/day sorafenib (red; n = 8), or vehicle (white; n = 8) over the course of 6 weeks. Levels of phosphorylated proteins were normalized to their respective total protein. Tubulin served as the loading control. Data presented as mean ± SEM. Significance of the difference: * p < 0.05, ** p < 0.01, *** p < 0.001, **** p < 0.0001 vs. Vehicle.
Figure 4
Figure 4
MKIs determine skeletal muscle atrophy. Representative western blotting and quantification (expressed as fold change vs. Vehicle) of proteins involved in the regulation of muscle size (STAT3, AKT, mTOR, 4EBP1, P70S6K, GSK3β, P38, MEK1/2, ERK1/2) (Top), proteins involved in mitochondrial homeostasis (OPA1, PGC1α, Cytochrome C) (Middle), and protein markers of autophagy-dependent catabolism (LC3, Beclin 1, Bcl-2 and total ubiquitinated proteins) (Bottom) in whole skeletal muscle protein extracts from mice treated with 30 mg/kg/day regorafenib (blue; n = 8), 60 mg/kg/day sorafenib (red; n = 8), or vehicle (white; n = 8) over the course of 6 weeks. Levels of phosphorylated proteins were normalized to their respective total protein. Tubulin served as the loading control. Data presented as mean ± SEM. Significance of the difference: * p < 0.05, ** p < 0.01, *** p < 0.001, **** p < 0.0001 vs. Vehicle.
Figure 5
Figure 5
Expression of ubiquitin ligases Atrogin-1 and MuRF-1 in skeletal muscle is not affected by MKIs. mRNA expression for Atrogin-1 and MuRF-1 in the skeletal muscle of mice treated with 30 mg/kg/day regorafenib (blue; n = 8), 60 mg/kg/day sorafenib (red; n = 8), or vehicle (white; n = 8) over the course of 6 weeks. Data presented as mean ± SEM.
Figure 6
Figure 6
Regorafenib and sorafenib alter cachexia-associated pathways in cardiac muscle. Representative western blotting and quantification (expressed as fold change vs. Vehicle) of proteins involved in the regulation of muscle size (STAT3, AKT, mTOR, 4EBP1, P70S6K, GSK3β, P38, MEK1/2, ERK1/2) (Top), proteins involved in mitochondrial homeostasis (OPA1, PGC1α, Cytochrome C) (Middle), and markers of protein catabolism, (LC3, Beclin 1, Bcl-2 and total ubiquitinated proteins) (Bottom) in whole cardiac muscle protein extracts from mice treated with 30 mg/kg/day regorafenib (blue; n = 8), 60 mg/kg/day sorafenib (red; n = 8), or vehicle (white; n = 8) over the course of 6 weeks. Levels of phosphorylated proteins were normalized to their respective total protein. Tubulin served as the loading control. Data presented as mean ± SEM. Significance of the difference: * p < 0.05, ** p < 0.01, *** p < 0.001, **** p < 0.0001 vs. Vehicle.
Figure 6
Figure 6
Regorafenib and sorafenib alter cachexia-associated pathways in cardiac muscle. Representative western blotting and quantification (expressed as fold change vs. Vehicle) of proteins involved in the regulation of muscle size (STAT3, AKT, mTOR, 4EBP1, P70S6K, GSK3β, P38, MEK1/2, ERK1/2) (Top), proteins involved in mitochondrial homeostasis (OPA1, PGC1α, Cytochrome C) (Middle), and markers of protein catabolism, (LC3, Beclin 1, Bcl-2 and total ubiquitinated proteins) (Bottom) in whole cardiac muscle protein extracts from mice treated with 30 mg/kg/day regorafenib (blue; n = 8), 60 mg/kg/day sorafenib (red; n = 8), or vehicle (white; n = 8) over the course of 6 weeks. Levels of phosphorylated proteins were normalized to their respective total protein. Tubulin served as the loading control. Data presented as mean ± SEM. Significance of the difference: * p < 0.05, ** p < 0.01, *** p < 0.001, **** p < 0.0001 vs. Vehicle.
Figure 7
Figure 7
MKIs determine increased expression of cardiac Atrogin-1, whereas MuRF-1 is unchanged. mRNA expression for Atrogin-1 and MuRF-1 in the cardiac muscle of mice treated with 30 mg/kg/day regorafenib (blue; n = 8), 60 mg/kg/day sorafenib (red; n = 8), or vehicle (white; n = 8) over the course of 6 weeks. Data presented as mean ± SEM. Significance of the difference: * p < 0.05 vs. Vehicle.

Similar articles

Cited by

References

    1. Dewys W.D., Begg C., Lavin P.T., Band P.R., Bennett J.M., Bertino J.R., Cohen M.H., Douglass H.O., Jr., Engstrom P.F., Ezdinli E.Z., et al. Prognostic effect of weight loss prior to chemotherapy in cancer patients. Eastern Cooperative Oncology Group. Am. J. Med. 1980;69:491–497. doi: 10.1016/S0149-2918(05)80001-3. - DOI - PubMed
    1. Barreto R., Mandili G., Witzmann F.A., Novelli F., Zimmers T.A., Bonetto A. Cancer and Chemotherapy Contribute to Muscle Loss by Activating Common Signaling Pathways. Front. Physiol. 2016;7:472. doi: 10.3389/fphys.2016.00472. - DOI - PMC - PubMed
    1. Barreto R., Waning D.L., Gao H., Liu Y., Zimmers T.A., Bonetto A. Chemotherapy-related cachexia is associated with mitochondrial depletion and the activation of ERK1/2 and p38 MAPKs. Oncotarget. 2016;7:43442–43460. doi: 10.18632/oncotarget.9779. - DOI - PMC - PubMed
    1. Pin F., Barreto R., Couch M.E., Bonetto A., O’Connell T.M. Cachexia induced by cancer and chemotherapy yield distinct perturbations to energy metabolism. J. Cachexia Sarcopenia Muscle. 2019 doi: 10.1002/jcsm.12360. - DOI - PMC - PubMed
    1. Ohnuma T., Adigun R. Cancer, Anorexia and Cachexia. StatPearls; Treasure Island, FL, USA: 2018.

LinkOut - more resources