. 2019 Apr 23;9(4):159.
doi: 10.3390/biom9040159.

Curcuma raktakanda Induces Apoptosis and Suppresses Migration in Cancer Cells: Role of Reactive Oxygen Species

Affiliations

Curcuma raktakanda Induces Apoptosis and Suppresses Migration in Cancer Cells: Role of Reactive Oxygen Species

Shruti Mishra et al. Biomolecules. .

Abstract

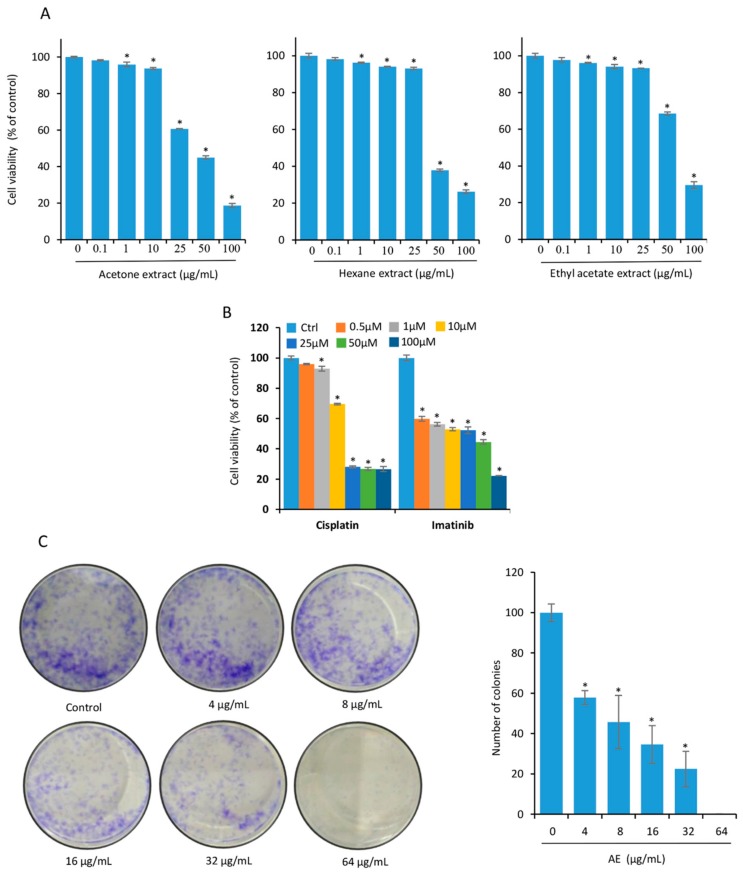
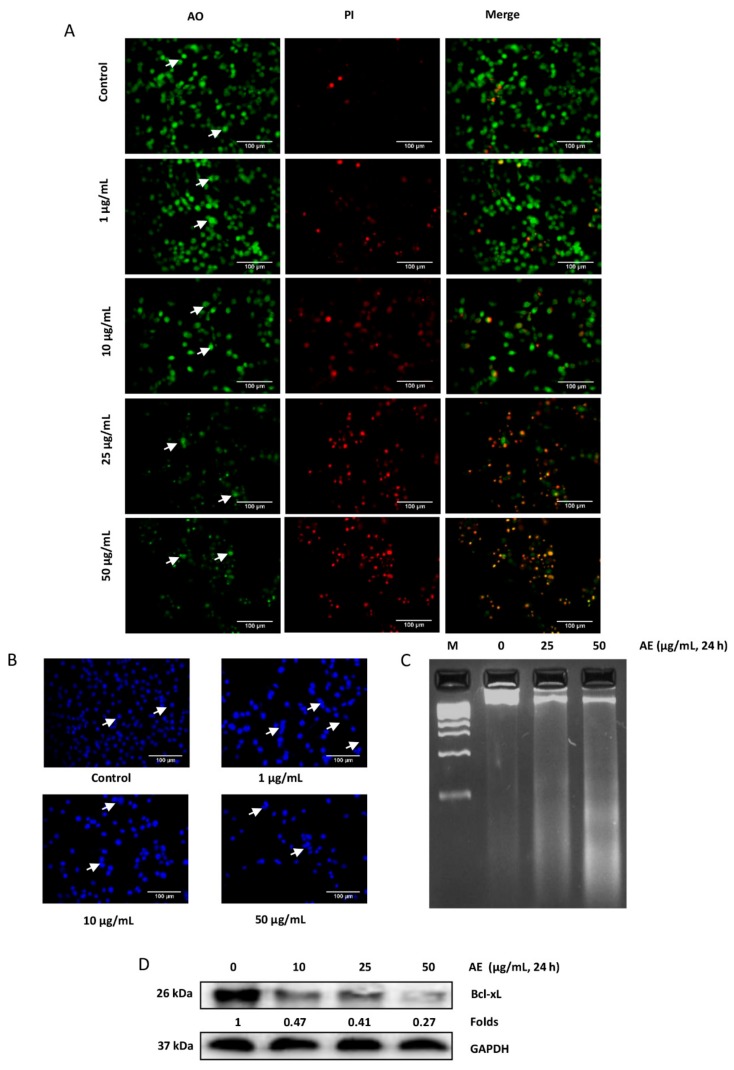
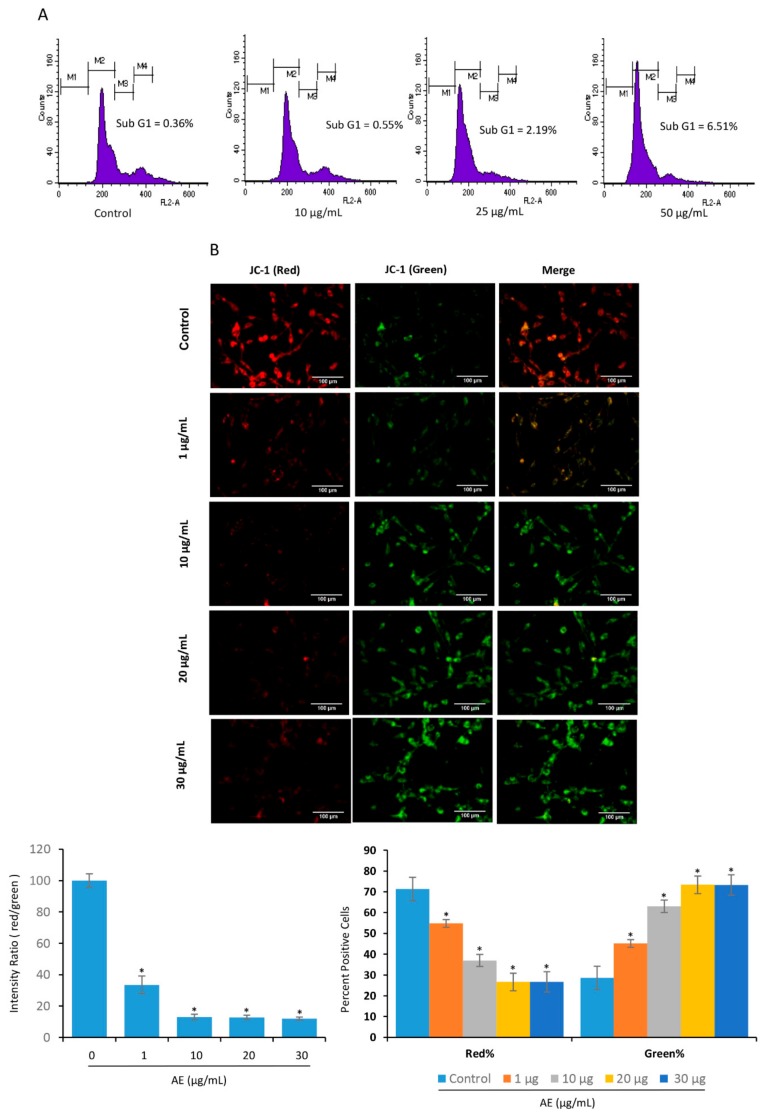
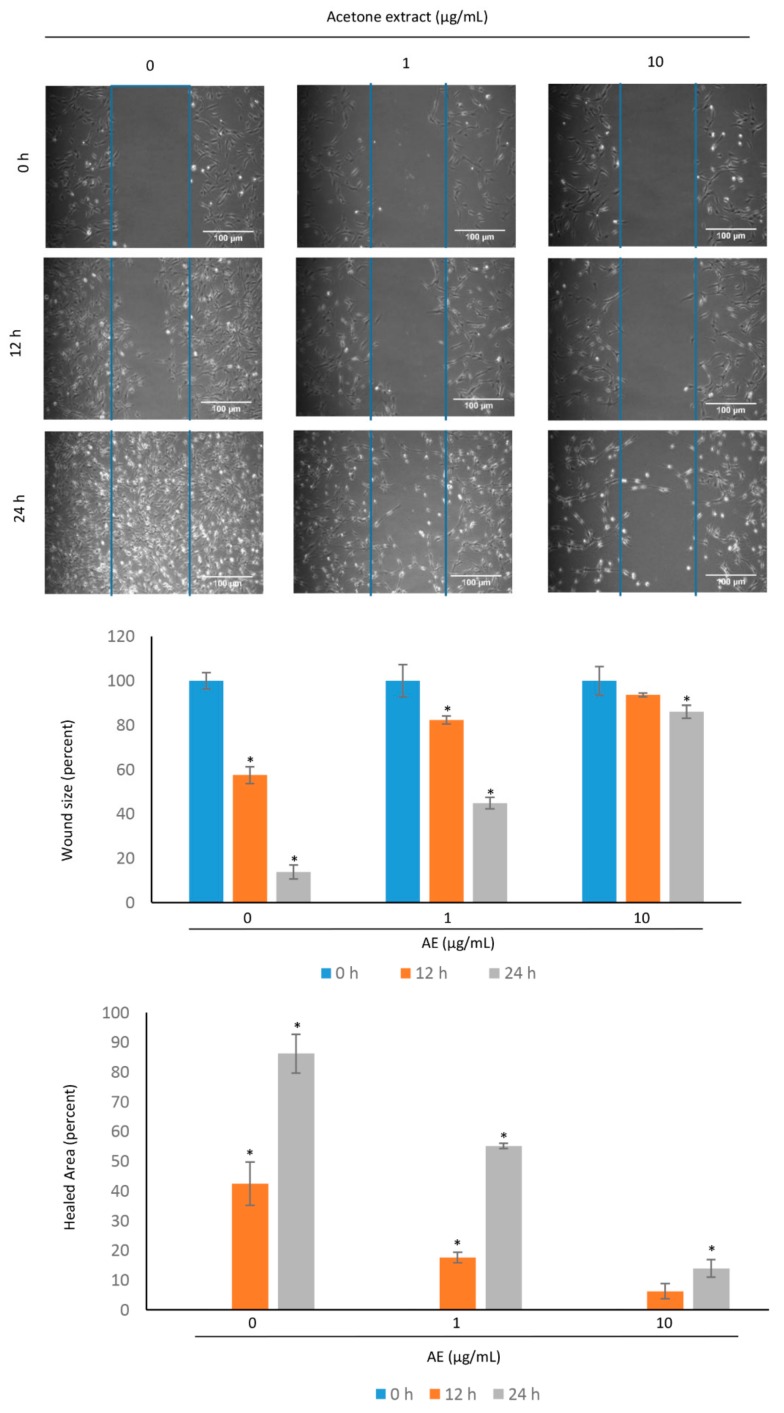
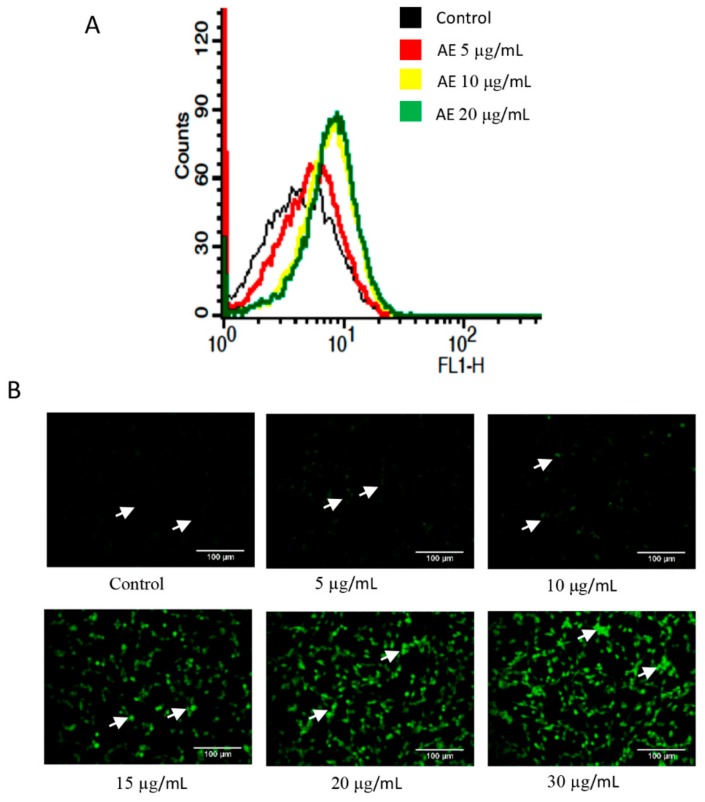
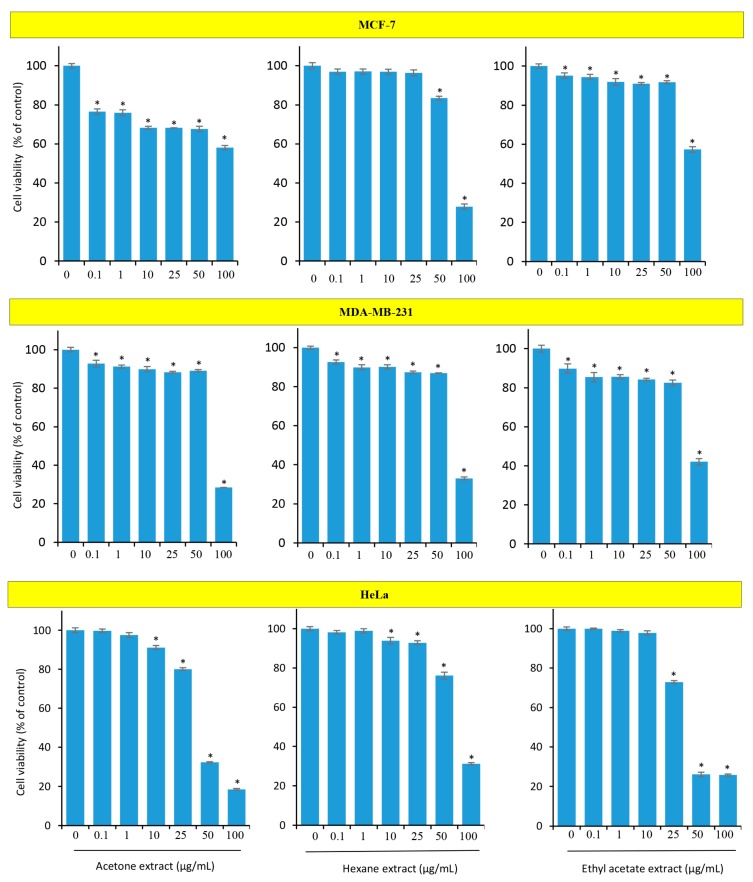
Although over 100 species of Curcuma are reported, only Curcuma longa is extensively studied. Curcuma raktakanda, a poorly studied species, is most commonly distributed in the Kerala state of India. For the first time, we examined the efficacy of different fractions (acetone, hexane, and ethyl acetate) of C. raktakanda against glioma, cervical, and breast cancer cell lines. As determined by mitochondrial reductase activity assay, the viability of cancer cells was decreased in a concentration-dependent manner by the three fractions. The half maximal inhibitory concentration (IC-50) values after the treatment of C-6 glioma cells for 48 h was found to be 32.97 µg/mL (acetone extract), 40.63 µg/mL (hexane extract), and 51.65 µg/mL (ethyl acetate extract). Of the three fractions, the acetone fraction was more effective. The long-term colony formation of cancer cells was significantly suppressed by the acetone fraction. Analyses using DAPI (4',6-diamidino-2-phenylindole) staining, AO/PI (acridine orange/propidium iodide) staining, DNA laddering, and sub-G1 population revealed that the acetone extract induced apoptosis in glioma cells. The extract induced reactive oxygen species generation and suppressed the expression of cell survival proteins. The migration of cancer cells was also suppressed by the acetone extract. The gas chromatography-mass spectrometry (GC-MS) analysis indicated that tetracontane, dotriacontane, hexatriacontane, pentacosane, hexacosane, and eicosane are the major components in the acetone extract. Collectively, the extract from C. raktakanda exhibited anti-carcinogenic activities in cancer cells. We are exploring whether the phytoconstituents, individually, or collectively contribute to the anti-cancer activities of C. raktakanda.

Keywords: cancer; curcuma; glioblastoma; inflammation; reactive oxygen species.


Conflict of interest statement

The authors declare no conflict of interest.

Figures

Figure 1
Figure 1
The rhizome extract of C. raktakanda suppresses viability and long-term colony formation of glioma cells. (A) C-6 glioma cells were exposed to different concentrations (µg/mL) of CR extracts (acetone, hexane, and ethyl acetate) for 48 h. The proliferation of cells was examined by 3-[4,5-dimethylthiazol-2-yl]-2,5-diphenyl tetrazolium bromide (MTT) assay. Note that the acetone extract was more potent as compared to hexane and ethyl acetate. (B) Cisplatin and imatinib were used as positive controls. (C) C-6 cells (1000 cells/well) were treated with indicated concentrations (µg/mL) of the acetone extract for 6 h. After seven days, the colonies were stained with 0.1% crystal violet and counted manually. A concentration dependent reduction in the number of colonies was observed after treatment with acetone extract. Where indicated, the values are mean ± SE from three experiments. *- indicates the significance of difference compared to the control group; P < 0.05. AE, acetone extract; CR, Curcuma raktakanda.
Figure 2
Figure 2
Acetone extract induces apoptosis in glioma cells. (A) C-6 glioma cells were exposed to different concentrations (µg/mL) of acetone extract. After 24 h, cells were stained with acridine orange (AO)/propidium iodide (PI) (10 µg/mL) and observed under fluorescence microscope. As indicated by arrows, control cells exhibited round to oval shaped green nucleus. In treated cells, orange to red fluorescence was observed with condensed and fragmented nucleus. (B) C-6 cells were treated with indicated concentration (µg/mL) of acetone extract. After 24 h, cells were fixed, permeabilized and mounted with DAPI. While fragmentation was observed in the treated cells, round and oval shaped nuclei were observed in the control cells as shown by arrows. (C) C-6 cells were exposed to acetone extract for 24 h, DNA was isolated and electrophoresed on agarose gel. Note the presence of DNA smear in the treated cells at higher concentration. (D) C-6 cells were exposed to indicated concentrations (µg/mL) of acetone extract for 24 h and the expression of Bcl-xL was examined in the whole cell extract by western blotting. Glyceraldehyde-3-phosphate dehydrogenase (GAPDH) was used as an internal control. Values below the blot indicate fold change in the Bcl-xL expression compared to control. The scale bar represents 100 µm. AE, acetone extract.
Figure 3
Figure 3
Acetone extract induces cell cycle arrest and lowers mitochondrial membrane potential in glioma cells. (A) C-6 glioma cells were exposed to indicated concentrations (µg/mL) of acetone extract for 24 h. Cells were then fixed and washed with PBS before staining with PI. The population at different phases of cell cycle were examined by flow cytometry. Note an increase in the sub-G1 population at the higher doses of acetone extract. (B) C6 cells were treated with the indicated concentrations (µg/mL) of the acetone extract for 24 h and then stained with JC-1 (10 µg/mL). The cells were then washed and observed under fluorescence microscope. In control cells, the intense red fluorescence indicates high mitochondrial membrane potential. The presence of green fluorescence in treated cells suggests depolarized mitochondria. A concentration dependent decrease in the ratio of red/green fluorescence was observed (lower left). While red stained cells decreased in a concentration dependent manner, a significant increase in the green stained cells was observed (lower right). Where indicated, the values are mean ± SE from three experiments. *- indicates the significance of difference compared to the control group; P < 0.05. The scale bar represents 100 µm. AE, acetone extract.
Figure 4
Figure 4
Acetone extract suppresses the migration of C-6 glioma cells. The sterile microtips were used to scratch over the cells with 70% confluency. The different concentrations (µg/mL) of acetone extract was then provided to the cells. The scratched area was examined under phase contrast microscope. The percentage of wound size and healed area was measured at different time intervals. The values are mean ± SE from three experiments. *- indicates the significance of difference compared to the control group; P < 0.05. Note a decrease in the migration potential of C-6 cells after treatment with acetone extract. The scale bar represents 100 µm. AE, acetone extract.
Figure 5
Figure 5
Acetone extract induces reactive oxygen species (ROS) generation. (A) C-6 cells were treated with indicated concentrations (µg/mL) of acetone extract for 1 h. The cells were then stained with H2DCFDA (10 µM) for 30 min and ROS generation was measured by flow cytometry. (B) The stained cells were also visualized under fluorescence microscope. The arrows indicate DCFDA stained cells in the control and treated groups. Note a concentration dependent increase in the level of ROS (DCFDA stained cells) after treatment with acetone extract. The scale bar represents 100 µm. AE, acetone extract.
Figure 6
Figure 6
The rhizome extract of C. raktakanda suppresses the proliferation of cancer cells from diverse origin. Breast (MDA-MB-231, MCF-7) and cervical (HeLa) cells were exposed to different concentrations (µg/mL) of CR extracts (acetone, hexane, ethyl acetate) for 48 h. The viability of cells was examined by mitochondrial membrane potential (MTT) assay. Note that the cancer cells exhibited varied degree of sensitivity to the three extracts. Values are mean ± SE from three experiments. *- indicates the significance of difference compared to the control group; P < 0.05.

References

    1. Louis D.N., Perry A., Reifenberger G., Von Deimling A., Figarella-Branger D., Cavenee W.K., Ohgaki H., Wiestler O.D., Kleihues P., Ellison D.W. The 2016 World Health Organization classification of tumors of the central nervous system: A summary. Acta Neuropathol. 2016;131:803–820. doi: 10.1007/s00401-016-1545-1. - DOI - PubMed
    1. Shirai K., Chakravarti A. Towards personalized therapy for patients with glioblastoma. Expert Rev. Anticancer. Ther. 2011;11:1935–1944. doi: 10.1586/era.11.103. - DOI - PMC - PubMed
    1. Greenlee R.T., Murray T., Bolden S., Wingo P.A. Cancer statistics, 2000. CA Cancer J. Clin. 2000;50:7–33. doi: 10.3322/canjclin.50.1.7. - DOI - PubMed
    1. Régina A., Demeule M., Laplante A., Jodoin J., Dagenais C., Berthelet F., Moghrabi A., Béliveau R. Multidrug resistance in brain tumors: Roles of the blood–brain barrier. Cancer Metastasis Rev. 2001;20:13–25. doi: 10.1023/A:1013104423154. - DOI - PubMed
    1. Mirimanoff R.-O., Gorlia T., Mason W., Van den Bent M.J., Kortmann R.-D., Fisher B., Reni M., Brandes A.A., Curschmann J., Villa S. Radiotherapy and temozolomide for newly diagnosed glioblastoma: Recursive partitioning analysis of the EORTC 26981/22981-NCIC CE3 phase III randomized trial. J. Clin. Oncol. 2006;24:2563–2569. doi: 10.1200/JCO.2005.04.5963. - DOI - PubMed

Publication types