. 2019 Jul:101:94-108.
doi: 10.1016/j.jaut.2019.04.015. Epub 2019 Apr 22.

Tmem178 negatively regulates store-operated calcium entry in myeloid cells via association with STIM1

Affiliations

Tmem178 negatively regulates store-operated calcium entry in myeloid cells via association with STIM1

Zhengfeng Yang et al. J Autoimmun. 2019 Jul.

Abstract

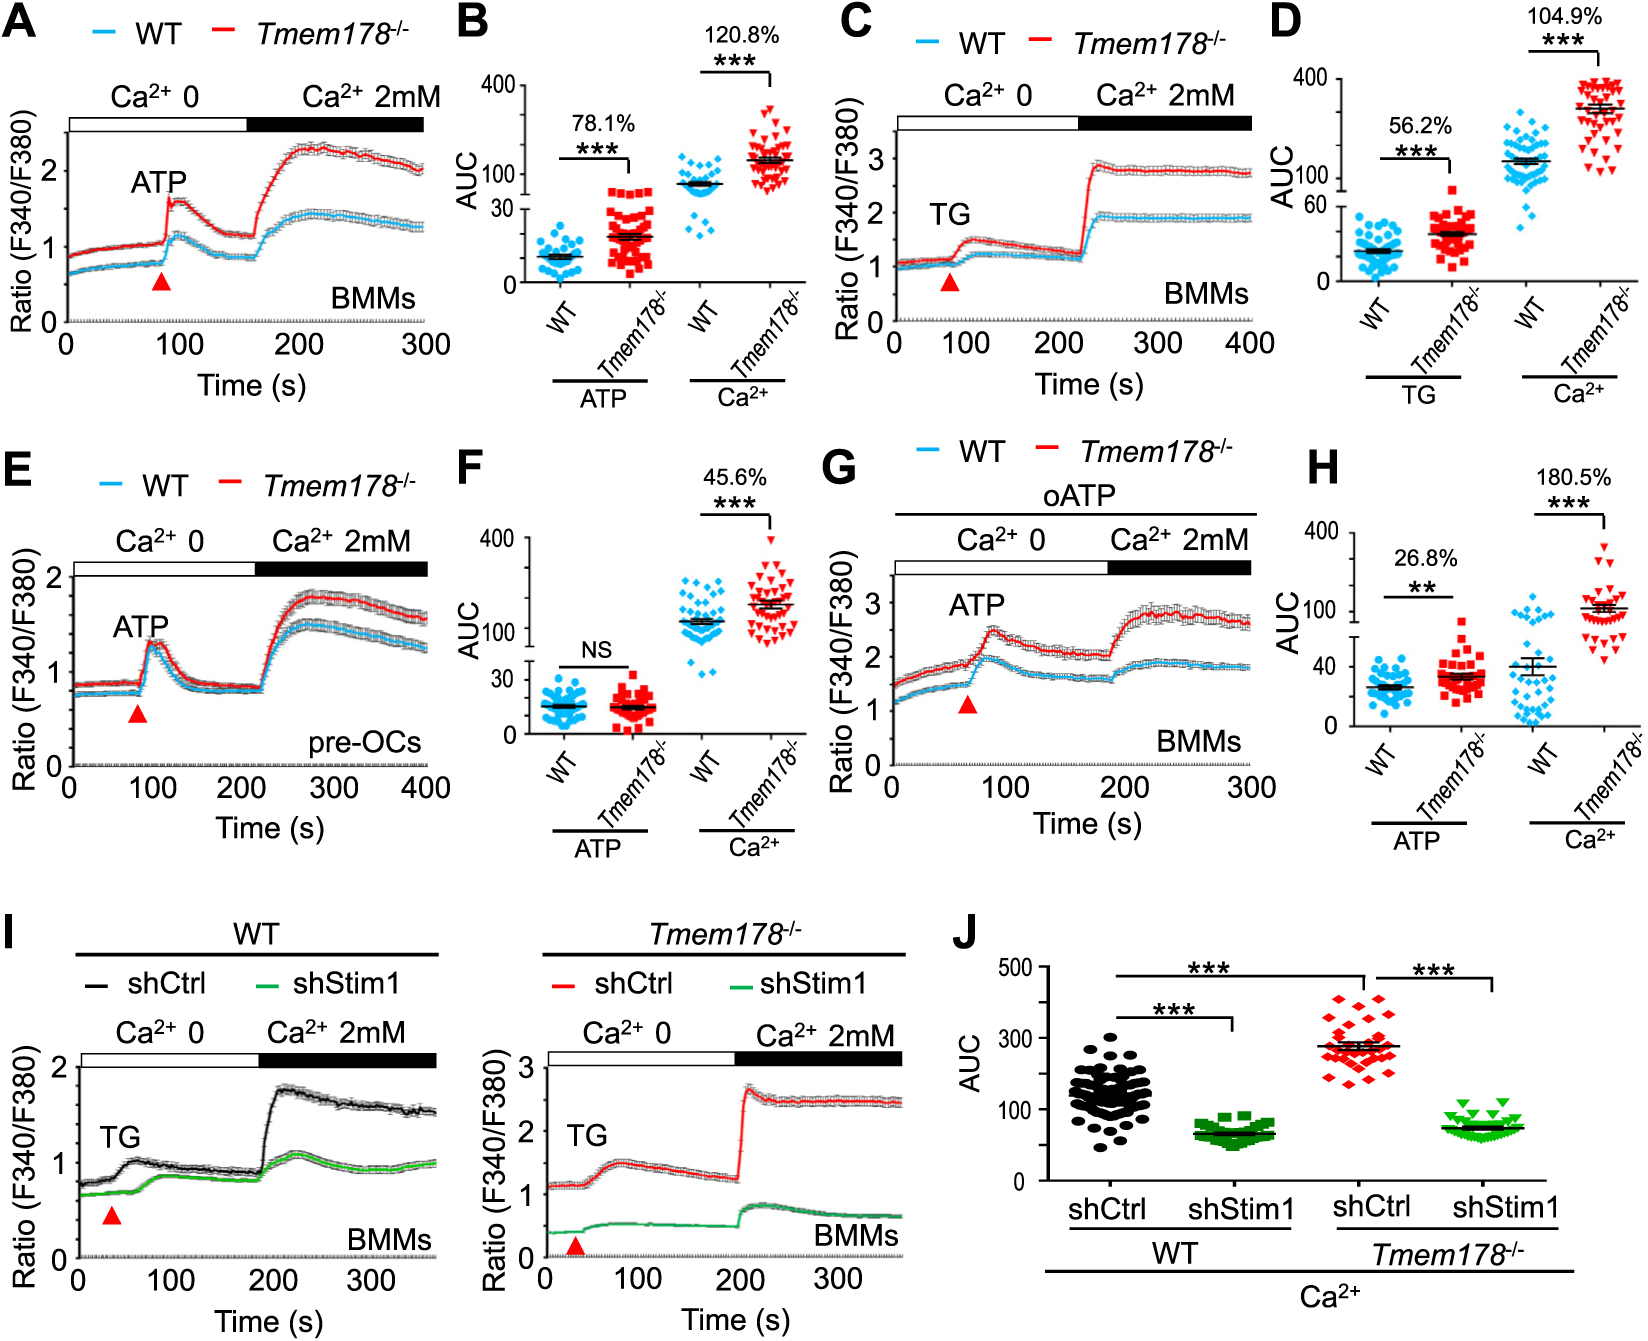
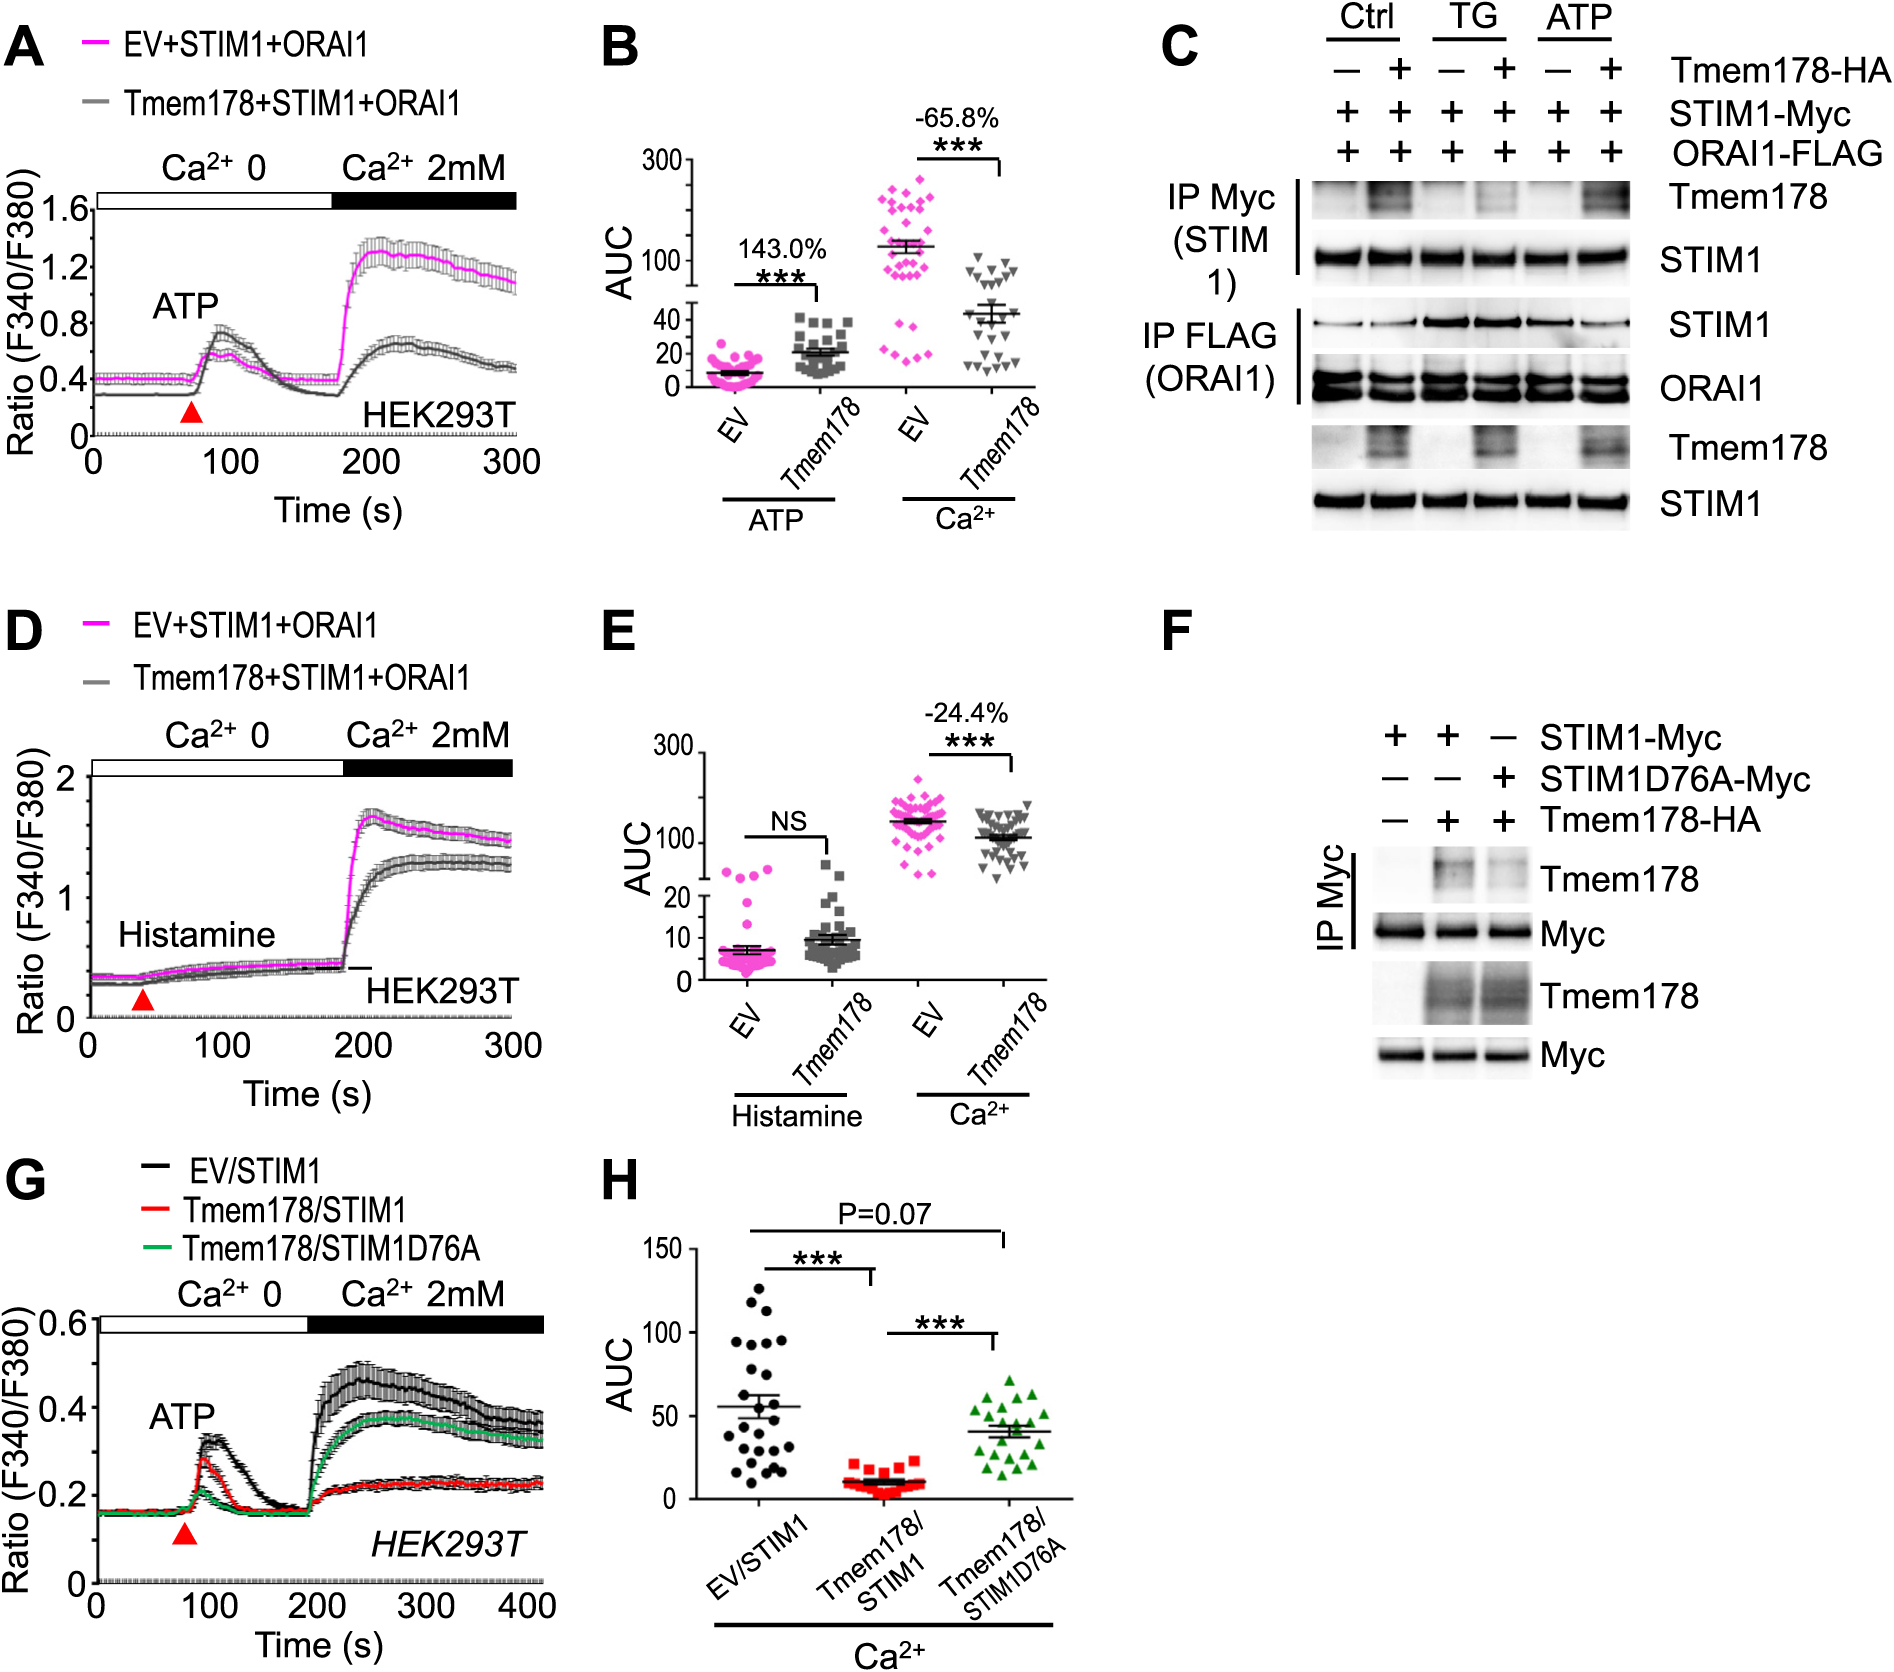
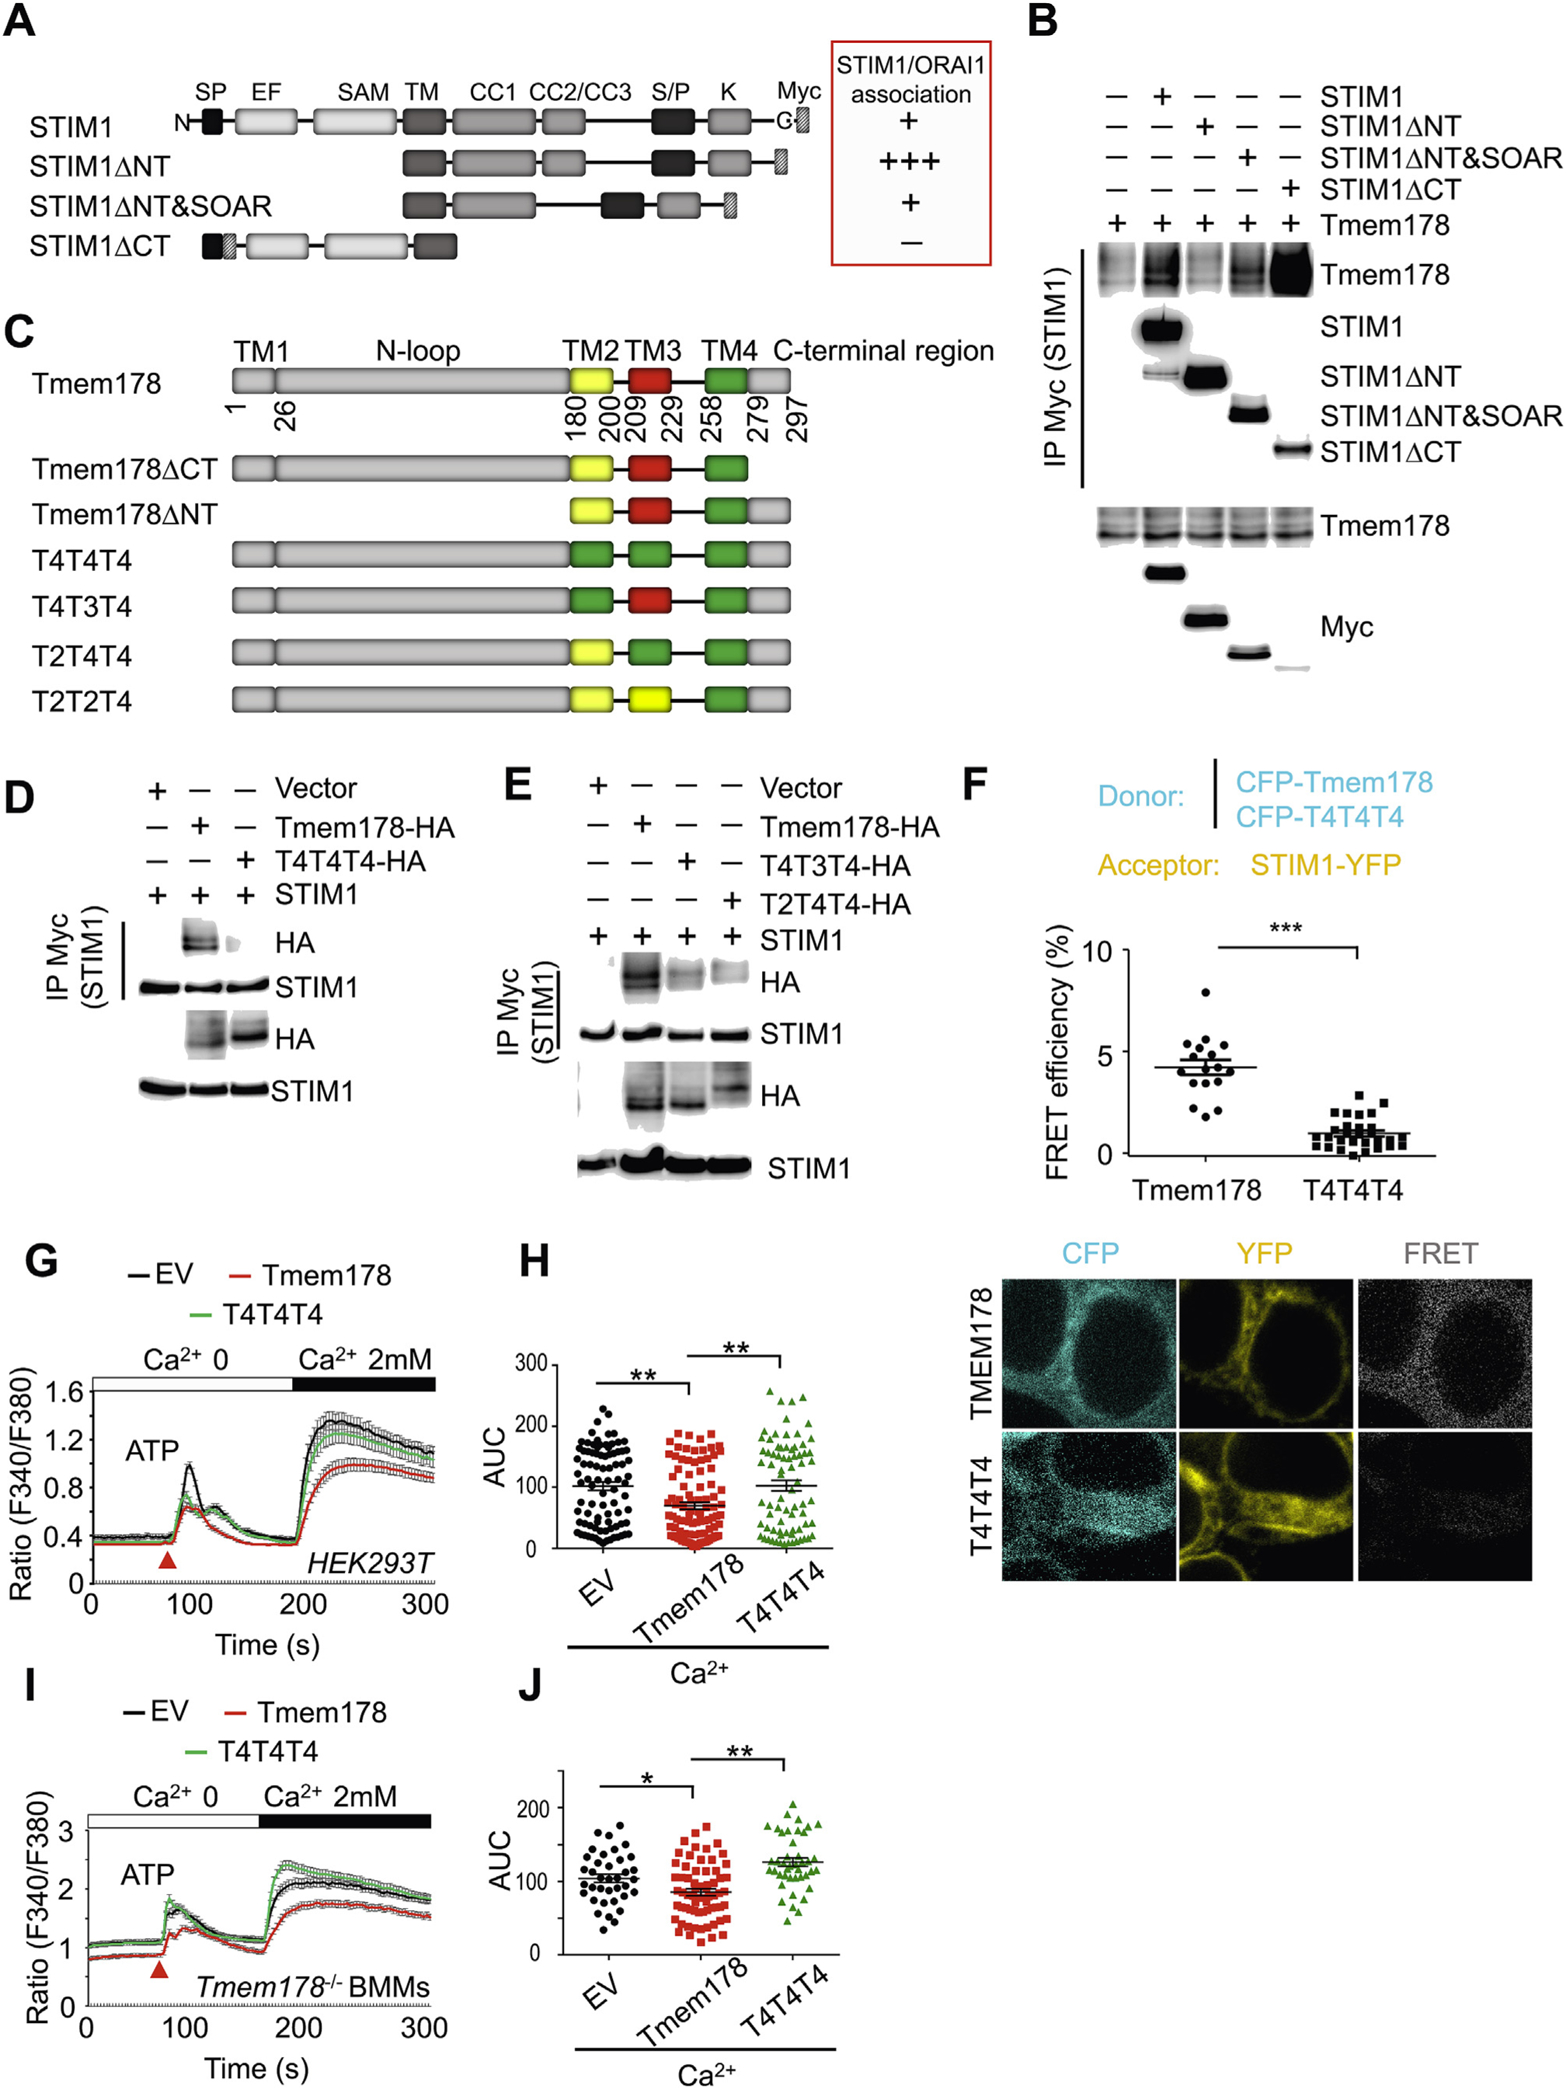
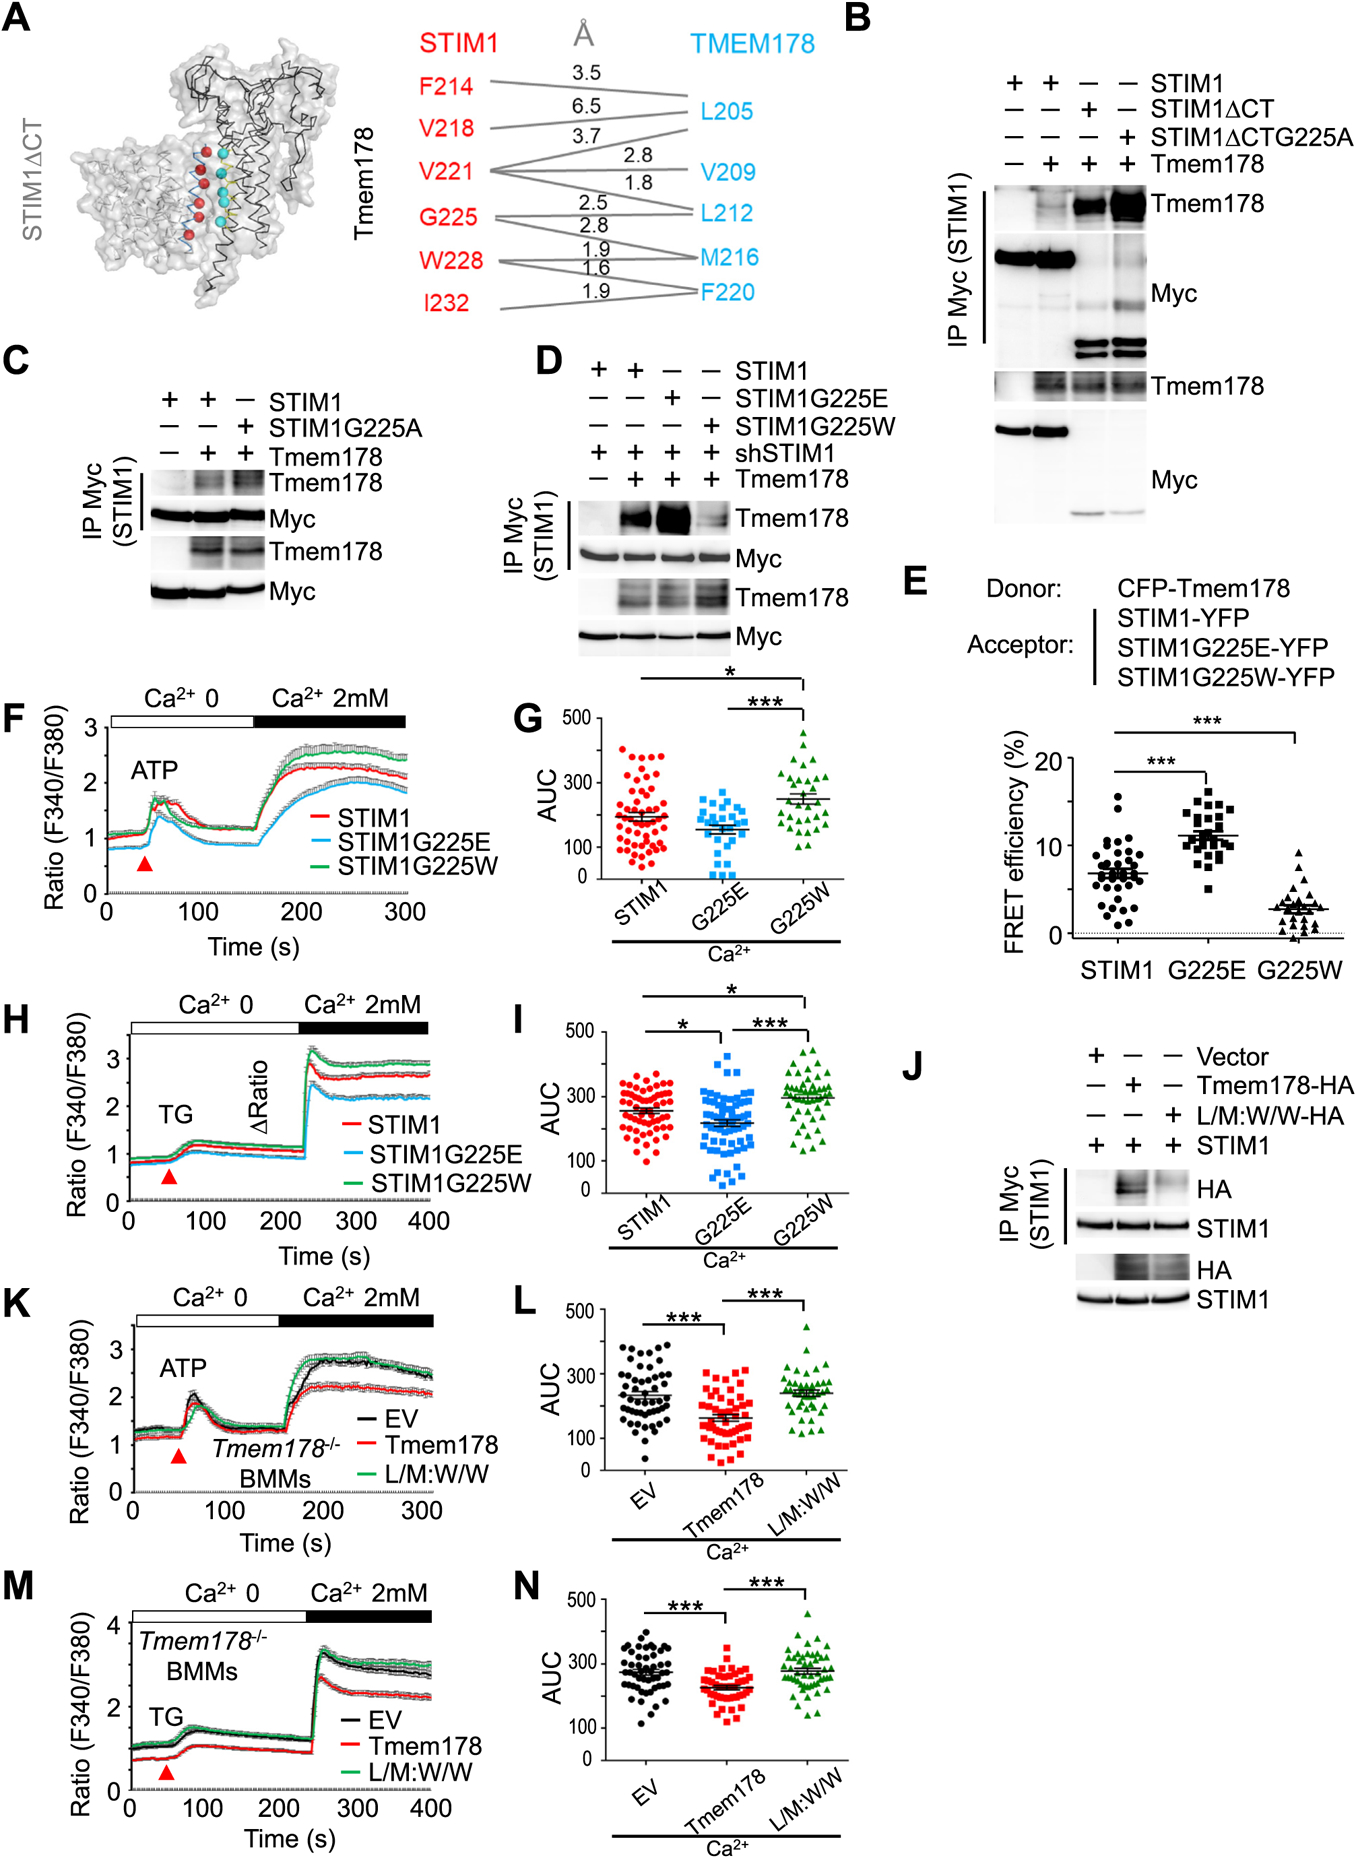
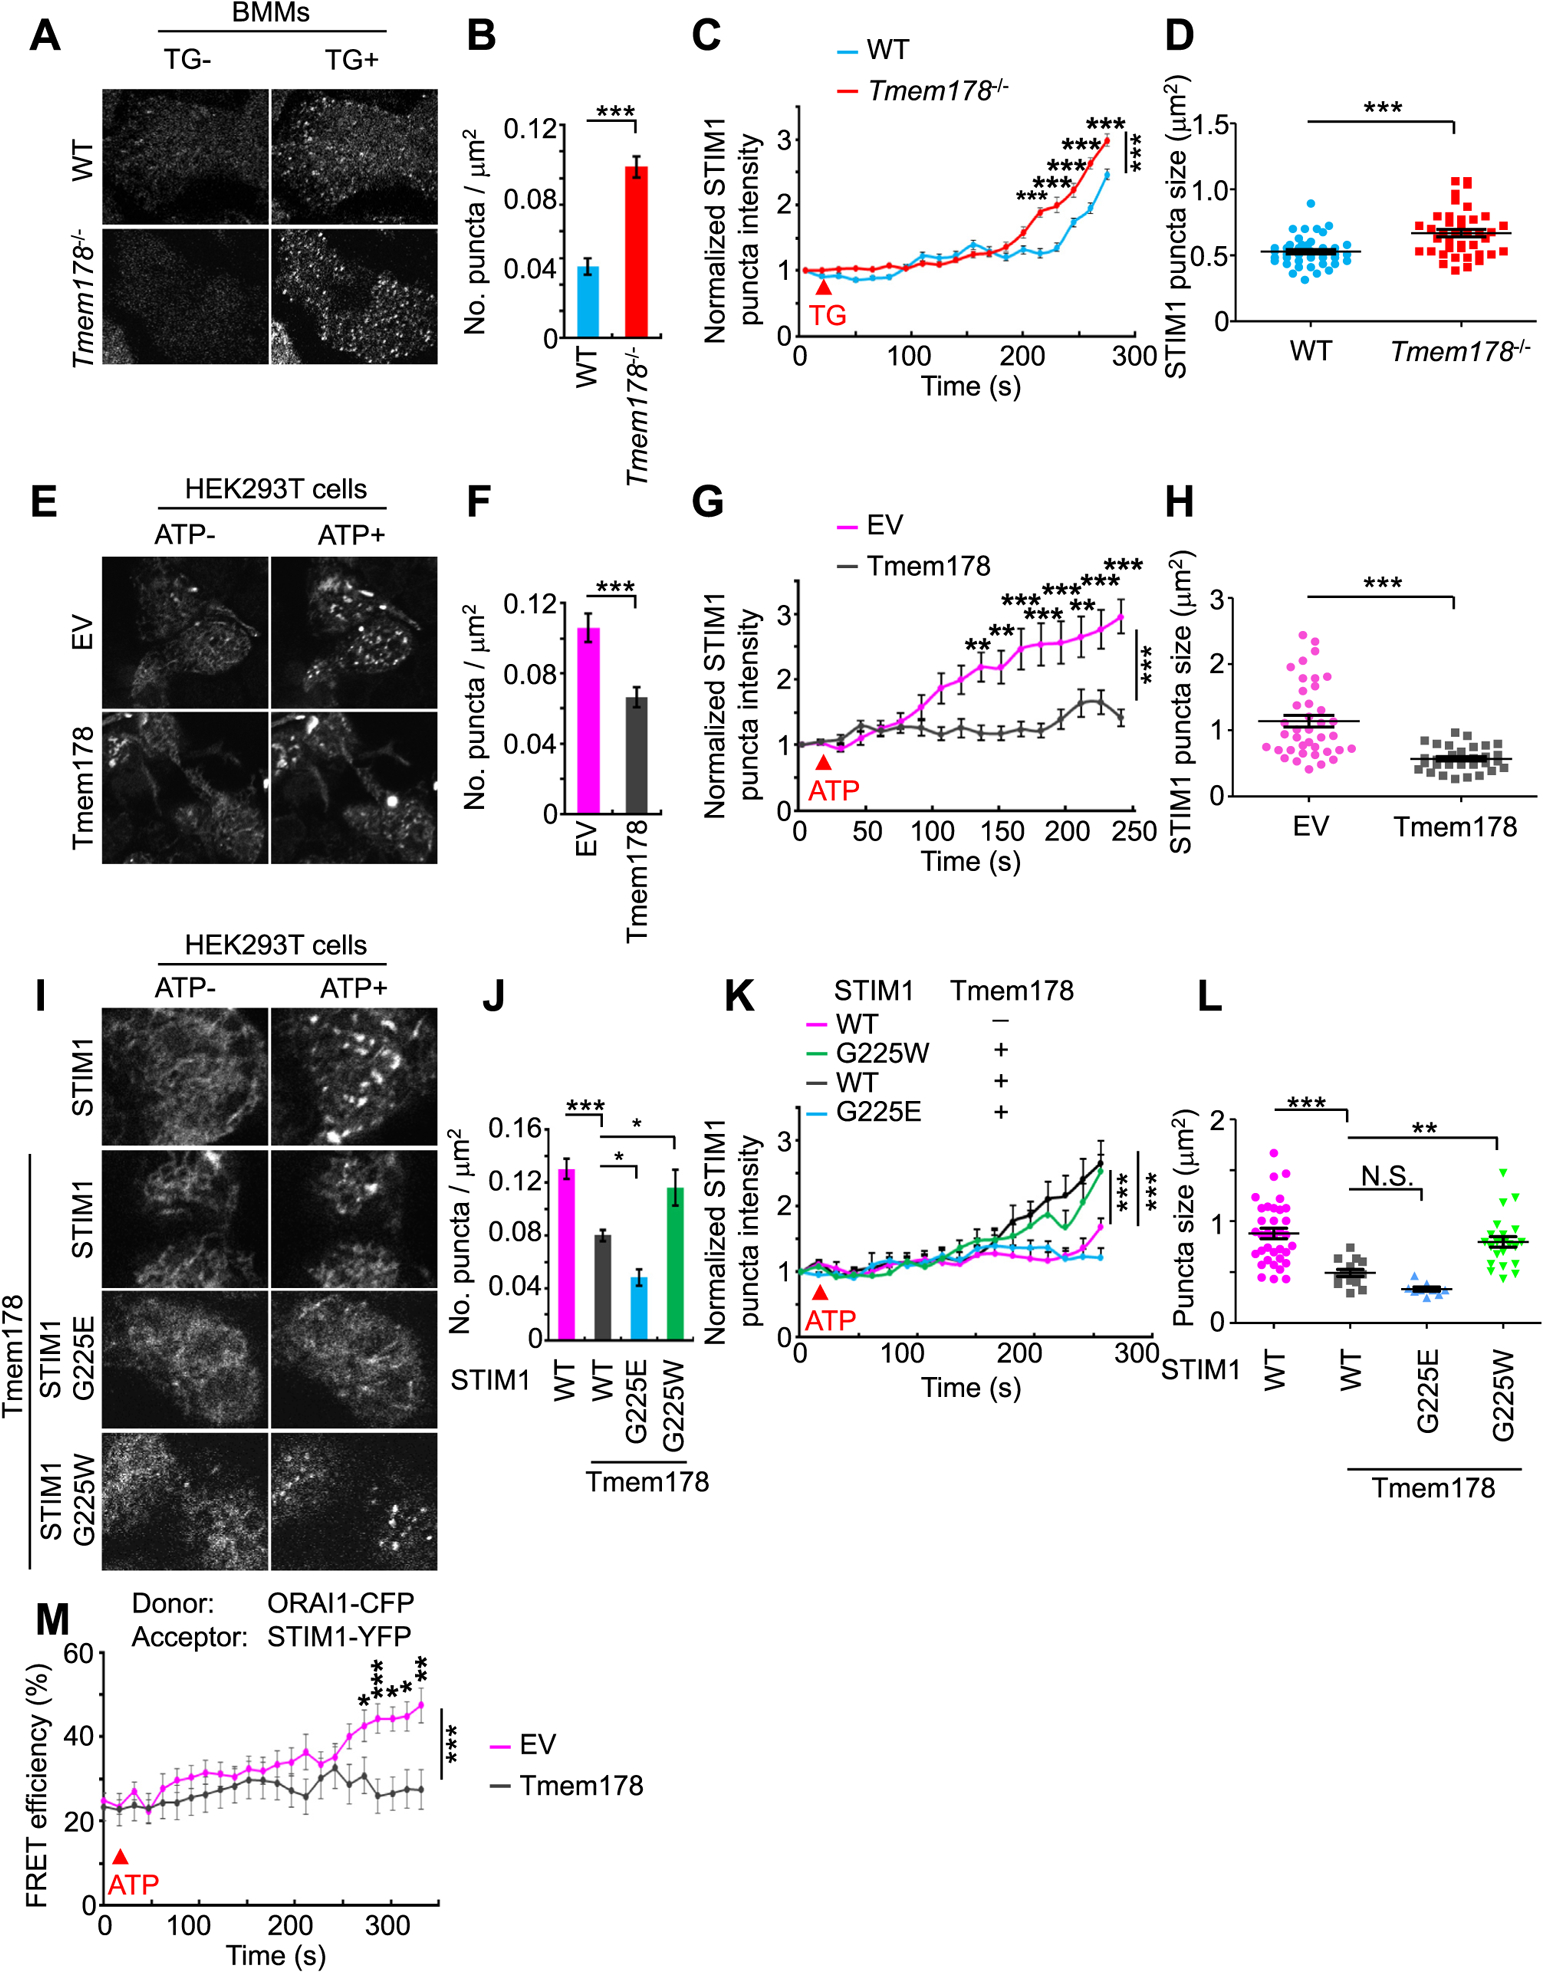
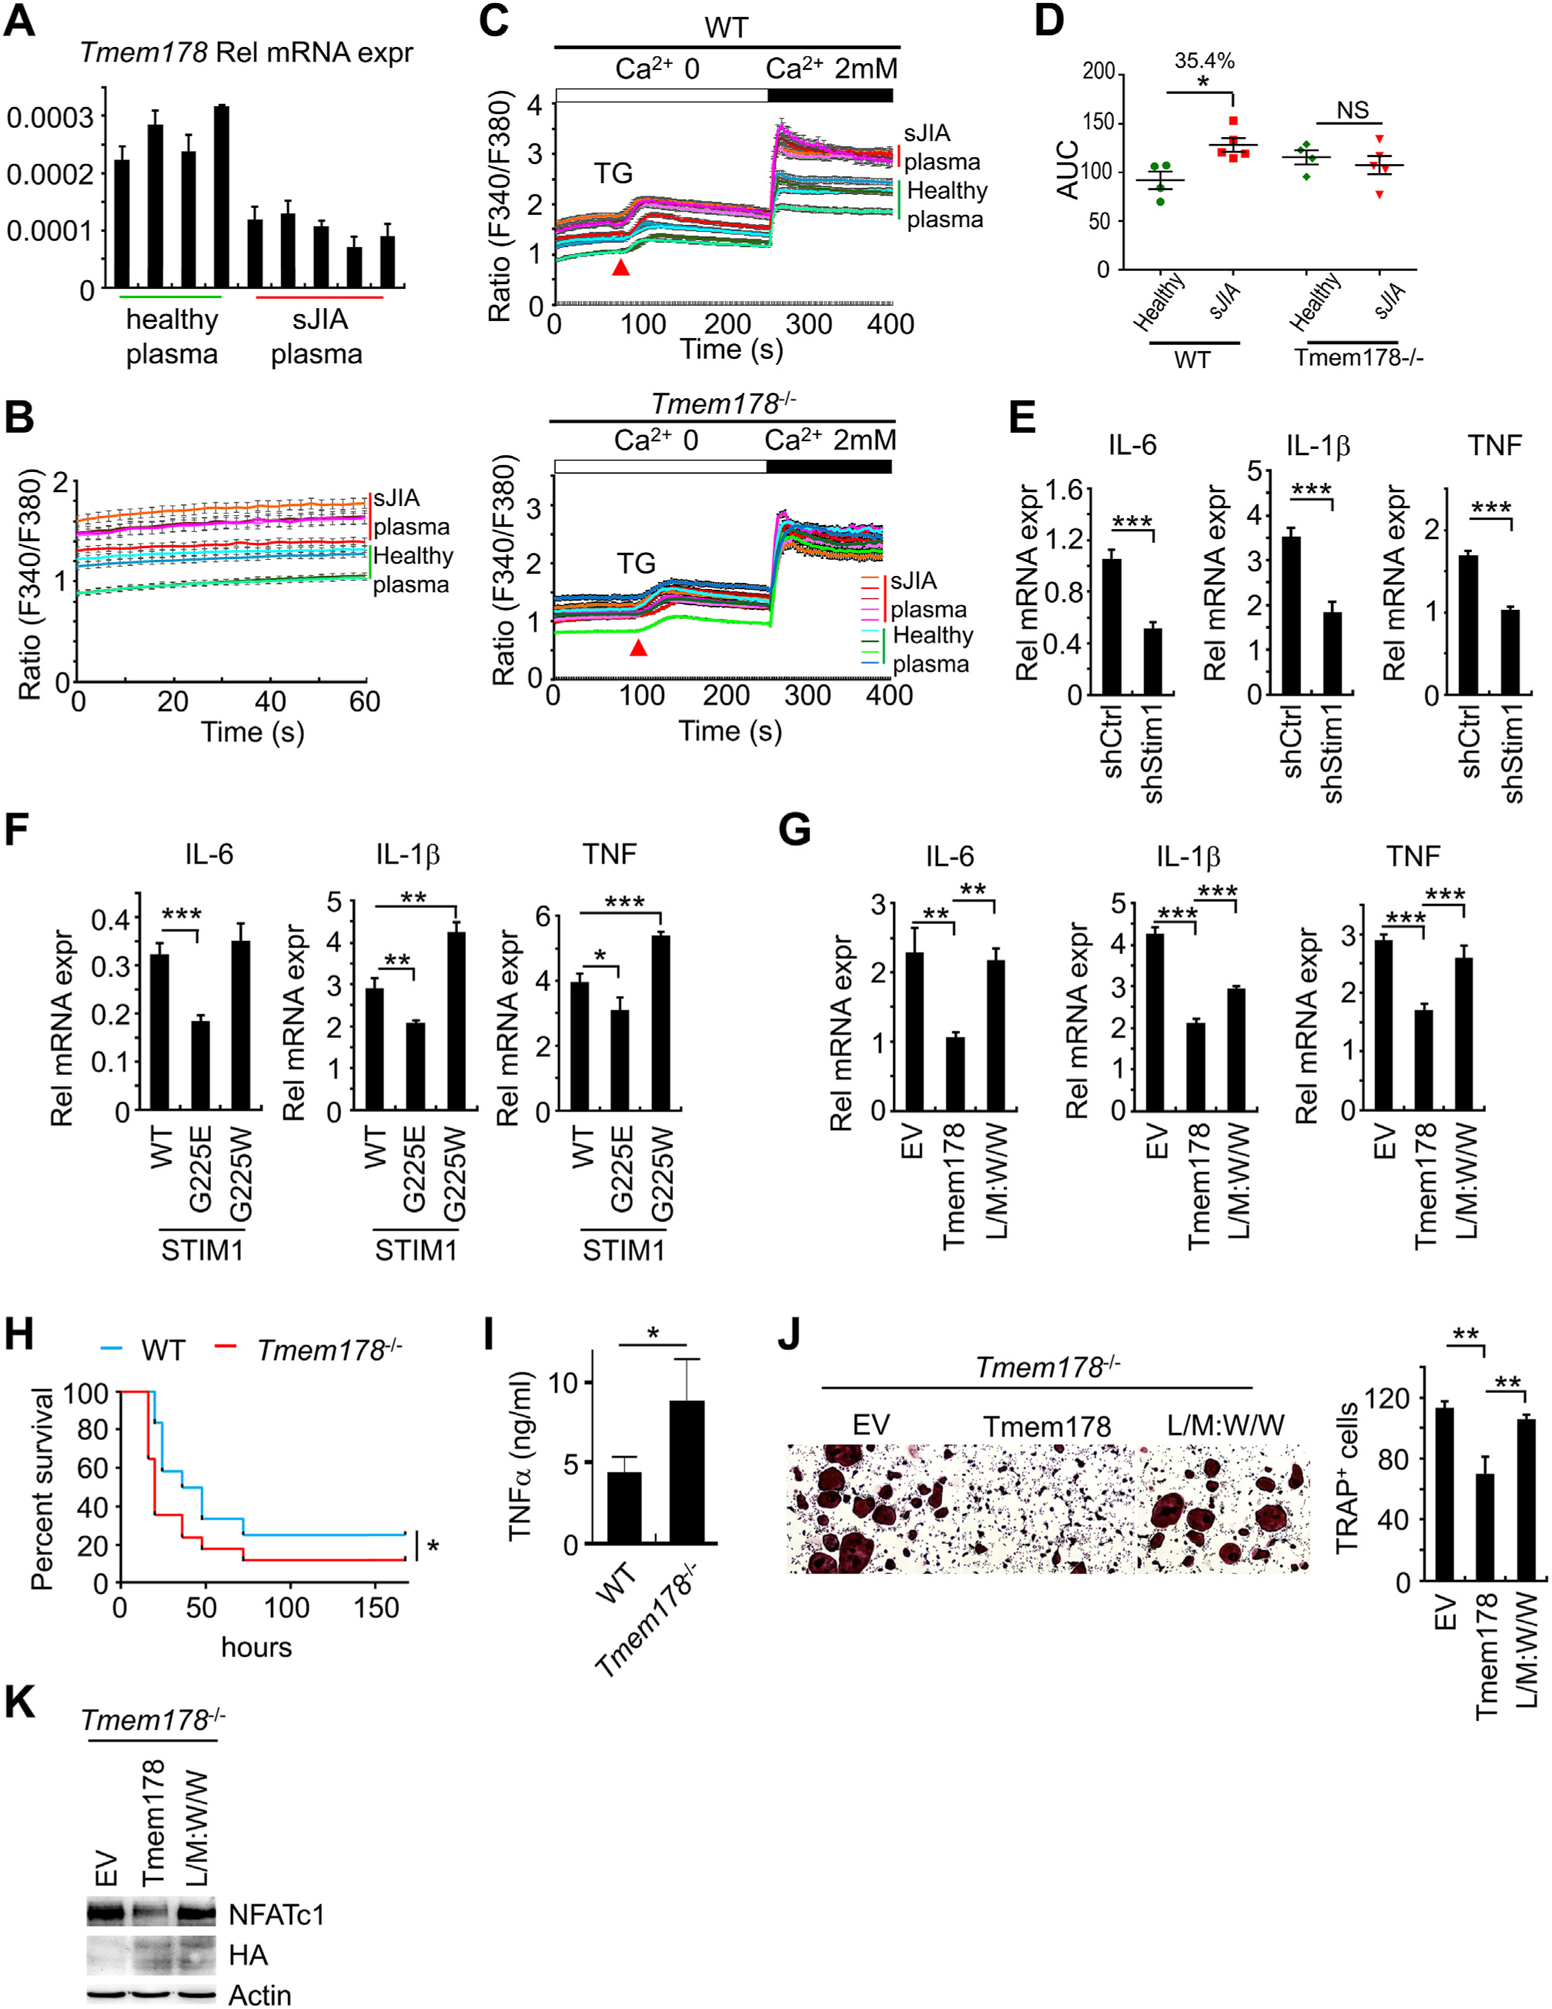
Store-operated calcium entry (SOCE) modulates cytosolic calcium in multiple cells. Endoplasmic reticulum (ER)-localized STIM1 and plasma membrane (PM)-localized ORAI1 are two main components of SOCE. STIM1:ORAI1 association requires STIM1 oligomerization, its re-distribution to ER-PM junctions, and puncta formation. However, little is known about the negative regulation of these steps to prevent calcium overload. Here, we identified Tmem178 as a negative modulator of STIM1 puncta formation in myeloid cells. Using site-directed mutagenesis, co-immunoprecipitation assays and FRET imaging, we determined that Tmem178:STIM1 association occurs via their transmembrane motifs. Mutants that increase Tmem178:STIM1 association reduce STIM1 puncta formation, SOCE activation, impair inflammatory cytokine production in macrophages and osteoclastogenesis. Mutants that reduce Tmem178:STIM1 association reverse these effects. Furthermore, exposure to plasma from arthritic patients decreases Tmem178 expression, enhances SOCE activation and cytoplasmic calcium. In conclusion, Tmem178 modulates the rate-limiting step of STIM1 puncta formation and therefore controls SOCE in inflammatory conditions.

Keywords: Macrophage activation; Osteoclastogenesis; SOCE; STIM1; Tmem178.


Conflict of interest statement

Declare of interests

The authors declare that they have no conflicts of interest with the contents of this article.

Figures

Fig. 1.
Fig. 1.
Tmem178 is a negative regulator of SOCE in macrophages and osteoclasts. (A–D) Calcium traces (A, C) and the quantification of the area under the curve (AUC) (B, D) in WT BMMs (n=38) and Tmem178−/− BMMs (n=51) treated with ATP (100 μM) or stimulated with TG (1 μM) followed by addition of 2mM calcium (WT, n=55; Tmem178−/−, n=48). Data shown are representative of 4–6 independent experiments. (E, F) Calcium fluxes and AUC in WT (n=43) and Tmem178−/− (n=52) pre-OCs stimulated with ATP and 2mM calcium. (G, H) Calcium fluxes and AUC in WT (n=44) and Tmem178−/− (n=37) pre-OCs pretreated with 100mM oATP and stimulated with ATP and 2mM calcium. (I, J) Calcium fluxes and AUC following stimulation with TG and 2mM calcium in WT BMMs (Left) or Tmem178−/− BMMs (Right) infected with shRNA control (WT, n=84; Tmem178−/−, n=45) or shRNA Stim1 (WT, n=37; Tmem178−/−, n=74). Data shown are representative of four independent experiments and indicated number of cells is from an individual experiment. Data are presented as mean ± SEM. NS, not significant; **P < 0.01, ***P < 0.001.
Fig. 2.
Fig. 2.
Tmem178: STIM1 association is dependent on ER-calcium content. (A, B) Calcium fluxes and the area under the curve (AUC) in HEK 293 T cells transfected with STIM1, ORAI1 and Tmem178 (n = 28) or empty vector (EV) (n = 37) and treated with ATP and 2 mM calcium. Data shown are representative of 5 independent experiments. (C) HEK293 cells expressing Tmem178-HA, STIM1-Myc and ORAI1-FLAG cultured in calcium-free medium and stimulated with 1 μMTG or 100 μM ATP for 5 min. Cell lysates were subjected to Co-IP with anti-Myc or anti-FLAG antibodies followed by western blotting to detect the association between STIM1 and Tmem178, or STIM1 and ORAI1. STIM1 and Tmem178 levels in total cell lysates are shown at the bottom. (D, E) Calcium fluxes and AUC following stimulation with histamine (100 μM) and addition of 2mM calcium in HEK 293 T cells transfected with STIM1, ORAI1 and Tmem178 (n = 47) or EV (n = 62). (F) Co-IPs showing association between the HA-tagged Tmem178 and STIM1D76A-myc in HEK293T cells. (G, H) ATP-induced calcium fluxes followed by addition of 2 mM extracellular calcium in HEK 293 T cells transfected with EV (n = 27) or full-length Tmem178 (n = 19), together with STIM1 and ORAI1; or full-length Tmem178 (n = 22), together with STIM1D76A and ORAI1. Calcium traces from indicated number of cells are from a represenative experiment. Data are presented as mean ± SEM. NS, not significant; ***P < 0.001.
Fig. 3.
Fig. 3.
STIM1 and Tmem178 associate via their transmembrane regions. (A) Schematic diagram of indicated STIM1 mutants. Based on published data, the binding of each STIM1 mutant with ORAI1 is shown in the red box as + + +, +, and − (from the strongest to the weakest). (B) Co-IP and Western blot showing association between Tmem178-HA and indicated Myc-tagged STIM1 mutants in HEK293T cells. (C) Schematic diagram ofTmem178 mutants. (D, E) Co-IPs followed by Western blot showing association between the HA-tagged Tmem178 mutants and STIM1-Myc in HEK293T cells. (F) Quantification of % FRET efficiency (top) and representative images (bottom) between STIM1-YFP and CFP- Tmem178 (n = 17), or STIM1-YFP and CFP-T4T4T4 (n = 29) in HEK293T cells. One of 3 independent experiments is shown. (G, H) Calcium traces and AUC in HEK 293 T cells expressing STIM1, ORAI1 and EV (n = 88), full-length Tmem178 (n = 98) or Tmem178- T4T4T4 mutant (n = 82) stimulated with ATP and 2 mM calcium. (I, J) Calcium traces and AUC in Tmem178−/− BMMs infected with EV (n = 37), full-length Tmem178 (n = 70) or Tmem178-T4T4T4 mutant (n = 42) stimulated with ATP and 2mM calcium. Calcium traces from indicated number of cells are from a representative experiment. Data are shown as mean ± SEM. *P < 0.05, **P < 0.01, ***P < 0.001. (For interpretation of the references to colour in this figure legend, the reader is referred to the Web version of this article.)
Fig. 4.
Fig. 4.
STIM1 G225 modulates the interaction with L212 and M216 in Tmem178. (A) Molecular modeling and docking of STIM1ACT and full length Tmem178 with predicted amino acids involved in the association. (B-D) Co-IP and Western blot showing association between Myc-tagged STIM1 or indicated mutants and Tmem178-HA in HEK293T cells. (E) Quantification of % of FRET efficiency signals between CFP-Tmem178 and STIM1-YFP (n = 17), STIM1G225E -YFP (n = 12), or STIM1G225W- YFP (n = 12) in HEK293T cells. (F, G) ATP-induced calcium fluxes in shRNA-Stim1 infected BMMs expressing either wild type STIM1 (n = 54), STIM1G225E (n = 29) or STIM1G225W (n = 32). (H, I) TG-induced calcium fluxes in shRNA-Stim1 infected BMMs expressing either wild type STIM1 (n = 62), STIM1G225E (n = 70) or STIM1G225W (n = 49). (J) Co-IP and Western blot showing association between Myc-tagged STIM1 and HA-tagged Tmem178 or the Tmem178 double mutant L212W&M216W. (M, N) Calcium fluxes in ATP- or TG-stimulated Tmem178−/− BMMs infected with EV, Tmem178, or Tmem178 L/M:W/ W mutant. An average of 50 cells per condition were analyzed. Data are shown as mean ± SEM. One way ANOVA was used in (E). *P < 0.05, ***P < 0.001. Data shown are representative of 3–4 independent experiments. Calcium traces from indicated number of cells are from a representative experiment.
Fig. 5.
Fig. 5.
Tmem178 binding to STIM1 limits STIM1 puncta formation and the association with ORAI1. (A) Representative images of STIM1 puncta in WT (Top, n=43) and Tmem178−/− BMMs (Bottom, n=42) transduced with STIM1-YFP. Images were acquired before and after TG stimulation. (B–D) Quantification of the number of puncta per μm2, puncta intensity (normalized to baseline signal intensity) and puncta size. (E) Representative images of STIM1 puncta formation in HEK293T cells co-transfected with STIM1-YFP and empty vector EV (Top, n=39) or Tmem178 (Bottom, n=33) before and after ATP stimulation. (F - H) Data are quantified as in (B–D). (I) Representative images of STIM1 puncta formation following ATP stimulation in shRNA STIM1 HEK293T cells expressing STIM1-YFP alone (n=33), or CFP-Tmem178 together with STIM1-YFP (n=14), STIM1G225E-YFP (n=9), or STIM1G225W-YFP (n=21). (J–L) Data are quantified as in (B–D). (M) Time course showing ATP-induced % FRET efficiency signals in HEK293T cells between ORAI1-CFP and STIM1-CFP in the presence of Tmem178 (pink, n=25) or EV (gray, n=21). One out of 3 independent experiments is shown. Data are represented as mean ± SEM. Student’s t-test was performed in B, D, F and H. One way ANOVA was performed in J and L. Two way ANOVA was performed in C, G, K and M. *P < 0.05, **P < 0.01, ***P < 0.001. (For interpretation of the references to colour in this figure legend, the reader is referred to the Web version of this article.)
Fig. 6.
Fig. 6.
The association between Tmem178 and STIM1 restrains macrophage activation and osteoclastogenesis. (A) Tmem178 mRNA levels in macrophages exposed to 10% healthy plasma or sJIA plasma for 24 h. (B-D) Calcium traces and area under the curve (AUC) in macrophages treated with 10% healthy plasma (N = 4) or sJIA plasma (N = 5) for 24 h in basal conditions (B) or following stimulation with TG and 2 mM calcium in WT (top) or Tmem178−/− (bottom) BMMs (traces from 50 to 70 cells per experiment are shown) (C, D). (E) mRNA levels of inflammatory cytokines in shCtrl or shRNA-Stim1 BMMs stimulated with 100 ng/ml LPS for 4h. (F) RT- PCR as in (E) in shRNA Stim1 BMMs expressing wild type STIM1, STIM1G225E or STIM1G225W. (G) RT-PCR as in (E) in Tmem178−/− BMMs expressing EV, wild type Tmem178 or L/M: W/W mutant. (H) WT (blue line, n = 12) or Tmem178−/− (red line, n = 17) mice were injected (i.p.) with 25 mg/kg LPS. The Kaplan-Meier survival analysis was performed, and Log-rank test was used to determine the statistical significance. (I) Serum of WT or Tmem178−/− mice were collected after 2 h challenge with LPS. TNFa levels were measured by ELISA. (J) Representative images (Left) and quantification (Right) of TRAP stained Tmem178−/− osteoclasts expressing wild type Tmem178 or L/M: W/W mutant. (K) Western blot for NFATc1 in Tmem178−/− pre-OCs expressing HA-tagged Tmem178 or L/M: W/W mutant. Actin and HA western blots are used as loading controls. In B - D, data are represented as mean ± SEM, in all other panels as mean ± SD. Student’s t-test was performed in E and I. One way ANOVA was performed in F, G and J. *P < 0.05_, **P < 0.01, ***P < 0.001. (For interpretation of the references to colour in this figure legend, the reader is referred to the Web version of this article.)

Similar articles

Cited by

References

    1. Berridge MJ, Bootman MD, Roderick HL, Calcium signalling: dynamics, homeostasis and remodelling, Nat. Rev. Mol. Cell Biol 4 (2003) 517–529. - PubMed
    1. Soboloff J, Rothberg BS, Madesh M, Gill DL, STIM proteins: dynamic calcium signal transducers, Nat. Rev. Mol. Cell Biol 13 (2012) 549–565. - PMC - PubMed
    1. Berridge MJ, The inositol trisphosphate/calcium signaling pathway in health and disease, Physiol. Rev 96 (2016) 1261–1296. - PubMed
    1. Feske S, Calcium signalling in lymphocyte activation and disease, Nat. Rev. Immunol 7 (2007) 690–702. - PubMed
    1. Lacruz RS, Feske S, Diseases caused by mutations in ORAI1 and STIM1, Ann. N. Y. Acad. Sci 1356 (2015) 45–79. - PMC - PubMed

Publication types

MeSH terms