

Genome-Wide Analyses Reveal Footprints of Divergent Selection and Drought Adaptive Traits in Synthetic-Derived Wheats
- PMID: 31018942
- PMCID: PMC6553533
- DOI: 10.1534/g3.119.400010
Genome-Wide Analyses Reveal Footprints of Divergent Selection and Drought Adaptive Traits in Synthetic-Derived Wheats
Abstract
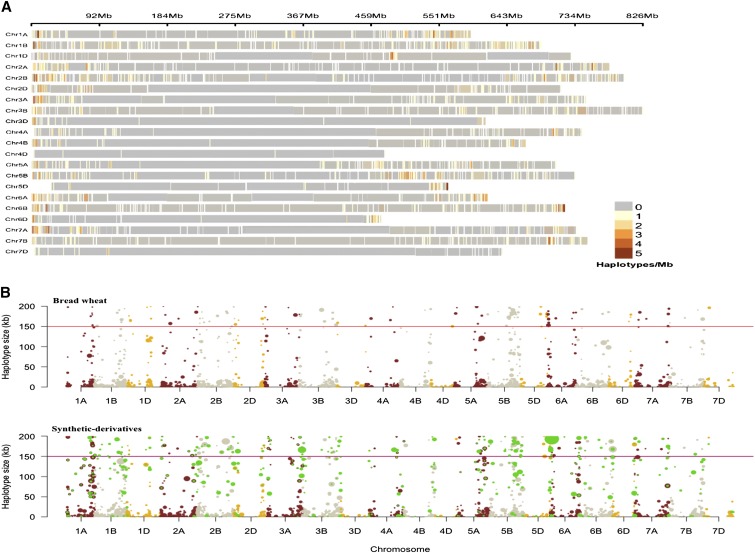
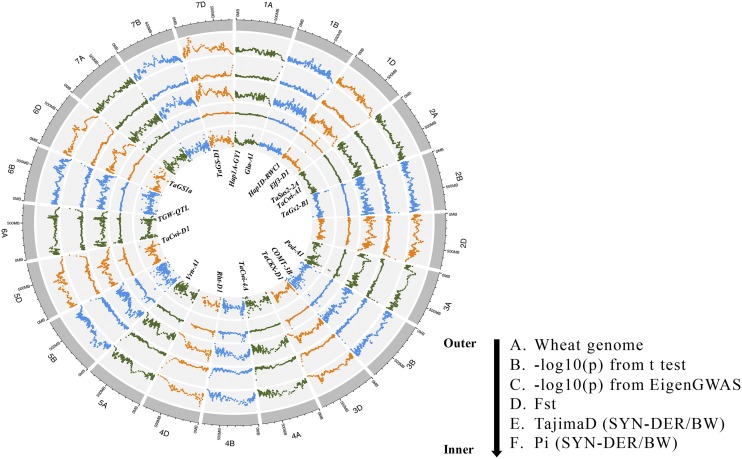
Crop-wild introgressions have long been exploited without knowing the favorable recombination points. Synthetic hexaploid wheats are one of the most exploited genetic resources for bread wheat improvement. However, despite some QTL with major effects, much less is known about genome-wide patterns of introgressions and their effects on phenotypes. We used two genome-wide association approaches: SNP-GWAS and haplotype-GWAS to identify SNPs and haplotypes associated with productivity under water-limited conditions in a synthetic-derived wheat (SYN-DER) population. Haplotype-GWAS further enriched and identified 20 more genomic regions associated with drought adaptability that did not overlap with SNP-GWAS. Since GWAS is biased to the phenotypes in the study and may fail to detect important genetic diversity during breeding, we used five complementary analytical approaches (t-test, Tajima's D, nucleotide diversity (π), Fst, and EigenGWAS) to identify divergent selections in SYN-DER compared to modern bread wheat. These approaches consistently pinpointed 89 'selective sweeps', out of which 30 selection loci were identified on D-genome. These key selections co-localized with important functional genes of adaptive traits such as TaElf3-D1 (1D) for earliness per se (Eps), TaCKX-D1 (3D), TaGS1a (6D) and TaGS-D1 (7D) for grain size, weight and morphology, TaCwi-D1 (5D) influencing drought tolerance, and Vrn-D3 (7D) for vernalization. Furthermore, 55 SNPs and 23 haplotypes of agronomic and physiological importance such as grain yield, relative water content and thousand grain weight in SYN-DER, were among the top 5% of divergent selections contributed by synthetic hexaploid wheats. These divergent selections associated with improved agronomic performance carry new alleles that have been introduced to wheat. Our results demonstrated that GWAS and selection sweep analyses are powerful approaches for investigating favorable introgressions under strong selection pressure and the use of crop-wild hybridization to assist the improvement of wheat yield and productivity under moisture limiting environments.
Keywords: genome-wide association studies (GWAS); haplotype analysis; selective sweeps; single nucleotide polymorphisms (SNPs); synthetic-derived wheats (SYN-DER).
Copyright © 2019 Afzal et al.
Figures


References
-
- Acuña-Galindo M. A., Mason R. E., Subrahmanyam N. K., Hays D., 2015. Meta-analysis of wheat QTL regions associated with adaptation to drought and heat stress. Crop Sci. 55: 477–492. 10.2135/cropsci2013.11.0793 - DOI
-
- Afzal F., Reddy B., Gul A., Khalid M., Subhani A., et al. , 2017. Physiological, biochemical and agronomic traits associated with drought tolerance in a synthetic-derived wheat diversity panel. Crop Pasture Sci. 68: 213–224. 10.1071/CP16367 - DOI
-
- Arjenaki F. G., Jabbaril R., Morshedi A., 2012. Evaluation of drought stress on relative water content, chlorophyll content and mineral elements of wheat (Triticum aestivum L.) varieties. International Journal of Agriculture and Crop Sciences 4: 726–729.
Publication types
MeSH terms
LinkOut - more resources
Full Text Sources
Molecular Biology Databases
Research Materials
Miscellaneous