. 2019 Jun 7;294(23):9048-9063.
doi: 10.1074/jbc.RA118.006814. Epub 2019 Apr 24.

Bioinformatic and mutational studies of related toxin-antitoxin pairs in Mycobacterium tuberculosis predict and identify key functional residues

Affiliations

Bioinformatic and mutational studies of related toxin-antitoxin pairs in Mycobacterium tuberculosis predict and identify key functional residues

Himani Tandon et al. J Biol Chem. .

Abstract

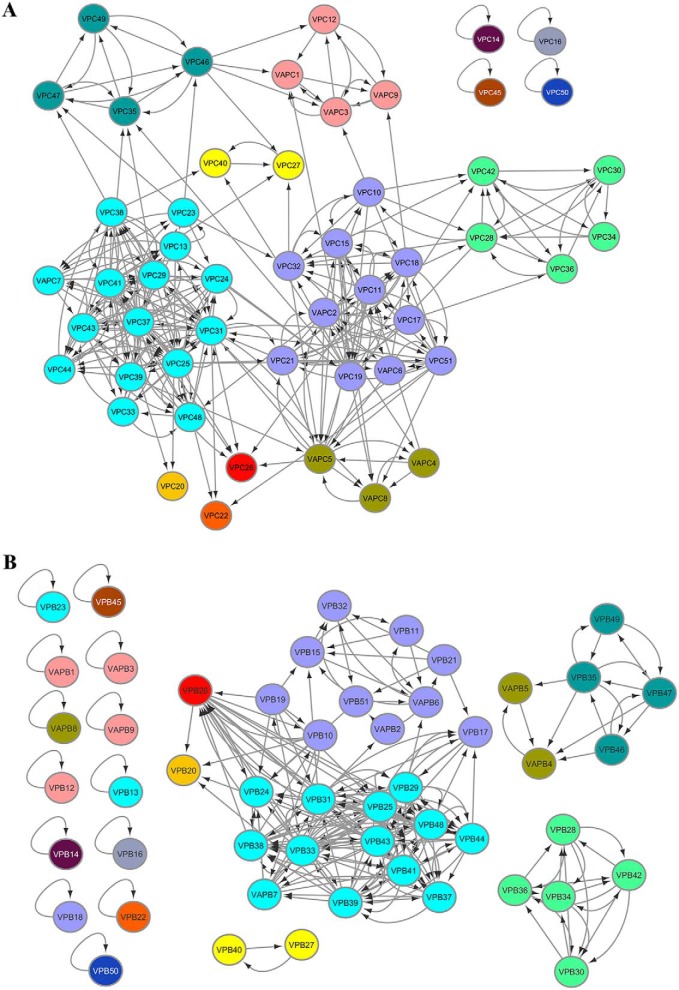
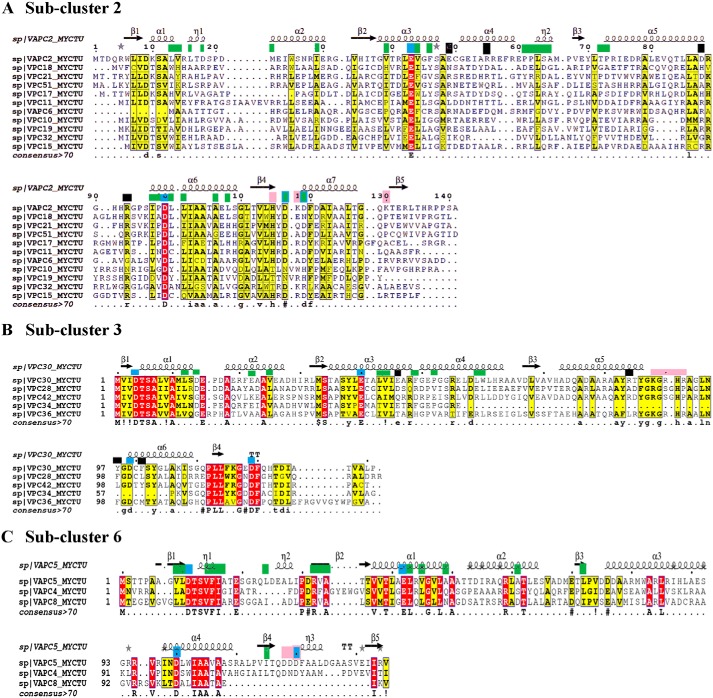
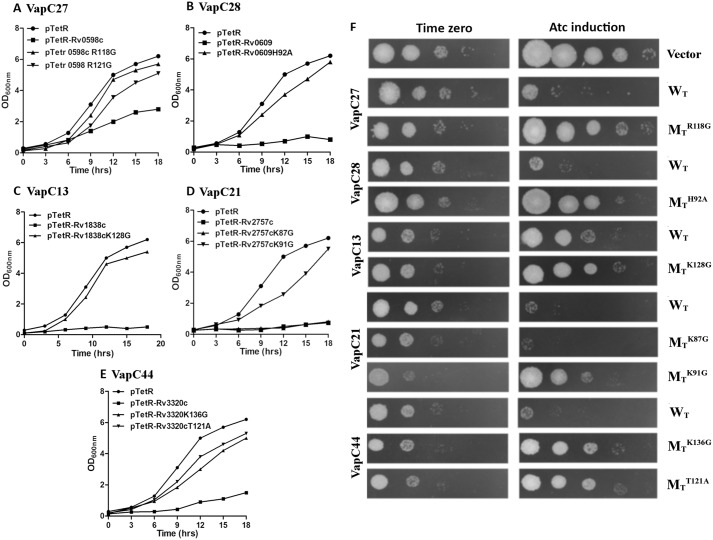
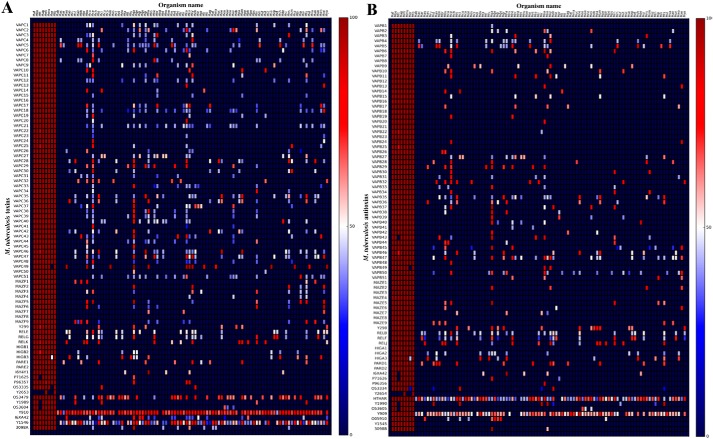
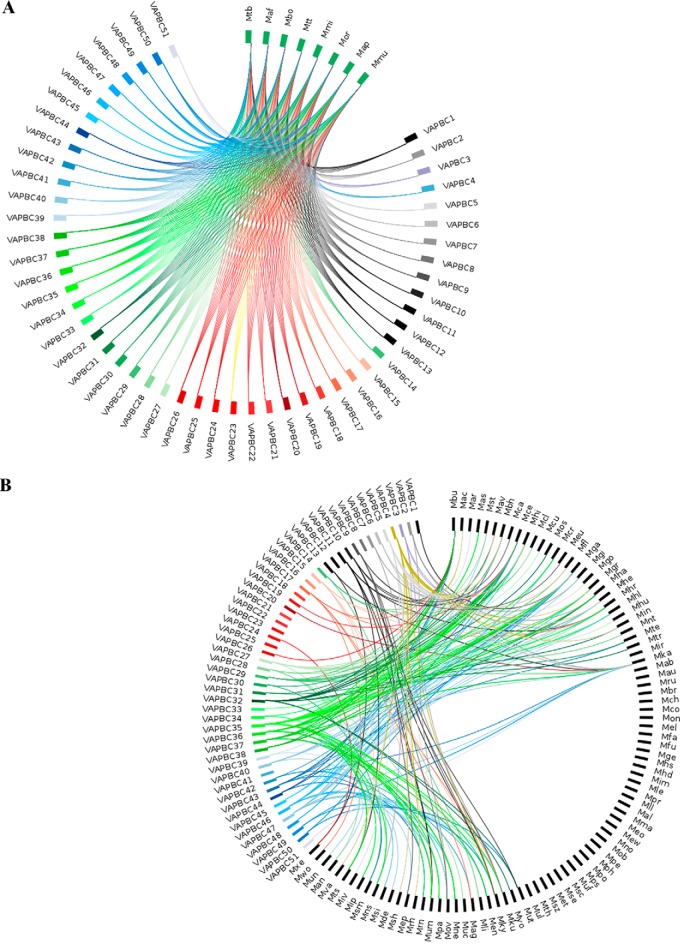
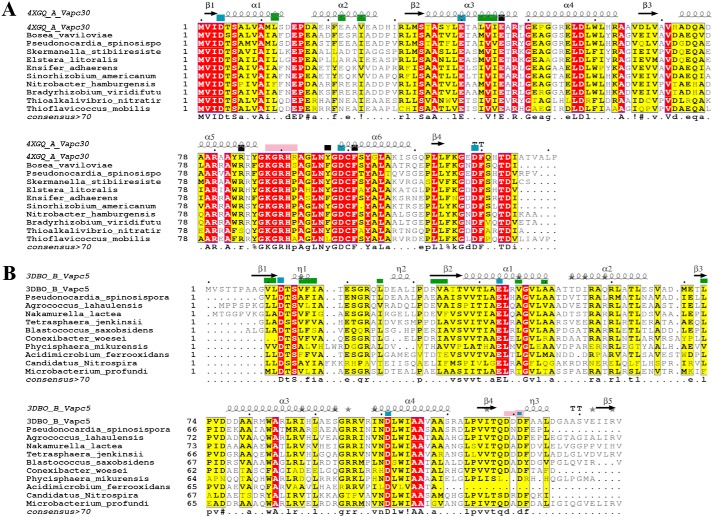
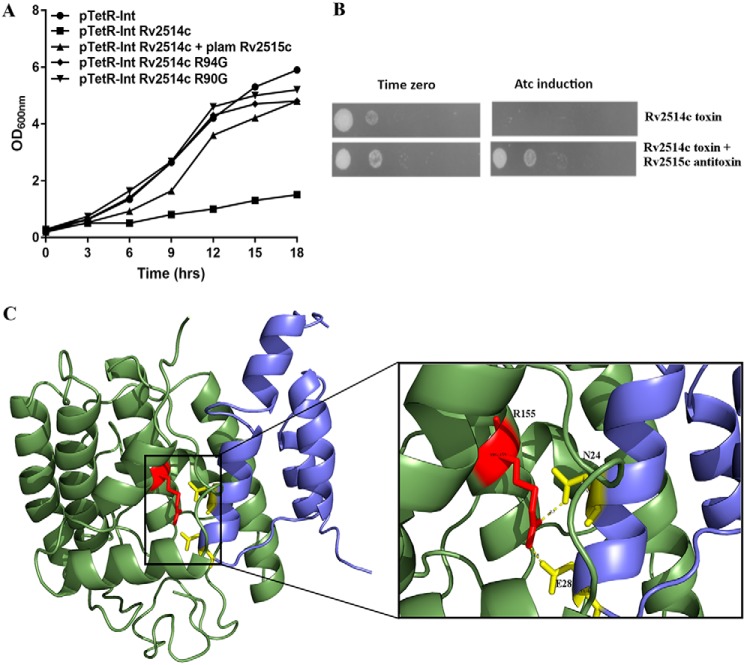
Mycobacterium tuberculosis possesses an unusually large representation of type II toxin-antitoxin (TA) systems, whose functions and targets are mostly unknown. To better understand the basis of their unique expansion and to probe putative functional similarities among these systems, here we computationally and experimentally investigated their sequence relationships. Bioinformatic and phylogenetic investigations revealed that 51 sequences of the VapBC toxin family group into paralogous sub-clusters. On the basis of conserved sequence fingerprints within paralogues, we predicted functional residues and residues at the putative TA interface that are useful to evaluate TA interactions. Substitution of these likely functional residues abolished the toxin's growth-inhibitory activity. Furthermore, conducting similarity searches in 101 mycobacterial and ∼4500 other prokaryotic genomes, we assessed the relative conservation of the M. tuberculosis TA systems and found that most TA orthologues are well-conserved among the members of the M. tuberculosis complex, which cause tuberculosis in animal hosts. We found that soil-inhabiting, free-living Actinobacteria also harbor as many as 12 TA pairs. Finally, we identified five novel putative TA modules in M. tuberculosis. For one of them, we demonstrate that overexpression of the putative toxin, Rv2514c, induces bacteriostasis and that co-expression of the cognate antitoxin Rv2515c restores bacterial growth. Taken together, our findings reveal that toxin sequences are more closely related than antitoxin sequences in M. tuberculosis Furthermore, the identification of additional TA systems reported here expands the known repertoire of TA systems in M. tuberculosis.

Keywords: Mycobacterium tuberculosis; VapBC; bioinformatics; genome analysis; homology; molecular modeling; pathogenesis; phylogenetics; protein evolution; protein sequence; structure–function; toxin–antitoxin.


Conflict of interest statement

The authors declare that they have no conflicts of interest with the contents of this article.

Figures

Figure 1.
Figure 1.
VapBC toxins and antitoxins cluster distinctly. Clusters of VapC toxins (A) and VapB antitoxins (B) were derived using HIFIX, at 20% sequence identity and 60% query coverage. Cluster criteria were set after employing several identity and alignment thresholds on the VapC toxin alignments, to resolve the data into sub-clusters (Fig. S2). Each sub-cluster is indicated in a separate color. VapCs or VapBs within the same sub-cluster share at least 20% sequence identity. The antitoxin sub-clusters in B are color-coded based on the toxin clusters.
Figure 2.
Figure 2.
Multiple sequence alignments of VapC toxins from sub-clusters 2, 3, and 6 with representative structural templates are shown in A and C. The columns shaded dark red show conserved residues, and the columns shaded yellow show conservatively-substituted residues. Consensus sequence (at a threshold of >70%) for each sub-cluster alignment is shown at the bottom of the alignment. Green boxes at the top of the alignment point to antitoxin-binding residues. Blue boxes show the conserved acidic residues of the PIN domain. Black boxes point to residues that confer structural stability in the reference structures. Pink boxes at the top of the alignment are the substrate-binding residues in the reference structures. Secondary structure elements of the relevant reference structures are depicted at the top of the alignment.
Figure 3.
Figure 3.
Effect of overexpression of WT and mutant proteins on the growth of M. smegmatis. A–E, recombinant strains were grown to an OD600 nm of 0.2, and the expression of toxins was induced by the addition of 50 ng/ml Atc. The growth of various strains was monitored by measuring absorbance at 3-h intervals. The graphs also show the growth curves when predicted functional residues were mutated (Table S4). F, for spotting assays 10.0-fold serial dilutions of induced and uninduced cultures were prepared and spotted on MB7H11 plates. The plates were incubated at 37 °C for 2 days, and the images were recorded. The data shown in these panels are representative of three independent experiments. Images in F correspond to the growth curves in A–E. These experiments were also supported by computational alanine-scanning predictions of the modeled proteins harboring the individual mutations, using FoldX (Fig. S5).
Figure 4.
Figure 4.
Distribution of toxins and antitoxins within the genus Mycobacterium. Heat map shows the distribution of VapC toxins (A) and VapB antitoxins (B) within the 101 mycobacterial species in the study (Table S5). A dot represents the occurrence of a sequence homologue of the M. tuberculosis query (shown on the y axis) for each genome (listed on the x axis). For the identification of a hit, cutoff thresholds of e-value <0.0001 and alignment length of >60% query length coverage were applied. The color convention shows the sequence identity of each hit in the range of 5% (blue) to 100% (red). The first eight points on the x axis are mycobacteria that constitute the MTBC. All other organisms listed on the x axis have been designated a three-letter code (mapping between three-letter code and organism name is provided in Table S7) and are arranged in alphabetical order. Comparisons between the left and right panels in A and B emphasize that a majority of the TA homologues of M. tuberculosis are found in the MTBC. They also show that several toxin and antitoxin homologues, in the genomes studied here, are lone toxins or antitoxins.
Figure 5.
Figure 5.
Plots showing the distribution of M. tuberculosis VapBC TA. Circos plots of homology searches for VapBC TA pairs (A) in eight MTBC (B) in 93 other mycobacteria. In the plots, the nodes represent organism names and TA types that are grouped distinctly, to facilitate interpretation of the figures. Each TA system is designated a separate color. A line is drawn between a TA node and that of an organism if both the toxin and antitoxin query find a homologue in PSI-BLAST and TBLASTN searches. The plots emphasize which of the TA systems of M. tuberculosis find homologues in other mycobacteria. Query types with large number of links (e.g. VapBC47 and VapBC5) are well-conserved with many homologues in various mycobacteria, whereas query types with few/nil links are MTBC-specific (VapBC41 and VapBC16, etc.), as also shown in Figs. S6 and S7.
Figure 6.
Figure 6.
Multiple sequence alignment of M. tuberculosis VapC30 (PDB code 4xgq) with selected orthologues from the prokaryotic genomes (A) and VapC5 (PDB code 3dbo) with selected orthologues from the prokaryotic genomes (B). The columns shaded dark red show conserved residues, and the columns shaded yellow show conservatively substituted residues. Secondary structure elements of the reference structures are depicted at the top of each alignment. Green boxes at the top of the alignment point to antitoxin-binding residues. Blue boxes show the conserved acidic residues of the PIN domain. Black boxes point to residues that confer structural stability in the reference structures. Pink boxes at the top of the alignment are the substrate-binding residues in the reference structures. Consensus sequence (at a threshold of >70%) for the alignment is shown at the bottom of the alignment.
Figure 7.
Figure 7.
Rv2514c–Rv2515c and Rv3642c–Rv3641c are novel TA in M. tuberculosis. A shows the growth curves for predicted toxin Rv2514c when expressed alone and in the presence of its potential, cognate antitoxin partner Rv2515c. Graph also shows the growth curves of the bacteria when predicted functional residues in the toxin were mutated. B shows spotting images corresponding to the growth curves. C, model of the predicted TA complex of Rv3641c–Rv3642c showing the putative TA interaction interface. Inset shows the predicted interactions between Arg-155–Asn-24 and Arg-155–Glu-28.

References

    1. World Health Organization. (2018) WHO Global Tuberculosis Report 2018, World Health Organization, Geneva, Switzerland: 10.1016/j.pharep.2017.02.021 - DOI
    1. Gerdes K., Christensen S. K., and Løbner-Olesen A. (2005) Prokaryotic toxin–antitoxin stress response loci. Nat. Rev. Microbiol. 3, 371–382 10.1038/nrmicro1147 - DOI - PubMed
    1. Magnuson R. D. (2007) Hypothetical functions of toxin–antitoxin systems. J. Bacteriol. 189, 6089–6092 10.1128/JB.00958-07 - DOI - PMC - PubMed
    1. Yamaguchi Y., and Inouye M. (2016) Stress and Environmental Regulation of Gene Expression and Adaptation in Bacteria (de Bruijn F. J., ed) pp. 97–107, John Wiley & Sons, Inc., New York
    1. Sala A., Bordes P., and Genevaux P. (2014) Multiple toxin–antitoxin systems in Mycobacterium tuberculosis. Toxins 6, 1002–1020 10.3390/toxins6031002 - DOI - PMC - PubMed

Publication types

MeSH terms

LinkOut - more resources