. 2019 Apr 24;11(489):eaat6177.
doi: 10.1126/scitranslmed.aat6177.

Diagnosis of genetic diseases in seriously ill children by rapid whole-genome sequencing and automated phenotyping and interpretation

Affiliations

Diagnosis of genetic diseases in seriously ill children by rapid whole-genome sequencing and automated phenotyping and interpretation

Michelle M Clark et al. Sci Transl Med. .

Abstract

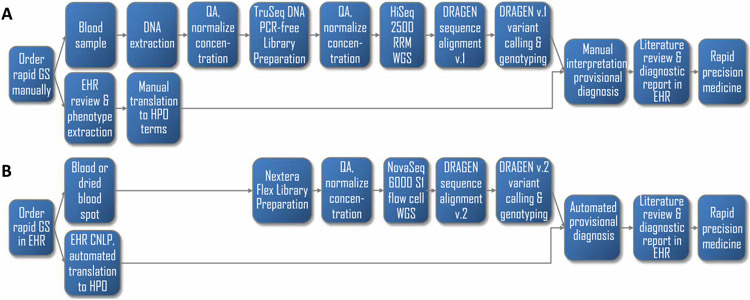
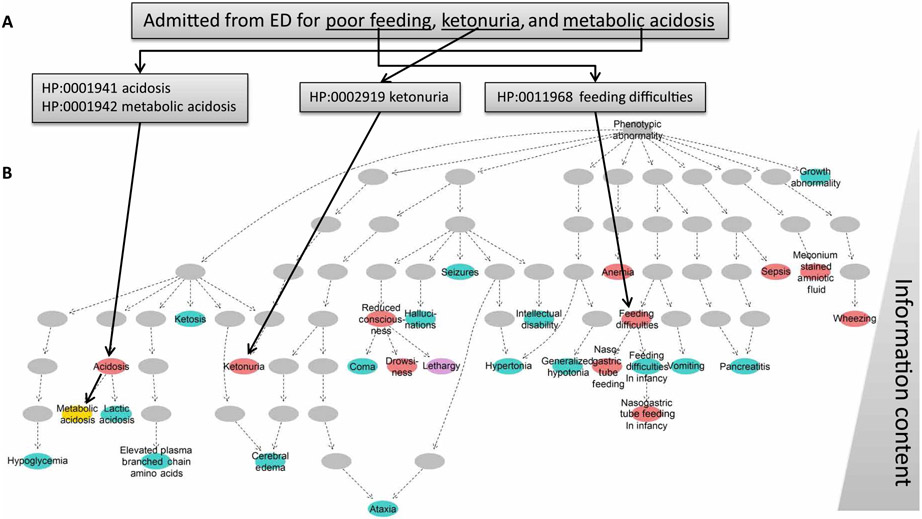
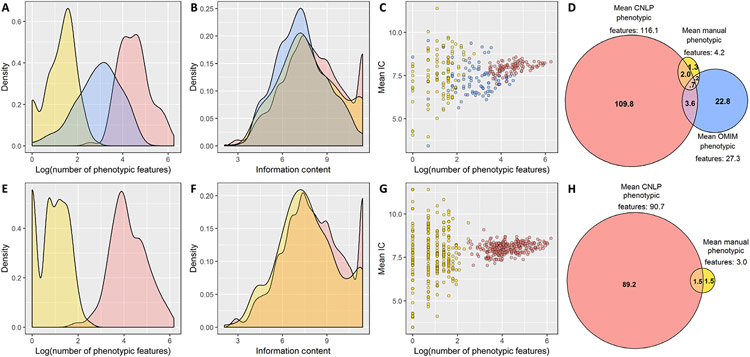
By informing timely targeted treatments, rapid whole-genome sequencing can improve the outcomes of seriously ill children with genetic diseases, particularly infants in neonatal and pediatric intensive care units (ICUs). The need for highly qualified professionals to decipher results, however, precludes widespread implementation. We describe a platform for population-scale, provisional diagnosis of genetic diseases with automated phenotyping and interpretation. Genome sequencing was expedited by bead-based genome library preparation directly from blood samples and sequencing of paired 100-nt reads in 15.5 hours. Clinical natural language processing (CNLP) automatically extracted children's deep phenomes from electronic health records with 80% precision and 93% recall. In 101 children with 105 genetic diseases, a mean of 4.3 CNLP-extracted phenotypic features matched the expected phenotypic features of those diseases, compared with a match of 0.9 phenotypic features used in manual interpretation. We automated provisional diagnosis by combining the ranking of the similarity of a patient's CNLP phenome with respect to the expected phenotypic features of all genetic diseases, together with the ranking of the pathogenicity of all of the patient's genomic variants. Automated, retrospective diagnoses concurred well with expert manual interpretation (97% recall and 99% precision in 95 children with 97 genetic diseases). Prospectively, our platform correctly diagnosed three of seven seriously ill ICU infants (100% precision and recall) with a mean time saving of 22:19 hours. In each case, the diagnosis affected treatment. Genome sequencing with automated phenotyping and interpretation in a median of 20:10 hours may increase adoption in ICUs and, thereby, timely implementation of precise treatments.


Figures

Fig. 1.
Fig. 1.. Flow diagrams of the diagnosis of genetic diseases by standard genome sequencing and rWGS.
(A) Steps in conventional clinical diagnosis of a single patient by genome sequencing (GS) with manual analysis and interpretation in a minimum of 26 hours but with a mean time to diagnosis of 16 days (8, 16-30). Genome sequencing was requested manually. We manually extracted genomic DNA from blood samples, assessed the DNA quality (QA), and manually normalized the DNA concentration. We then manually prepared TruSeq PCR-free DNA sequencing libraries, performed the QA again, and manually normalized the library concentration. Genome sequencing was performed on the HiSeq 2500 system (Illumina) in rapid run mode (RRM). Sequences were manually transferred to the DRAGEN Platform version 1 (Illumina) for alignment and variant calling. Phenotypic features were identified by manual review of the electronic health record (EHR). Variant files and phenotypic features were manually loaded into Opal software (Fabric), and interpretation was performed manually. (B) Steps in autonomous diagnosis of up to six patients concurrently in a minimum of 19 hours (fig. S3). Steps included (i) automation of order entry from the EHR with a portal; (ii) manual or robotic preparation of Nextera DNA Flex sequencing libraries directly from the blood in 2.5 hours; (iii) rapid 40-fold coverage genome sequencing in 15.5 hours with the NovaSeq 6000 system and S1 flow cell (Illumina); (iv) automation of sequence transfer, alignment, and variant calling in 1 hour with the DRAGEN platform, version 2 (Illumina); (v) automated extraction of patient phenomes from the EHR by clinical natural language processing (CNLP) and translation to Human Phenotype Ontology (HPO) terms in 20 s; and (vi) automated transfer of variant and phenotype files and automated Bayesian comparison of the CNLP phenome with those of all genetic diseases (MOON, Diploid) combined with automated assessment of the pathogenicity of their genomic variants based on aggregated literature knowledge and in silico predictive tools (InterVar) and with automated display of the highest-ranked provisional diagnosis(es).
Fig. 2.
Fig. 2.. CNLP can extract a more detailed phenome than manual EHR review or OMIM clinical synopsis.
(A) Example CNLP of a sentence from the EHR of an 8-day-old baby (patient 341) with maple syrup urine disease, showing four extracted HPO terms. ED, emergency department. (B) Hierarchical display of HPO phenotypic features extracted by manual review of the EHR of neonate 341 and by CNLP (red) and expected phenotypic features (from the OMIM Clinical Synopsis; blue). Yellow circles: Phenotypic features extracted by both CNLP and expert review. Purple circles: Phenotypic overlap between CNLP and OMIM. Gray circles: The location of parent terms of identified phenotypic features within the HPO hierarchy. The information content (IC) was defined by IC(phenotype) = −log(pphenotype), where pphenotype was the probability of observing the exact term or one of its subclasses across all diseases in OMIM. IC increases from top (general) to bottom (specific).
Fig. 3.
Fig. 3.. Comparison of observed and expected phenotypic features of 375 children with suspected genetic diseases.
(A to D) One hundred one children diagnosed with 105 genetic diseases. (E to H) Two hundred seventy-four children with suspected genetic diseases that were not diagnosed by genome sequencing. Phenotypic features identified by manual EHR review are in yellow, those identified by CNLP are in red, and the expected phenotypic features, derived from the OMIM Clinical Synopsis, are in blue. (A) Frequency distribution of the number of phenotypic features (log-transformed) in 101 children with genetic diseases. The mean number of features detected per patient was 4.2 (SD, 2.6; range, 1 to 16) for manual review, 116.1 (SD, 93.6; range, 13 to 521) for CNLP, and 27.3 (SD, 22.8; range, 1 to 100) for OMIM (OMIM versus manual, P < .0001; CNLP versus OMIM, P < .0001; CNLP versus manual, P < 0.0001; paired Wilcoxon tests). (B) Frequency distribution of IC for each phenotypic feature set in 101 diagnosed patients. The mean IC was 7.8 (SD, 2.0; range, 2.1 to 11.4) for manual review, 8.1 (SD, 2.0; range, 2.6 to 11.4) for CNLP, and 7.3 (SD, 1.7; range, 3.2 to 11.4) for OMIM (manual versus OMIM, P < .0001; CNLP versus OMIM, P < .0001; manual versus CNLP, P = 0.003; Mann-Whitney U tests). (C) Correlation of the mean IC of phenotypic terms with the number of phenotypic terms in each patient. Spearman’s rank correlation coefficient (rs) was 0.24 for manually extracted phenotypic features (P = 0.02), 0.44 for CNLP (P < 0.0001), and −0.001 for OMIM (P > 0.05). (D) Venn diagram showing overlap of phenotypic terms by the three methods for diagnosed patients. Phenotypic features extracted by CNLP overlapped expected OMIM phenotypic features (mean, 4.31 terms; SD, 4.59; range, 0 to 32) significantly more than manually (mean, 0.92 terms; SD, 1.02; range, 0 to 4; P < 0.0001, paired Wilcoxon test for the difference in the number of terms that overlap with OMIM). (E) Frequency distribution of the number of phenotypic features (log-transformed) in 274 children with suspected genetic diseases that were not diagnosed by genome sequencing. The mean number of features was 3.0 (SD, 1.9; range, 1 to 12) for manual review and 90.7 (SD, 81.1; range, 6 to 482) for CNLP (CNLP versus manual, P < 0.0001; paired Wilcoxon test). (F) Frequency distribution IC for each phenotypic feature set in 274 undiagnosed patients. The mean IC was 7.7 (SD, 2.1; range, 2.1 to 11.4) for manual review and 8.1 (SD, 2.0; range, 2.6 to 11.4) for CNLP (manual versus CNLP, P < 0.0001; Mann-Whitney U test). (G) Correlation of the mean IC of phenotypic terms with the number of phenotypic terms in each patient. rs was 0.02 for manually extracted phenotypic features (P > 0.05) and 0.30 for CNLP (P < 0.0001). (H) Venn diagram showing overlap of phenotypic terms for undiagnosed patients by CNLP and manual methods.

Comment in

  • Rapid neonatal diagnosis.
    Stower H. Stower H. Nat Med. 2019 Jun;25(6):877. doi: 10.1038/s41591-019-0487-2. Nat Med. 2019. PMID: 31171871 No abstract available.

References

    1. Khokha MK, Mitchell LE, Wallingford JB, White paper on the study of birth defects. Birth Defects Res. 109, 180–185 (2017). - PubMed
    1. March of Dimes Foundation Data Book for Policy Makers: Maternal, Infant and Child Health in the United States 2016 (March of Dimes, 2016); www.marchofdimes.org/March-of-Dimes-2016-Databook.pdf.
    1. Murphy SL, Xu J, Kochanek KD, Arias E, Mortality in the United States, 2017. NCHS Data Brief, 1–8 (2018). - PubMed
    1. Yoon PW, Olney RS, Khoury MJ, Sappenfield WM, Chavez GF, Taylor D, Contribution of birth defects and genetic diseases to pediatric hospitalizations. A population-based study. Arch. Pediatr. Adolesc. Med 151, 1096–1103 (1997). - PubMed
    1. Arth AC, Tinker SC, Simeone RM, Ailes EC, Cragan JD, Grosse SD, Inpatient hospitalization costs associated with birth defects among persons of all ages—United States, 2013. MMWR Morb. Mortal. Wkly Rep 66, 41–46 (2017). - PMC - PubMed

Publication types