. 2019 Jun 14;93(13):e00640-19.
doi: 10.1128/JVI.00640-19. Print 2019 Jul 1.

Comparative Analysis of African and Asian Lineage-Derived Zika Virus Strains Reveals Differences in Activation of and Sensitivity to Antiviral Innate Immunity

Affiliations

Comparative Analysis of African and Asian Lineage-Derived Zika Virus Strains Reveals Differences in Activation of and Sensitivity to Antiviral Innate Immunity

Katharina Esser-Nobis et al. J Virol. .

Abstract

In recent years, Asian lineage Zika virus (ZIKV) strains emerged to cause pandemic outbreaks associated with a high rate of congenital ZIKV syndrome (CZVS). The reasons for the enhanced spread and severe disease caused by newly emerging strains are not fully understood. Here we compared viral sequences, viral replication, and innate immune signaling induction of three different ZIKV strains derived from African and Asian lineages and West Nile virus, another flavivirus. We found pronounced differences in activation of innate immune signaling and inhibition of viral replication across ZIKV strains. The newly emerged Asian ZIKV strain Brazil Fortaleza 2015, which is associated with a higher rate of neurodevelopmental disorders like microcephaly, induced much weaker and delayed innate immune signaling in infected cells. However, superinfection studies to assess control of innate immune signaling induced by Sendai virus argue against an active block of IRF3 activation by the Brazilian strain of ZIKV and rather suggest an evasion of detection by host cell pattern recognition receptors. Compared to the Asian strain FSS13025 isolated in Cambodia, both ZIKV Uganda MR766 and ZIKV Brazil Fortaleza appear less sensitive to the interferon-induced antiviral response. ZIKV infection studies of cells lacking the different RIG-I-like receptors identified RIG-I as the major cytosolic pattern recognition receptor for detection of ZIKV.IMPORTANCE Zika Virus (ZIKV), discovered in 1947, is divided into African and Asian lineages. Pandemic outbreaks caused by currently emerging Asian lineage strains are accompanied by high rates of neurological disorders and exemplify the global health burden associated with this virus. Here we compared virological and innate immunological aspects of two ZIKV strains from the Asian lineage, an emerging Brazilian strain and a less-pathogenic Cambodian strain, and the prototypic African lineage ZIKV strain from Uganda. Compared to the replication of other ZIKV strains, the replication of ZIKV Brazil was less sensitive to the antiviral actions of interferon (IFN), while infection with this strain induced weaker and delayed innate immune responses in vitro Our data suggest that ZIKV Brazil directs a passive strategy of innate immune evasion that is reminiscent of a stealth virus. Such strain-specific properties likely contribute to differential pathogenesis and should be taken into consideration when choosing virus strains for future molecular studies.

Keywords: RIG-I-like receptors; Zika virus; flavivirus; innate immunity.


Figures

FIG 1
FIG 1
Sequence comparison of African and Asian lineage ZIKV strains. (A) Schematic of the ZIKV polyprotein. An asterisk indicates the position of a deletion in ZIKV/Uganda E protein. Arrowheads indicate positions of mutations referred to in Results. (B and C) After deep sequencing of viral stocks and contig generation, nucleotides from the open reading frames (ORFs) (B) or amino acid sequences (C) of ZIKV strains and WNV TX were aligned by the Jotun Hein method using MegAlign software (DNASTAR). The matrix presents percent identity and percent divergence, as well as nucleotide (B) or amino acid (aa) sequence (C) length. (D) Amino acid sequence comparison of single proteins of ZIKV/Uganda and ZIKV/Cambodia to ZIKV/Brazil depicted as percent divergence.
FIG 2
FIG 2
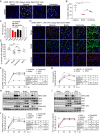
Growth kinetics and innate immune activation of African and Asian lineage ZIKV strains in A549 cells. (A and B) Infection efficiency of ZIKV strains in A549 cells. MOIs were calculated with viral titers derived from plaque assays performed with Vero cells. After infection of A549 cells with an MOI of 5 for 24 h, samples were analyzed by immunofluorescent staining for dsRNA. Per condition, three randomly selected fields of view representing at least 300 cells were analyzed. Images were acquired on a Nikon Eclipse Ti confocal microscope and manually analyzed in ImageJ using the multipoint tool. The number of dsRNA-positive cells was normalized to the total number of cells as determined by DAPI staining of nuclei and is presented as the percentage of infection efficiency. Depicted are means and standard deviations (SD) of the results of two independent experiments (n = 2). Statistical analysis was performed with a one-way analysis of variance (ANOVA), followed by Tukey’s range test. ns, not significant; *, P < 0.05; **, P < 0.01. (C) Focus-forming unit (FFU) assay performed with Vero and A549 cells to obtain viral titers for ZIKV and WNV stocks for both cell lines. Data are derived from two FFU assays performed independently and are presented as the means with SD on a log scale. (D and E) Infection efficiency of ZIKV strains and WNV TX in A549 cells after calculating the MOI with viral titers derived from an FFU assay performed with A549 cells (shown in panel C). At 24 h after virus challenge, infection rates were analyzed by immunofluorescent staining for viral protein NS4B and dsRNA. Per condition, at least five randomly selected fields of view representing at least 230 cells in total were analyzed. Images were acquired on a Nikon Eclipse Ti confocal microscope and manually analyzed in ImageJ using the multipoint tool. The number of NS4B-positive cells was normalized to the total number of cells as determined by DAPI staining of nuclei and is presented as the percentage of infection efficiency in panel E. Data are derived from two independent experiments and were tested for statistical significance by one-way ANOVA, followed by Tukey’s range test. ns, not significant; **, P < 0.01. (F to J) A549 cells were infected with SeV (40 hemagglutination units [HAU]/ml) or ZIKV or WNV (both at an MOI of 1) based on viral titers derived from an FFU assay of A549 cells. Cell lysates and culture supernatants were collected after 6, 24, 48, and 72 h to determine intracellular viral RNA, viral particles in the supernatant, and viral protein and for analysis of the innate immune response. Three independent experiments were performed (n = 3). (F) Analysis of ZIKV, WNV, and SeV RNA by SYBR green qPCR using virus-specific primer pairs and normalized to RPL13a housekeeping gene expression. Shown are the mean fold changes over the value at 6 h and SD calculated from three independent experiments performed in triplicate and presented on a log scale (log10). A two-way ANOVA followed by Tukey’s range test was used to test for statistical significance. ns, not significant; *, P < 0.05; **, P < 0.01; ***, P < 0.001. p.i., postinfection. (G) Viral titers in supernatants were measured by an FFU assay performed on Vero cells. Presented are means and SD calculated from three independent experiments on a log scale. A two-way ANOVA followed by Tukey’s range test was used to test for significance. ns, not significant; **, P < 0.01; ***, P < 0.001; ****, P < 0.0001. (H and I) Western blot analysis of cell lysates collected at the indicated time points after infection. Viral protein levels were measured using antibodies specific for ZIKV NS5, WNV NS3, or parainfluenza virus (SeV). The innate immune response was analyzed with antibodies targeting IRF3 phosphorylated at serine 386 (IRF3 S386), total IRF3 (IRF3), and the ISGs IFIT1 and MxA. The actin level served as a loading control. Depicted is one representative Western blot of three independent experiments. (J) IFN-β and IFIT1 mRNA expression analyzed by SYBR green qPCR and normalized to RPL13a housekeeping gene expression using the total RNA harvested from infection experiments described above. Presented are means and SDs of the results of three independent experiments performed in triplicate and depicted on a log scale. A two-way ANOVA followed by Tukey’s range test was used to test for statistical significance. ns, not significant; **, P < 0.01; ***, P < 0.001; ****, P < 0.0001.
FIG 3
FIG 3
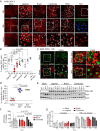
ZIKV-induced IRF3 activation and type I IFN sensitivity. (A) Immunofluorescence analysis of IRF3 activation in A549 cells after infection with ZIKV (MOI = 5), WNV TX (MOI = 5), or SeV (20 HAU/ml). At 24 or 48 h postinfection (p.i.), cells were fixed and analyzed with antibodies targeting IRF3 and dsRNA or parainfluenza virus to control for SeV infection. The bottom row shows enlarged images of the boxed areas (insets: 48 h for ZIKV and WNV, 24 h for SeV). (B) Quantification of immunofluorescence shown in panel A. dsRNA/nuclear IRF3 double-positive cells were counted for 150 to 300 dsRNA-positive cells per condition and expressed as a percentage of double-positive cells. The graph depicts the means and SD of the results of three independent experiments (n = 3), with one data point representing one analyzed field of view. For SeV, cells with nuclear IRF3 were counted and compared to the total cell number, since at 20 HAU/ml, the infection efficiency was ∼100% as determined by anti-parainfluenza virus staining. Statistical analysis was performed with one-way ANOVA, followed by Tukey’s range test. ns, not significant; ***, P < 0.001; ****, P < 0.0001. (C) A549 cells were infected with ZIKV/Brazil (MOI = 1), and at 7 h p.i., cells were superinfected with SeV (20 HAU/ml) for 17 h. After 24 h of infection with ZIKV/Brazil, cells were fixed for immunofluorescent staining with antibodies targeting dsRNA to detect ZIKV-infected cells, IRF3, or IFIT1. The right columns show enlarged images of the boxed areas (insets). (D) Quantification of immunofluorescence shown in panel C. dsRNA/nuclear IRF3 double-positive cells were counted for 200 to 270 cells per condition and expressed as a percentage of double-positive cells. The graph depicts the means and SD of the results of two independent experiments (n = 2), with one data point representing one analyzed field of view. A one-way ANOVA analysis followed by Tukey’s range test was used to test for statistical significance. ns, not significant; ****, P < 0.0001. (E) Type I IFN sensitivity of ZIKV strains in Vero cells. Vero cells were treated with IFN-β (500 IU/ml) for 4 h, followed by infection with the indicated ZIKV strains (MOI = 5). Cells were harvested at the indicated time points, and lysates were analyzed by Western blotting. One representative Western blot of three independent experiments is shown. (F and G) ZIKV RNA and IFITM1 mRNA expression measured by qPCR analysis of experiments performed analogous to those described for panel E, with 1 h of IFN-β pretreatment before ZIKV infection. Values for ZIKV RNA were normalized to those of the RLP13a housekeeping gene and the respective untreated control. IFITM1 transcript levels were normalized to those of the RLP13a housekeeping gene and are presented on a log scale. Depicted are the means and SD of the results from three independent experiments (n = 3). Statistical analysis was performed with a two-way ANOVA followed by Tukey’s range test. ns, not significant.
FIG 4
FIG 4
RLR dependence of innate immune signaling during ZIKV and WNV infection of A549 cells. (A) A549 cells with single RLR knockout (KO) or MAVS knockdown (KD) were generated by CRISPR Cas9 and analyzed for RLR, MAVS, and ISG protein level upon stimulation with IFN-β (100 IU/ml) and TNF-α (50 ng/ml) for 24 h. An asterisk indicates prolonged exposure. (B) A549 RLR KO and MAVS KD cells were infected with ZIKV/Cambodia (MOI = 5). At the indicated time points, cell lysates were generated and analyzed by Western blotting for IRF3 activation (IRF3 S396), ISG induction, and ZIKV NS5 protein level. Depicted is one representative blot of three independent experiments (n = 3). An asterisk indicates prolonged exposure. (C) IFIT1 and IFN-β mRNA expression measured by qPCR analysis of experiments described for panel B. The graph depicts the means and SD of the results of three independent experiments (n = 3) performed in triplicate and presented on a log scale (log10). Data were normalized to those of the GAPDH housekeeping gene. (D) Viral growth kinetics of infection experiments described for panel B determined by qPCR (left) and plaque assay (Vero cells) (right). (Left) A graph presents the means and SD of the results of three independent experiments (n = 3) measured in triplicate and depicted on a log scale (log10). (Right) Supernatants were collected at the indicated time points, and PFU/ml were determined by plaque assay on Vero cells. The graph presents the means and SD of the results of three independent experiments (n = 3) on a log scale (log10). (E) Analogous to infection experiments described for panel B, A549 RLR KO or MAVS KD cells were infected with WNV TX (MOI = 5), and cell lysates were harvested at the indicated time points and analyzed by Western blotting for innate immune activation (IRF3 Ser396, IFIT1, MxA) and WNV NS3 protein level. Depicted is one representative blot of three independent experiments (n = 3). (F) qPCR analysis of IFIT1 and IFN-β mRNA expression upon infection of A549 KO or KD cells with WNV as described for panel E. The graph presents the mean and SD of three independent experiments (n = 3) performed in triplicate and presented on a log scale (log10). (G) WNV growth kinetics of A549 KO or KD cell infection experiments described for panel E. (Top) WNV RNA measured by qPCR using WNV-specific primer pairs. Data were normalized to GAPDH. The means and SD of the results of three independent experiments (n = 3) performed in triplicate are presented on a log scale (log10). (Bottom) Analysis of viral supernatants by plaque assay. Shown are the means and SD of the results of three independent experiments (n = 3) depicted on a log scale (log10). Statistical analysis of all qPCR and plaque assay data was performed with two-way ANOVA, followed by Bonferroni’s multiple-comparison test. ns, not significant; *, P < 0.05; **, P < 0.01; ***, P < 0.001; ****, P < 0.0001.

References

    1. Dick GW, Kitchen SF, Haddow AJ. 1952. Zika virus. I. Isolations and serological specificity. Trans R Soc Trop Med Hyg 46:509–520. doi: 10.1016/0035-9203(52)90042-4. - DOI - PubMed
    1. PAHO/WHO. 25 August 2017. Zika–epidemiological update. PAHO/WHO, Washington, DC: https://www.paho.org/hq/index.php?option=com_docman&task=doc_download&gi.... Accessed 4 June 2018.
    1. Weaver SC, Costa F, Garcia-Blanco MA, Ko AI, Ribeiro GS, Saade G, Shi PY, Vasilakis N. 2016. Zika virus: history, emergence, biology, and prospects for control. Antiviral Res 130:69–80. doi: 10.1016/j.antiviral.2016.03.010. - DOI - PMC - PubMed
    1. Martines RB, Bhatnagar J, Keating MK, Silva-Flannery L, Muehlenbachs A, Gary J, Goldsmith C, Hale G, Ritter J, Rollin D, Shieh WJ, Luz KG, Ramos AM, Davi HP, Kleber de Oliveria W, Lanciotti R, Lambert A, Zaki S. 2016. Notes from the field: evidence of Zika virus infection in brain and placental tissues from two congenitally infected newborns and two fetal losses–Brazil, 2015. MMWR Morb Mortal Wkly Rep 65:159–160. doi: 10.15585/mmwr.mm6506e1. - DOI - PubMed
    1. Mead PS, Hills SL, Brooks JT. 2018. Zika virus as a sexually transmitted pathogen. Curr Opin Infect Dis 31:39–44. doi: 10.1097/QCO.0000000000000414. - DOI - PubMed

Publication types