. 2019 May 7;116(19):9350-9359.
doi: 10.1073/pnas.1814777116. Epub 2019 Apr 24.

Telomere DNA G-quadruplex folding within actively extending human telomerase

Affiliations

Telomere DNA G-quadruplex folding within actively extending human telomerase

Linnea I Jansson et al. Proc Natl Acad Sci U S A. .

Abstract

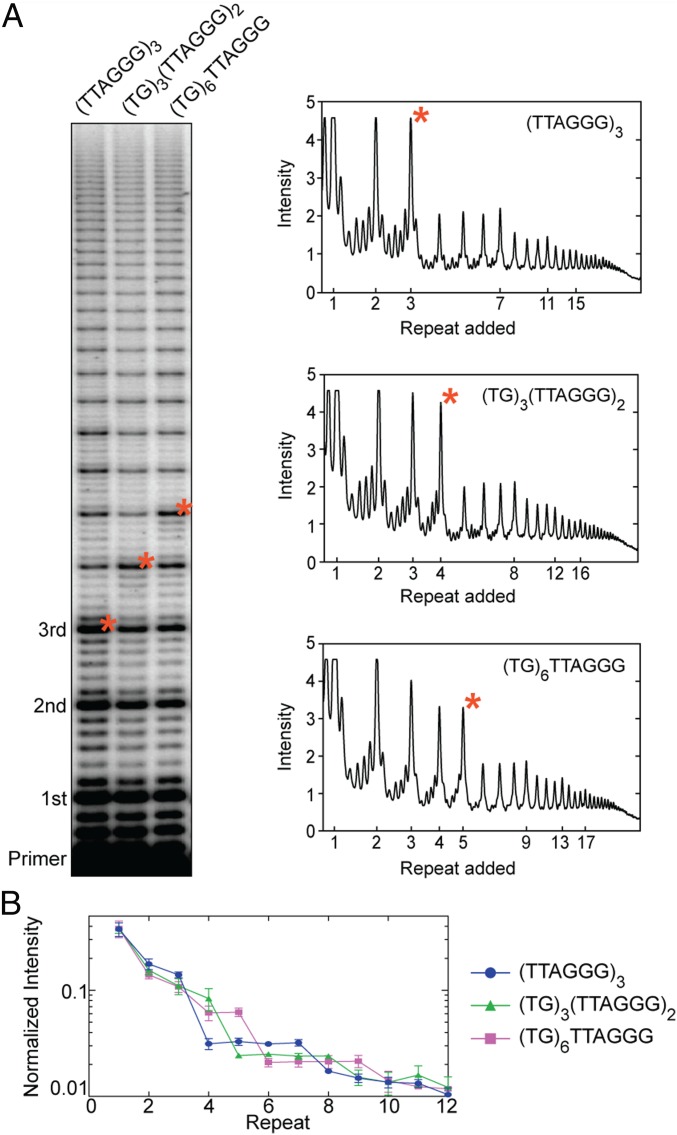
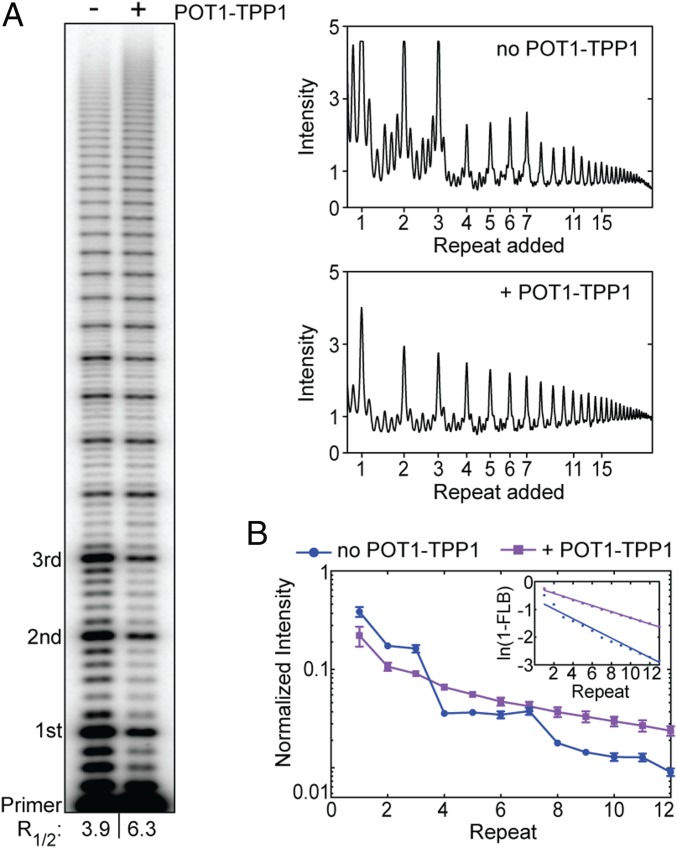
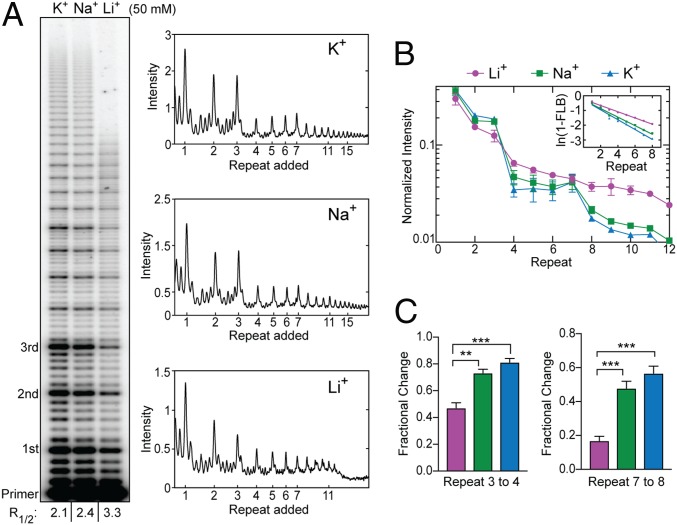
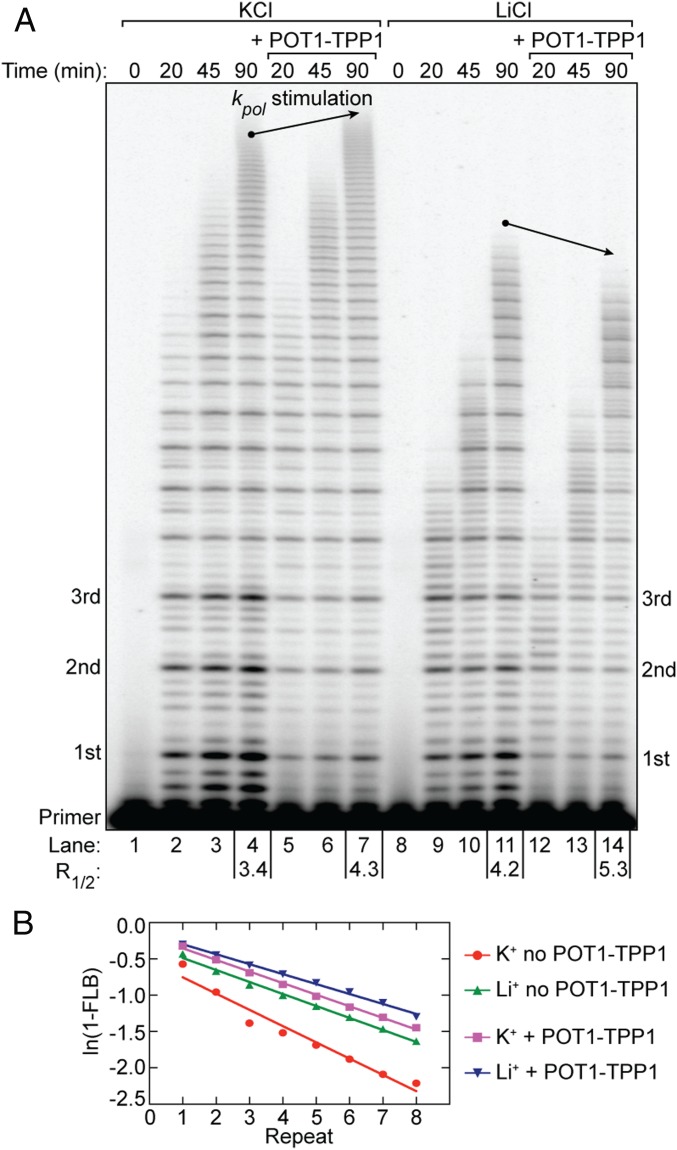
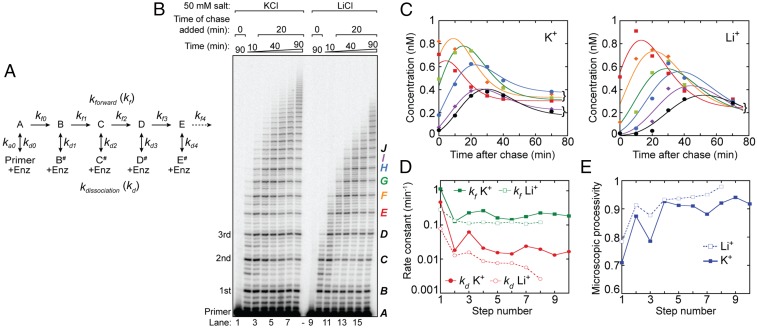
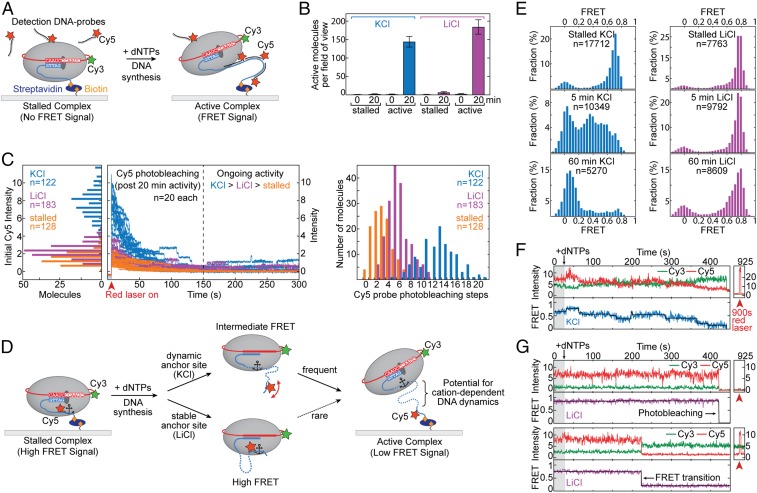
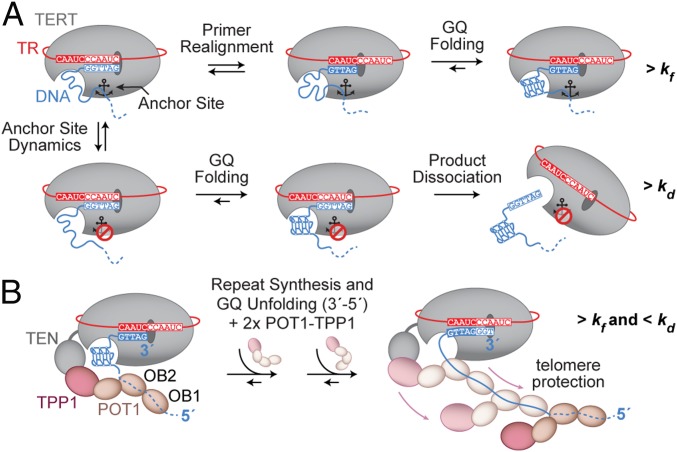
Telomerase reverse transcribes short guanine (G)-rich DNA repeat sequences from its internal RNA template to maintain telomere length. G-rich telomere DNA repeats readily fold into G-quadruplex (GQ) structures in vitro, and the presence of GQ-prone sequences throughout the genome introduces challenges to replication in vivo. Using a combination of ensemble and single-molecule telomerase assays, we discovered that GQ folding of the nascent DNA product during processive addition of multiple telomere repeats modulates the kinetics of telomerase catalysis and dissociation. Telomerase reactions performed with telomere DNA primers of varying sequence or using GQ-stabilizing K+ versus GQ-destabilizing Li+ salts yielded changes in DNA product profiles consistent with formation of GQ structures within the telomerase-DNA complex. Addition of the telomerase processivity factor POT1-TPP1 altered the DNA product profile, but was not sufficient to recover full activity in the presence of Li+ cations. This result suggests GQ folding synergizes with POT1-TPP1 to support telomerase function. Single-molecule Förster resonance energy transfer experiments reveal complex DNA structural dynamics during real-time catalysis in the presence of K+ but not Li+, supporting the notion of nascent product folding within the active telomerase complex. To explain the observed distributions of telomere products, we globally fit telomerase time-series data to a kinetic model that converges to a set of rate constants describing each successive telomere repeat addition cycle. Our results highlight the potential influence of the intrinsic folding properties of telomere DNA during telomerase catalysis, and provide a detailed characterization of GQ modulation of polymerase function.

Keywords: DNA structure; G quadruplex; POT1–TPP1; telomerase; telomere.


Conflict of interest statement

The authors declare no conflict of interest.

Figures

Fig. 1.
Fig. 1.
Human telomerase function. (A) Telomerase catalytic cycle. TERT and TR are shown simplified in gray and red, respectively. The telomere DNA is shown in blue and the telomerase anchor site is schematically represented by an anchor symbol. koff and kon represent the rate constants for dissociation from and annealing to the telomere, respectively. The rate constant for nucleotide addition during repeat synthesis is represented by kpol, and the translocation rate constant after the completion of each repeat is represented by ktrans. The rate constants governing nucleotide addition and translocation together define repeat-addition processivity. (B) Telomerase primer-extension assay with 50 nM 32P end-labeled (TTAGGG)3 primer. Nucleotide concentrations are indicated above the gel, and repeats added to the (TTAGGG)3 primer are indicated on the left. The R1/2 values are shown at the bottom of the gel. (C) Normalized gel band intensity (B) plotted as a function of repeat number. (C, Inset) Fraction left behind was calculated by dividing the sum of each RAP band and all bands below by the total intensity of a given lane. The plot of ln(1 − FLB) over repeat number was used to calculate R1/2 processivity values (B).
Fig. 2.
Fig. 2.
Telomerase product distribution profile varies with the number of consecutive TTAGGG DNA repeats. (A) Telomerase primer-extension assay with primers of varying TTAGGG composition. Primer variants are indicated at the top of the gel. Repeats added to the primer are indicated to the left. Lane profiles with raw intensity versus added repeat are shown for each primer variant (Right). Corresponding bands between the gel and lane profiles are indicated by red asterisks. (B) Gel band intensities were normalized to the total counts in each lane and are plotted as a fraction of the total counts versus repeat number. Data plotted represent the mean values from three independent experiments, and error bars are the SD.
Fig. 3.
Fig. 3.
POT1–TPP1 alters the telomerase product distribution profile. (A) Telomerase primer-extension assay in the absence and presence of POT1–TPP1. Numbers of added repeats are indicated to the left. The R1/2 values are shown at the bottom of the gel. Corresponding lane profiles with raw gel band intensities are plotted over added repeats (Right). (B) Gel band intensities in the absence (blue circles) or presence (purple squares) of POT1–TPP1 were normalized to the total counts in each lane and plotted as a fraction of the total counts versus repeat number. Data plotted represent the mean values from three independent experiments, and error bars are the SD. (B, Inset) The plot of ln(1 − FLB) over repeat number was used to calculate R1/2 processivity values shown in A.
Fig. 4.
Fig. 4.
Telomerase product distribution profile depends on monovalent cation identity. (A) Telomerase primer-extension assays in the presence of different monovalent cations. Repeats added to the primer are indicated to the left. The R1/2 values are shown at the bottom of the gel. Lane profiles with raw intensity versus repeat band for each lane are shown (Right). (B) Gel band intensities from experiments in KCl (blue triangles), NaCl (green squares), and LiCl (magenta circles) were normalized to the total counts in each lane and are plotted as a fraction of the total counts versus repeat number. Data plotted represent the mean values from three independent experiments, and error bars are the SD. (B, Inset) The plot of ln(1 − FLB) over repeat number was used to calculate the R1/2 processivity values shown in A. (C) Statistical analysis of fractional change in band intensities between repeats 3 to 4 (Left) and 7 to 8 (Right). Error bars represent the SD of experiments performed in triplicate (B). P values were calculated using a Welch’s t test; ***P < 0.001, **P < 0.01.
Fig. 5.
Fig. 5.
POT1–TPP1 does not enhance telomerase catalysis rates in GQ-destabilizing conditions. (A) Telomerase primer-extension time-course assay in the absence and presence of POT1–TPP1 and under differential cation conditions. Time points of the reactions are indicated above the gel. POT1–TPP1–dependent differences in the maximum product length at 90-min reaction time (i.e., differences in synthesis rate) are indicated by arrows. R1/2 processivity values are given for reaction end points below the gel. (B) The plot of ln(1 − FLB) over repeat number was used to calculate R1/2 processivity values (A).
Fig. 6.
Fig. 6.
Human telomerase kinetics. (A) Kinetic mechanism for processive telomerase activity used to globally fit the primer-extension assay shown in B. The letters refer to the repeat band number (B, first added repeat; C, second repeat; etc.), and dissociated products are identified with the # symbol. Band intensities are proportional to the sum of products (e.g., B + B#). (B) Extending primer dissociation rate assay in the presence of 50 mM KCl or LiCl. Primer-extension assays were performed with 50 nM 32P end-labeled (TTAGGG)3 primer. Unlabeled chase (TTAGGG)3 primer (20 μM) was added to the reaction after 20 min of activity. A control reaction with 20 μM unlabeled chase primer added at the beginning of telomerase activity was included for both buffer conditions (lanes 1 and 9). Repeat number added to the primer is indicated on the left of the gel. Letters indicating band identity for kinetic modeling are indicated on the right of the gel. Bands E to J are colored according to the plot shown in C. (C) Representative global fits to bands E to J in KCl (Left) and LiCl (Right). The concentration of the products (see color code in B), based on band intensity relative to the initial 50 nM primer, was plotted against the time after the unlabeled chase. Note the clustering of bands E to H and I and J 70 min post chase in the presence of KCl, which corresponds to the four repeats of the first plateau and the first two repeats of the second plateau (cf. Fig. 2). This partitioning is not present in the presence of LiCl. See SI Appendix, Fig. S5 A and B for corresponding plots for bands B to D that precede the pattern-of-four bands. (D) Consecutive rate constant values for forward repeat addition (green squares; kf) and dissociation (red circles; kd) returned by DynaFit for data in the presence of KCl (solid symbols) and LiCl (open symbols). The step number refers to the rate constant subscripts shown in A. Note the overall reaction is slower in the presence of LiCl, and beyond band I (eighth step) the fitted rate constant values had a large error because the decay phase had barely started by 70 min. Therefore, these values were omitted. (E) Microscopic processivity [kf/(kf + kd)] at each step of the reaction calculated from the rate constants shown in D. Note the sawtooth structure in the presence of KCl (solid line) compared with the relative lack of structure in LiCl beyond the second step (dashed line). See also SI Appendix, Fig. S6C.
Fig. 7.
Fig. 7.
Single-molecule studies of telomerase in the presence of KCl and LiCl. (A) Schematic of the human telomerase smFRET activity assay. Purified telomerase is immobilized to a pegylated and biotinylated quartz slide through binding to a biotinylated telomere primer (blue). TERT is depicted as a gray oval, and hTR is shown in red. A Cy3 dye (green star) is conjugated to hTR. The binding of Cy5-labeled detection oligonucleotide probes (in black with red star) to newly synthesized telomere DNA is illustrated (Right). (B) Analysis of smFRET activity assays in KCl (blue) and LiCl (magenta) cation conditions. Negative controls were performed in the presence of Cy5 detection probes but in the absence of dNTPs (stalled). Time points and number of FRET-positive molecules per field of view imaged are indicated. Error bars are the SD across all fields imaged (n > 10). (C, Left) Histogram analysis of the initial Cy5 intensity distribution under direct laser excitation of active telomerase–DNA complexes (A, Right) in KCl (blue) and LiCl (magenta) cation conditions. Background signal was assessed in the absence of dNTPs (stalled; orange). (C, Center) Real-time traces showing time-dependent photobleaching of Cy5 dyes under direct laser excitation. Twenty representative traces are shown for simplification. Color coding is as indicated. (C, Right) Histogram analysis of the distribution of Cy5 photobleaching steps counted from each individual real-time trace. Conditions and number of traces are as indicated. (D) Schematic of human telomerase smFRET experiment designed to probe DNA structural dynamics. The telomere primer (blue) is conjugated to a Cy5 dye (red star). Telomere repeat synthesis impacts the FRET behavior depending upon anchor-site stability and identity of monovalent cations as illustrated. (E) Histogram analysis of smFRET assays (D) in KCl (blue) and LiCl (magenta). FRET distributions are shown for stalled telomerase complexes (Top) as well as at 5- and 60-min time points after addition of dNTPs (Middle and Bottom, respectively). (F and G) Representative real-time smFRET traces of individual telomerase complexes (D) in either KCl (F) or LiCl (G). Cy3 donor intensities are shown in green, and Cy5 acceptor intensities are in red. The corresponding FRET value (blue or magenta) was fit with steps (black) using an automated stepfinding algorithm in MATLAB (74). Direct laser excitation of the Cy5 dye in each trace is shown separately at a 900-s time point.
Fig. 8.
Fig. 8.
Model of GQ folding within the actively extending telomerase complex. (A) At the completion of a telomere repeat, telomerase (with TERT depicted in gray and hTR in red) is annealed to the telomere DNA (blue). The schematically drawn anchor site (anchor symbol) is either engaged with the telomere DNA (Top pathway) or disengaged (Bottom pathway). Sequential repeat synthesis and primer realignment extrude telomere DNA from the active site to eventually allow for GQ formation. In the case where anchor-site contacts are maintained at this stage (Top, Middle and Right cartoons), the formation of a GQ may bias the enzyme complex toward another round of telomere repeat addition. If the anchor-site contacts are instead broken when GQ formation occurs (Bottom, Left and Middle cartoons), primer realignment results in product dissociation at this stage (Bottom, Right cartoon). (B) Extension of the mechanistic GQ model (A) illustrating the possibility and functional contribution of GQ formation in the presence of the GQ resolvase POT1–TPP1. A telomere-bound POT1–TPP1 unit engages the hTERT TEN domain via TPP1. Upon GQ formation, further POT1–TPP1 units are recruited to resolve the GQ in a 3′-to-5′ direction, resulting in fully protected telomere DNA. Concurrent telomere synthesis generates additional G-rich repeats for the process to continue in a four-repeat periodicity.

Similar articles

Cited by

References

    1. de Lange T. Shelterin: The protein complex that shapes and safeguards human telomeres. Genes Dev. 2005;19:2100–2110. - PubMed
    1. de Lange T. How shelterin solves the telomere end-protection problem. Cold Spring Harb Symp Quant Biol. 2010;75:167–177. - PubMed
    1. Palm W, de Lange T. How shelterin protects mammalian telomeres. Annu Rev Genet. 2008;42:301–334. - PubMed
    1. McElligott R, Wellinger RJ. The terminal DNA structure of mammalian chromosomes. EMBO J. 1997;16:3705–3714. - PMC - PubMed
    1. Maizels N, Gray LT. The G4 genome. PLoS Genet. 2013;9:e1003468. - PMC - PubMed

Publication types