. 2019 May 7;116(19):9533-9542.
doi: 10.1073/pnas.1814932116. Epub 2019 Apr 24.

Cystine-glutamate antiporter xCT deficiency suppresses tumor growth while preserving antitumor immunity

Affiliations

Cystine-glutamate antiporter xCT deficiency suppresses tumor growth while preserving antitumor immunity

Michael D Arensman et al. Proc Natl Acad Sci U S A. .

Abstract

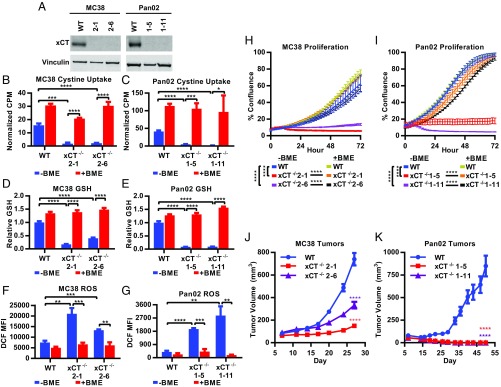
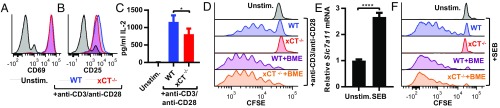
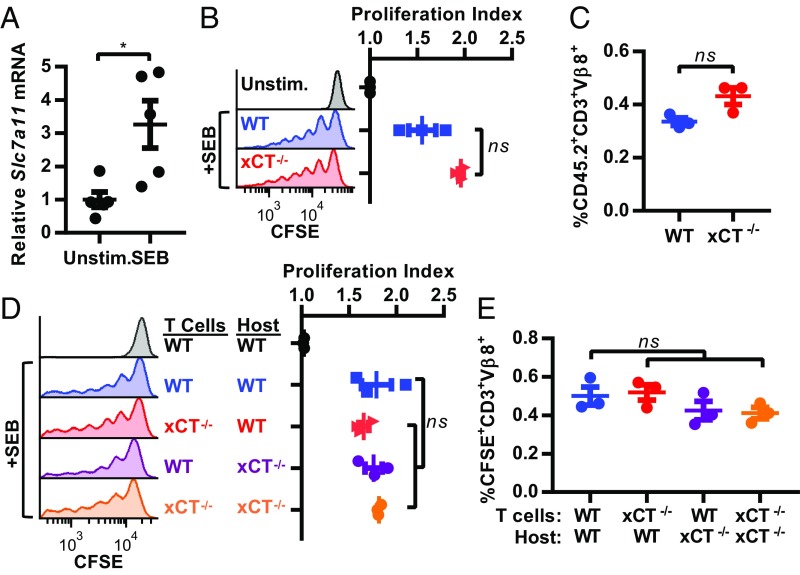
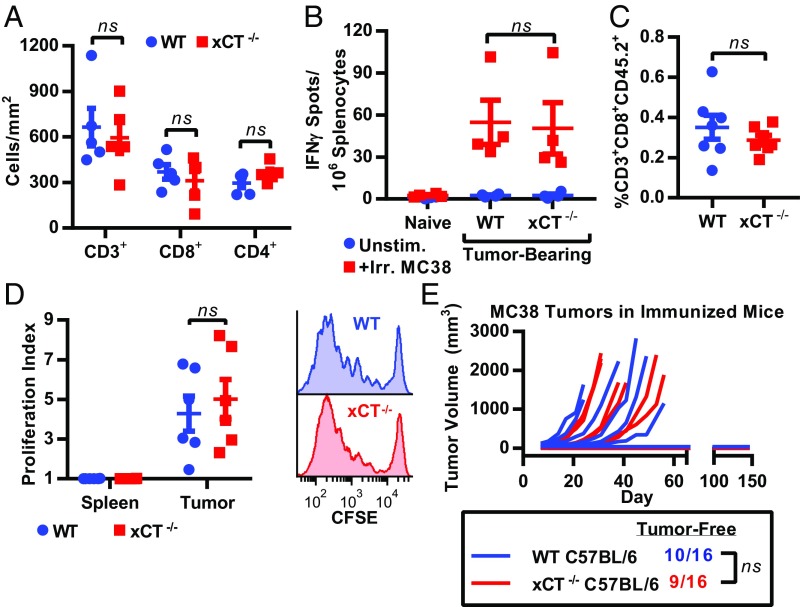
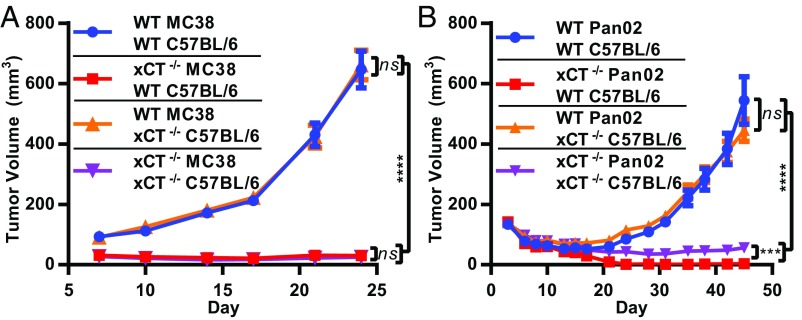
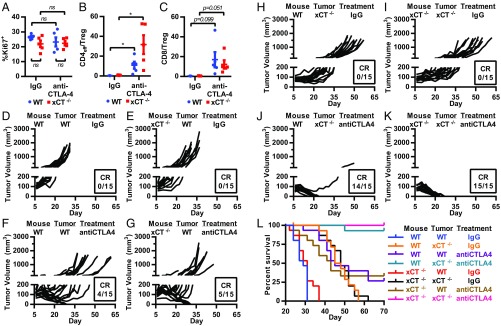
T cell-invigorating cancer immunotherapies have near-curative potential. However, their clinical benefit is currently limited, as only a fraction of patients respond, suggesting that these regimens may benefit from combination with tumor-targeting treatments. As oncogenic progression is accompanied by alterations in metabolic pathways, tumors often become heavily reliant on antioxidant machinery and may be susceptible to increases in oxidative stress. The cystine-glutamate antiporter xCT is frequently overexpressed in cancer and fuels the production of the antioxidant glutathione; thus, tumors prone to redox stress may be selectively vulnerable to xCT disruption. However, systemic inhibition of xCT may compromise antitumor immunity, as xCT is implicated in supporting antigen-induced T cell proliferation. Therefore, we utilized immune-competent murine tumor models to investigate whether cancer cell expression of xCT was required for tumor growth in vivo and if deletion of host xCT impacted antitumor immune responses. Deletion of xCT in tumor cells led to defective cystine uptake, accumulation of reactive oxygen species, and impaired tumor growth, supporting a cancer cell-autonomous role for xCT. In contrast, we observed that, although T cell proliferation in culture was exquisitely dependent on xCT expression, xCT was dispensable for T cell proliferation in vivo and for the generation of primary and memory immune responses to tumors. These findings prompted the combination of tumor cell xCT deletion with the immunotherapeutic agent anti-CTLA-4, which dramatically increased the frequency and durability of antitumor responses. Together, these results identify a metabolic vulnerability specific to tumors and demonstrate that xCT disruption can expand the efficacy of anticancer immunotherapies.

Keywords: T cells; cancer; cystine; immunotherapy; xCT.


Conflict of interest statement

Conflict of interest statement: All authors are employees and shareholders of Pfizer.

Figures

Fig. 1.
Fig. 1.
xCT promotes tumor growth. (A) Lysates from MC38 and Pan02 cells probed with anti-xCT or anti-vinculin (loading control) antibodies. (B and C) 14C-cystine uptake as measured by counts per minute and normalized to CellTiter-Glo (CTG) to account for differences in cell number. (D and E) Intracellular GSH measured after 7 h in culture by GSH-Glo, normalized to CTG, and shown relative to WT −BME. (F and G) ROS levels measured after 24 h in culture as indicated by 2',7'-dichlorodihydrofluorescein diacetate (H2DCFDA) stain. Cells were first gated on viable singlets. MFI, mean fluorescence intensity. (H and I) Proliferation was monitored by the IncuCyte imaging system, displayed as percentage confluence, and measured every 2 h. Data represent mean ± SD. One representative experiment from at least three replicates is shown. +BME indicates the addition of 100 μM BME. (J and K) Tumor cells grown in C57BL/6 mice. Each data point represents the mean tumor volume from at least 15 mice ± SEM. (BG) Unpaired two-tailed t test. (H and I) Linear regression analysis. (J and K) Nonparametric Wilcoxon rank sum test. *P < 0.05; **P < 0.01; ***P < 0.001; ****P < 0.0001.
Fig. 2.
Fig. 2.
xCT is required for T cell proliferation in vitro. (AD) Splenic T cells were isolated from WT or xCT−/− mice and stimulated with anti-CD3/anti-CD28 beads. Surface expression of CD69 (A) and CD25 (B) as measured by flow cytometry 24 h poststimulation. (C) IL-2 concentration as measure by ELISA 24 h poststimulation. Error bars represent SD. (D) Proliferation of CFSE-stained T cells 3 d poststimulation. T cells were first gated on viable singlets. One representative experiment from at least three replicates is shown. (E and F) Splenocytes from WT or xCT−/− mice were stimulated with SEB. (E) qRT-PCR for Slc7a11 normalized to Gapdh and shown relative to unstimulated (Unstim.) cells 24 h poststimulation. Error bars represent SEM. One representative experiment from two replicates is shown. (F) CFSE-stained splenocytes were stimulated with SEB, and flow cytometry was performed 4 d poststimulation. SEB-responsive T cells were identified as singlet, viable, CD3+, and Vβ8+ cells. One representative experiment from at least three independent trials is shown. *P < 0.05; ****P < 0.0001 (unpaired two-tailed t test).
Fig. 3.
Fig. 3.
xCT is not required for T cell proliferation in vivo. Mice were treated with PBS (Unstim.) or SEB. (A) RNA was extracted from Vβ8+ splenocytes 24 h posttreatment, and qRT-PCR for Slc7a11 normalized to Gapdh is shown relative to Unstim. Each point represents one mouse (n = 5). Error bars represent SEM. One representative experiment from three replicates is shown. (B and C) CFSE-stained T cells from CD45.2 mice were transferred to CD45.1 mice. Spleens were harvested 3 d posttreatment with SEB. (B) Proliferation of donor-derived T cells was measured by CFSE dilution gating on singlets, viable, CD45.2+, CD3+, and Vβ8+ cells. One representative histogram from three mice per group is shown, and the proliferation index for individual mice is shown in Right. (C) CD45.2+CD3+Vβ8+ (as analyzed in B) WT or xCT−/− T cells displayed as a percentage of all viable cells within each spleen of SEB-treated mice. (D and E) CFSE-stained T cells were transferred to WT or xCT−/− mice, and the mice were treated as in B. Cells were gated on singlets, viable, CFSE+, CD3+, and Vβ8+. One representative histogram from three mice per group is shown, and proliferation index for individual mice is shown in Right. (E) CFSE+CD3+Vβ 8+ (as analyzed in D) WT or xCT−/− T cells displayed as a percentage of all viable cells within each spleen of SEB-treated mice. Error bars represent SEM. ns, not significant; *P < 0.05 (unpaired two-tailed t test).
Fig. 4.
Fig. 4.
xCT is dispensable for antitumor immune responses. (A) MC38 tumor sections from WT or xCT−/− mice were stained by IHC for CD3+, CD8+, or CD4+ cells and are represented as cells per 1 mm2 of viable tumor tissue. Each point represents one tumor, and error bars represent SEM. (B) IFN-γ ELISPOT performed on spleens from naïve mice or mice bearing WT MC38 tumors. (C and D) B16OVA tumor-bearing CD45.1 mice received WT or xCT−/− CD45.2+ OT-I T cells. Tissues were collected 4 d posttransfer. (C) Tumor-infiltrating WT or xCT−/− OT-I T cells (identified as singlets, viable, CD3+, CD8+, and CD45.2+) displayed as a percentage of all viable cells within each tumor (n = 7 mice per group). (D) Proliferation index calculated by CFSE dilution of CD45.2+ H-2Kb/SIINFEKL Dextramer+ (OVA-reactive) T cells within spleens or tumors. CD45+ cells were enriched from tumor samples before flow cytometry. Cells were first gated on singlets, viable, CD3+, and CD8+ (n = 6 mice per group). Each point represents one mouse, and error bars represent SEM. Representative histograms from tumor-infiltrating OT-I T cells are shown to the right. ns, not significant (unpaired two-tailed t test). (E) WT or xCT−/− male mice were immunized with irradiated MC38 cells and subsequently challenged with live MC38 cells. Individual tumor growth curves are shown, and number of tumor-free mice is indicated below. ns, not significant (two-sided Fisher’s exact test).
Fig. 5.
Fig. 5.
Host xCT does not impact primary tumor growth. (A) WT MC38 or xCT−/− (clone 2-1) or (B) WT Pan02 or xCT−/− (clone 1-11) cells were grown in either WT or xCT−/− C57BL/6 mice. Each data point represents the mean from at least 19 mice ± SEM. ns, not significant; ***P < 0.001; ****P < 0.0001 (nonparametric Wilcoxon rank sum test).
Fig. 6.
Fig. 6.
Tumor cell xCT loss enhances efficacy of anti–CTLA-4. WT or xCT−/− (clone 2-1) MC38 tumor cells were grown as xenografts in WT or xCT−/− mice. Mice were dosed with IgG control or anti–CTLA-4 on days 7, 10, and 13 postimplantation. (AC) Flow cytometry on WT MC38 tumors isolated from WT or xCT−/− mice on day 14 postimplantation. (A) Ki67 staining of tumor-infiltrating CD3+ T cells. (B) CD4+ Teff to Treg cell ratio. Teff = FoxP3; Treg cell = FoxP3+CD25+. (C) CD8+ T cell to Treg cell ratio. Cells were first gated on singlet, viable, CD45+, and CD3+. Each point represents one tumor (n = 5). Error bars represent SEM. ns, not significant. *P < 0.05 (unpaired two-tailed t test). (DK) Individual tumor growth curves from each group (n = 15). (L) Kaplan–Meier survival curves of mice shown in DK.

Similar articles

Cited by

References

    1. Hodi FS, et al. Improved survival with ipilimumab in patients with metastatic melanoma. N Engl J Med. 2010;363:711–723. - PMC - PubMed
    1. Brahmer JR, et al. Safety and activity of anti-PD-L1 antibody in patients with advanced cancer. N Engl J Med. 2012;366:2455–2465. - PMC - PubMed
    1. Topalian SL, et al. Safety, activity, and immune correlates of anti-PD-1 antibody in cancer. N Engl J Med. 2012;366:2443–2454. - PMC - PubMed
    1. Pavlova NN, Thompson CB. The emerging hallmarks of cancer metabolism. Cell Metab. 2016;23:27–47. - PMC - PubMed
    1. Reczek CR, Chandel NS. The two faces of reactive oxygen species in cancer. Annu Rev Cancer Biol. 2017;1:79–98.

MeSH terms

LinkOut - more resources