. 2019 May 14;116(20):9959-9968.
doi: 10.1073/pnas.1820604116. Epub 2019 Apr 24.

Targeting the NFAT:AP-1 transcriptional complex on DNA with a small-molecule inhibitor

Affiliations

Targeting the NFAT:AP-1 transcriptional complex on DNA with a small-molecule inhibitor

Giuliana P Mognol et al. Proc Natl Acad Sci U S A. .

Abstract

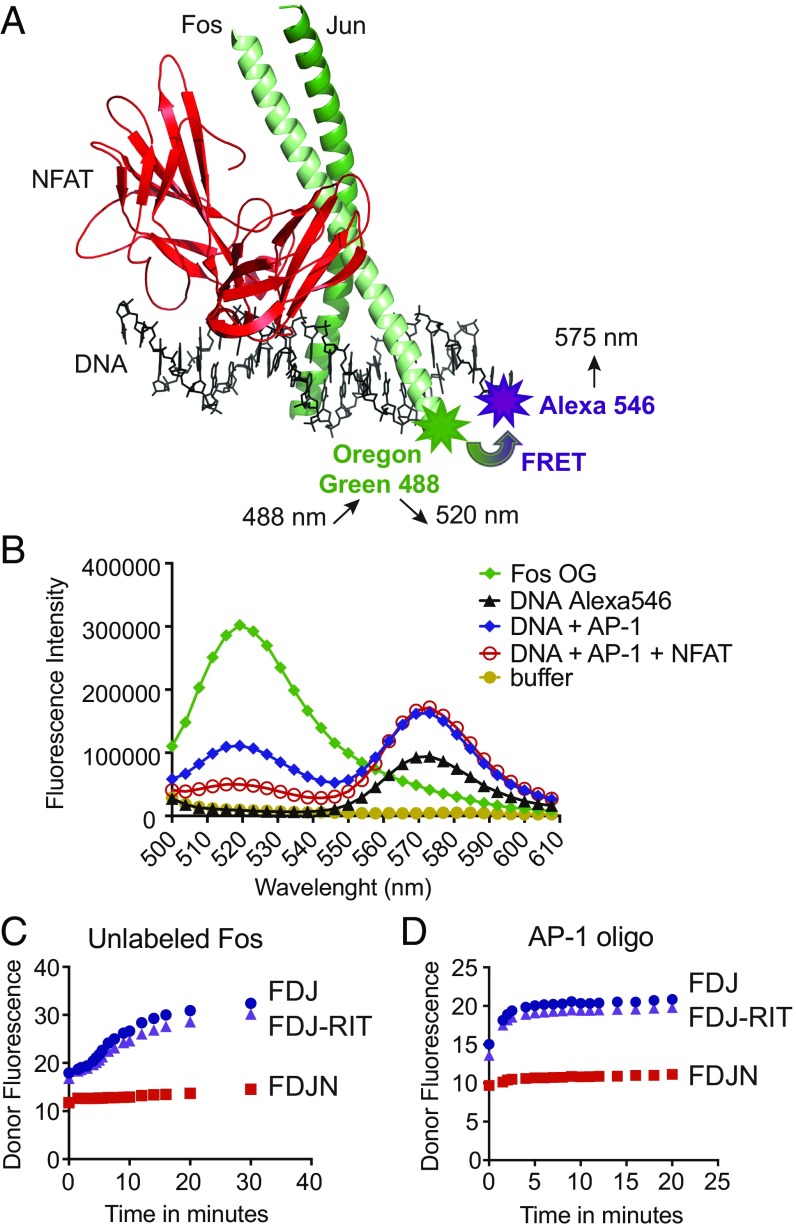
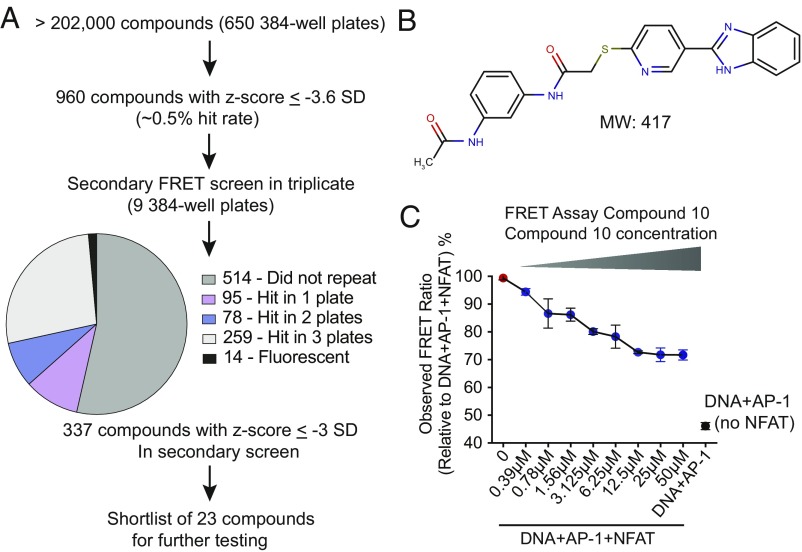
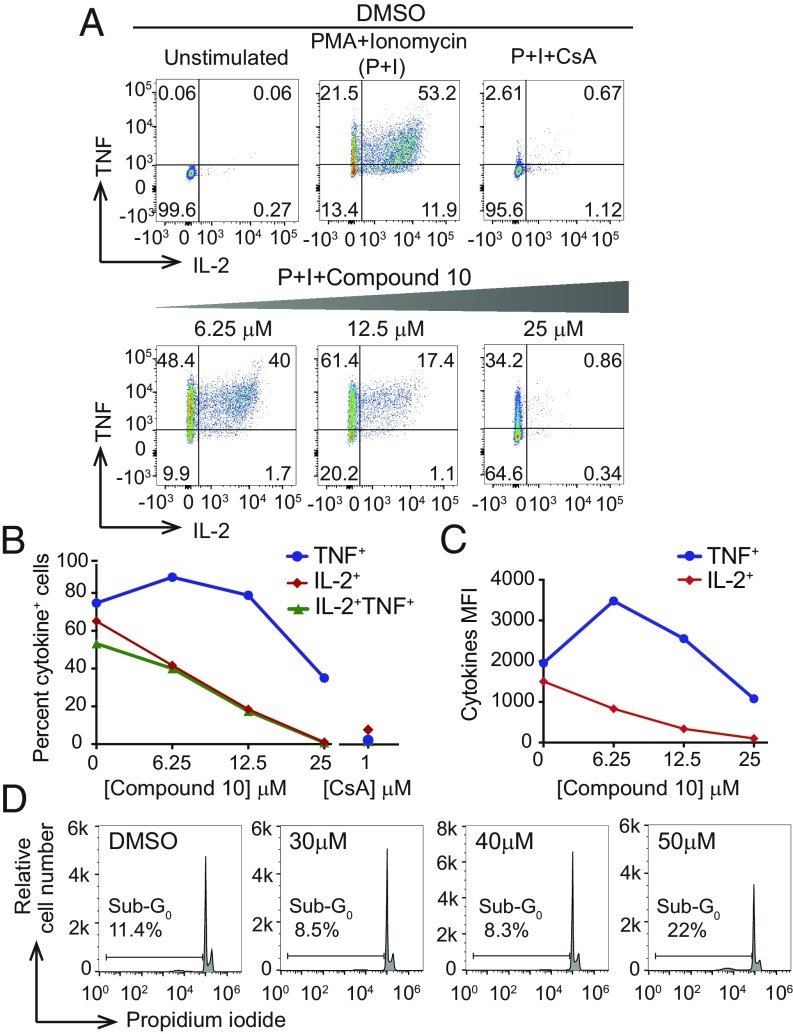
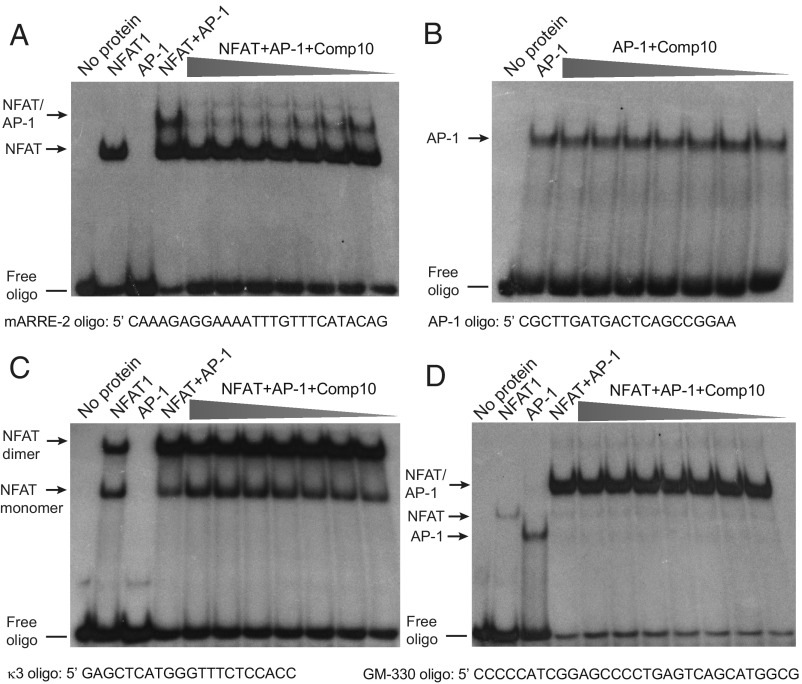
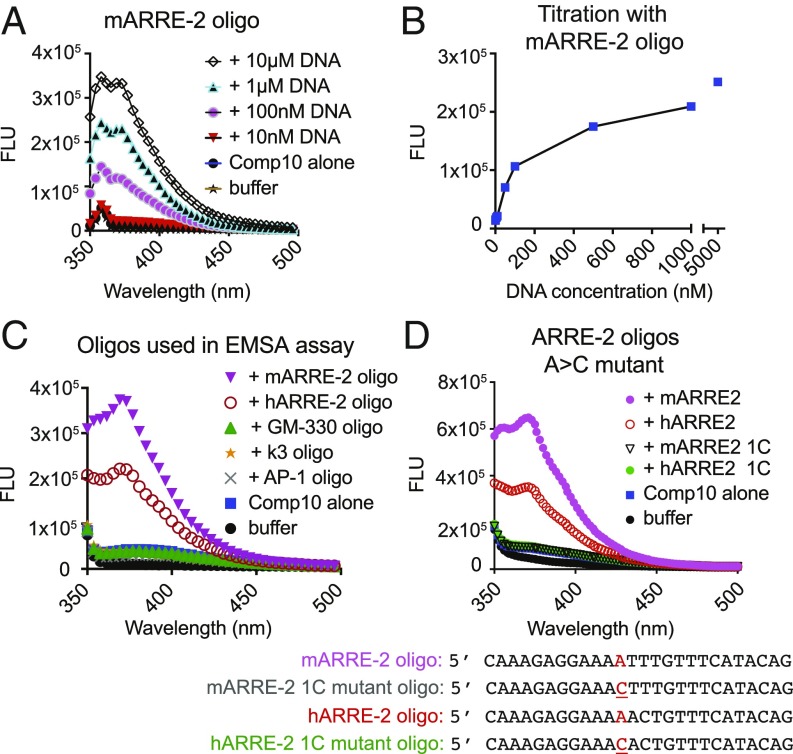
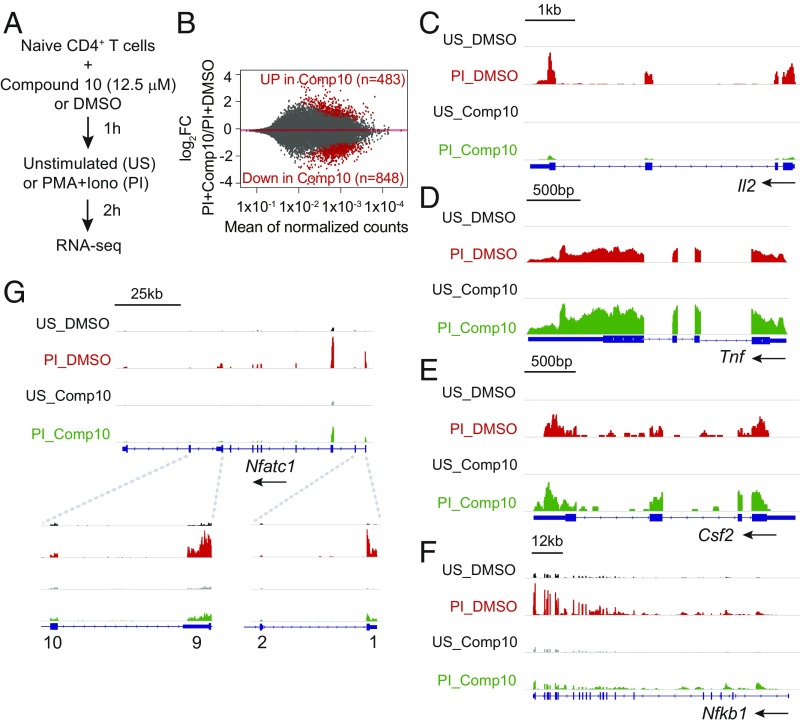
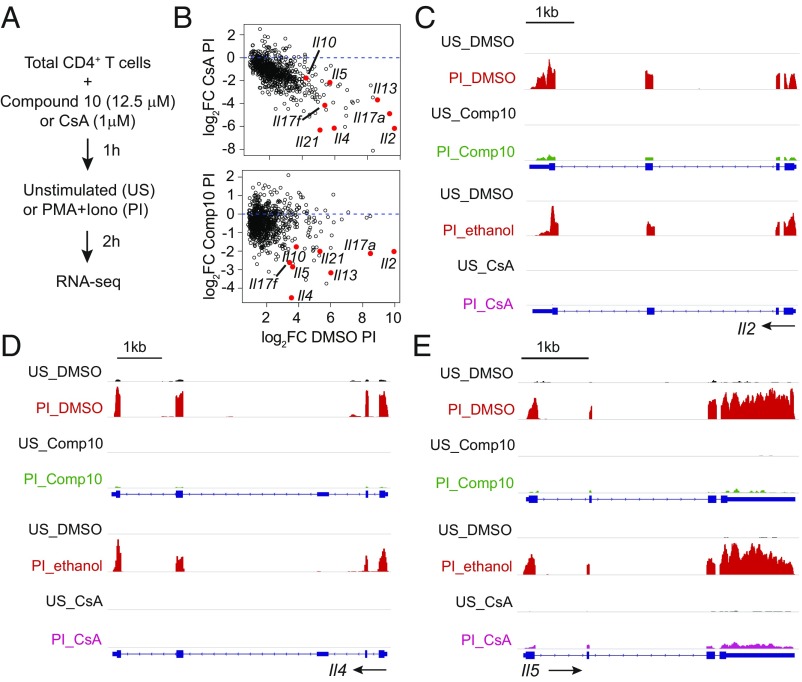
The transcription factor nuclear factor of activated T cells (NFAT) has a key role in both T cell activation and tolerance and has emerged as an important target of immune modulation. NFAT directs the effector arm of the immune response in the presence of activator protein-1 (AP-1), and T cell anergy/exhaustion in the absence of AP-1. Envisioning a strategy for selective modulation of the immune response, we designed a FRET-based high-throughput screen to identify compounds that disrupt the NFAT:AP-1:DNA complex. We screened ∼202,000 small organic compounds and identified 337 candidate inhibitors. We focus here on one compound, N-(3-acetamidophenyl)-2-[5-(1H-benzimidazol-2-yl)pyridin-2-yl]sulfanylacetamide (Compound 10), which disrupts the NFAT:AP-1 interaction at the composite antigen-receptor response element-2 site without affecting the binding of NFAT or AP-1 alone to DNA. Compound 10 binds to DNA in a sequence-selective manner and inhibits the transcription of the Il2 gene and several other cyclosporin A-sensitive cytokine genes important for the effector immune response. This study provides proof-of-concept that small molecules can inhibit the assembly of specific DNA-protein complexes, and opens a potential new approach to treat human diseases where known transcription factors are deregulated.

Keywords: FRET assay; Fos; Jun; NFAT; cyclosporin A.


Conflict of interest statement

Conflict of interest statement: A.R. and P.G.H. are founders of CalciMedica, Inc., and members of its scientific advisory board.

Figures

Fig. 1.
Fig. 1.
Design of the FRET assay. (A) Structure of the NFAT:AP-1 complex bound to the ARRE-2 element of the murine IL-2 promoter (PDB ID code 1A02). The DBD of NFAT (red) is in contact with the AP-1 dimer of Fos (light green) and Jun (dark green). The NFAT site in the ARRE-2 oligonucleotide is a consensus binding site for NFAT, whereas the AP-1 site is a nonconsensus site that differs appreciably from the consensus AP-1 site TGAC/GTCA. Modified from figure 2 in ref. . Fos was labeled with the donor fluorophore Oregon Green 488 maleimide. The 3′ end of the sense strand of the ARRE-2 DNA oligonucleotide was labeled with the acceptor fluorophore Alexa-546. (B) Fluorescence emission scan of the donor Fos-OG alone (emission peak at 520 nm, green curve), the acceptor DNA-Alexa 546 alone (emission peak at 575 nm, black curve), and the indicated protein–DNA complexes (blue and red curves). The assay was excited at 488 nm; concentrations used were 20 nM Alexa-546–labeled ARRE-2–DNA, 20 nM Fos-OG, 20 nM Jun, and 40 nM NFAT1 DBD. (C and D) Dissociation kinetics of the loosely bound Fos:Jun:DNA (FJD) and Fos:Jun:DNA:NFAT-RIT (FJD-RIT) complexes versus the cooperatively bound Fos:Jun:DNA:NFAT (FJDN) complex upon the addition of 200 nM unlabeled Fos (C) or 20 nM consensus AP-1 oligonucleotide (D). The initial complexes had been assembled from 20 nM Fos-OG, 20 nM ARRE-2–Alexa546 DNA, and 20 nM Jun, with the inclusion of 40 nM wild-type NFAT DBD or 40 nM NFAT-RIT DBD where indicated. Donor fluorescence is plotted. The assay was read using a Synergy 2 (Biotek) plate reader with 485/20-nm and 528/20-nm filters for excitation and emission, respectively.
Fig. 2.
Fig. 2.
Results of the high-throughput FRET assay, selection and structure of Compound 10. (A) Summary of the high-throughput NFAT-AP1 inhibitor screen and flowchart of compound selection. (B) Structure of Compound 10 (PubChem ID: 1432799). (C) Concentration-dependent inhibition of the FRET signal by Compound 10. The results are plotted as observed FRET ratio (acceptor fluorescence/donor fluorescence) relative to the FRET ratio of wells containing the complete assay mix without Compound 10. Red symbol, control wells containing the complete assay mix (10 nM ARRE-2–Alexa-546, 10 nM Fos-OG, 10 nM Jun, and 20 nM NFAT); black symbol, control wells with NFAT omitted; blue symbols, wells with complete assay mix and the indicated concentrations of Compound 10. IC50 = ∼2 μM.
Fig. 3.
Fig. 3.
Compound 10 inhibits production of the cytokines IL-2 and TNF by total CD4+ murine T cells under conditions where it is not toxic to the cells. Primary murine CD4+ T cells were incubated in the absence (DMSO control) or presence of the indicated concentrations of Compound 10 for 1 h, then either left unstimulated or stimulated with 10 nM PMA and 500 nM ionomycin for an additional 4 h. Where indicated, 1 μM of CsA was added 15 min before stimulation. (AC) After stimulation, the cells were fixed, washed, permeabilized, and assessed for cytokine production by intracellular staining and flow cytometry. (B) Percentage of cells in A expressing IL-2, TNF, or both cytokines. (C) Mean fluorescent intensities (MFI) for the individual cytokines in cells scored as positive in A. (D) Toxicity was assessed by propidium iodide staining and flow cytometry. Cells were treated with Compound 10 as above, then stimulated with PMA and ionomycin for 4 h. The sub-G0 population is indicated in each panel. Under these conditions, cells treated with 30 or 40 μM of Compound 10 showed no increase in the sub-G0 population, whereas cells treated with 50 μM Compound 10 showed a twofold increase compared with untreated cells. The data are representative of at least two independent experiments.
Fig. 4.
Fig. 4.
Compound 10 inhibits formation of the quaternary NFAT:Fos:Jun:DNA complex on the ARRE-2 site, but not on the GM-330 element, without inhibiting the direct binding of NFAT or AP-1 to DNA. 500 nM of Fos and 500 nM of Jun proteins were incubated with 20,000 CPMs of the indicated [γ32P] ATP-labeled oligos in the absence or in the presence of Compound 10 (concentrations: 250, 125, 62.5, 31.3, 15.6, 7.8, and 3.9 μM, respectively) for 10 min, then 10 nM of wild-type NFAT DBD or NFAT-RIT DBD was added for a further 20 min. DNA–protein complexes were analyzed by EMSA and are indicated by the arrows. Results are representative of at least two independent experiments. (A) Compound 10 inhibits formation of the quaternary NFAT:Fos:Jun:DNA complex on the murine ARRE-2 element. (B) Compound 10 does not inhibit binding of AP-1 (Fos:Jun heterodimers) to the consensus AP-1 binding site. (C) Compound 10 does not inhibit binding of NFAT monomers or dimers to the TNF κ3 element. (D) Compound 10 does not inhibit formation of the quaternary NFAT:Fos:Jun:DNA complex on the GM-330 GM-CSF enhancer element.
Fig. 5.
Fig. 5.
Compound 10 binds to DNA. Fluorescence emission of Compound 10 (50 nM) alone or in the presence of the indicated oligonucleotides. The emission peak of Compound 10 bound to DNA is at ∼370 nm. Excitation wavelength, 310 nm or 320 nm. FLU, fluorescence units. Results are representative of at least two independent experiments. (A) Compound 10 binds to the murine ARRE-2 oligonucleotide in a concentration-dependent manner. Excitation was at 320 nm for this experiment, and the sharp early peak at 360 nm in these scans is the expected Raman peak due to scattering from water. In the remaining figure panels, excitation was at 310 nm, and therefore the Raman peak was observed just below 350 nm. (B) Titration of Compound 10 (50 nM) with increasing concentrations of the murine ARRE-2 oligo. DNA concentrations: 0, 10, 50, 100, 500 nM; 1 and 5 μM, respectively. Fluorescence emission was read at 377 nm. (C) Compound 10 binds to the murine and human ARRE-2 oligonucleotides, but not to the AP-1 consensus, TNF κ3 element and GM-330 site from GM-CSF enhancer, used for EMSA assays. All oligonucleotides were present at 500 nM. (D) A single A > C substitution that interrupts a stretch of adenines and thymines abrogates binding of Compound 10 to the mouse and human ARRE-2 oligonucleotides (500 nM).
Fig. 6.
Fig. 6.
Transcription profile regulated by Compound 10 in naïve CD4+ T cells. (A) Schematic representation of the RNA-seq assay. Sorted naïve CD4+ T cells were preincubated with Compound 10 or DMSO for 1 h, then left unstimulated (US) or stimulated with PMA (10 nM) and ionomycin (500 nM) (PI) for 2 h. (B) MA plots indicating the number of genes up-regulated (483) or down-regulated (848) by Compound 10 in stimulated naïve CD4+ T cells (PI+Compound 10) versus DMSO control (PI+DMSO). The y axis indicates the log2FC in expression of individual mRNAs in the PI+Compound 10 condition compared with the PI+DMSO condition. Genes scored as significantly up-regulated or down-regulated, with FDR threshold = 0.05, are represented by red symbols. (CG) Genome browser views of RNA-seq signal at the Il2, Tnf, Csf2, Nfkb1, and Nfatc1 loci in unstimulated (US) and stimulated (PI) conditions, in the absence (DMSO) or in the presence (Comp10) of Compound 10, as indicated. Blue boxes correspond to exons, and arrows indicate the direction of transcription.
Fig. 7.
Fig. 7.
Comparing the effects of Compound 10 and CsA on T cell transcription. (A) Schematic representation of the RNA-seq assay. Total CD4+ T cells were preincubated with Compound 10 (12.5 μM) or DMSO for 1 h, or, in an independent experiment, with ethanol or CsA (1 μM) for 15 min, then left unstimulated (US) or stimulated with PMA (10 nM) and ionomycin (500 nM) (PI) for 2 h. (B) MA plots showing the effect of either CsA or Compound 10 on the genes that were induced by PMA and Ionomycin in both experiments. (CE) Genome browser views of RNA-seq signals at the Il2, Il4, and Il5 loci in unstimulated (US) and stimulated (PI) conditions. The three genes were up-regulated by PMA+ionomycin in the vehicle control samples (DMSO or ethanol, red), and their up-regulation was inhibited in the presence of Compound 10 (green) or CsA (pink). Blue boxes correspond to exons, and arrows indicate the direction of transcription.

References

    1. Rao A, Luo C, Hogan PG. Transcription factors of the NFAT family: Regulation and function. Annu Rev Immunol. 1997;15:707–747. - PubMed
    1. Hogan PG, Chen L, Nardone J, Rao A. Transcriptional regulation by calcium, calcineurin, and NFAT. Genes Dev. 2003;17:2205–2232. - PubMed
    1. Macian F. NFAT proteins: Key regulators of T-cell development and function. Nat Rev Immunol. 2005;5:472–484. - PubMed
    1. Baksh S, DeCaprio JA, Burakoff SJ. Calcineurin regulation of the mammalian G0/G1 checkpoint element, cyclin dependent kinase 4. Oncogene. 2000;19:2820–2827. - PubMed
    1. Jauliac S, et al. The role of NFAT transcription factors in integrin-mediated carcinoma invasion. Nat Cell Biol. 2002;4:540–544. - PubMed

Publication types

MeSH terms