. 2019 May 7;116(19):9616-9621.
doi: 10.1073/pnas.1819374116. Epub 2019 Apr 24.

Nanoscale imaging reveals miRNA-mediated control of functional states of dendritic spines

Affiliations

Nanoscale imaging reveals miRNA-mediated control of functional states of dendritic spines

Ikbum Park et al. Proc Natl Acad Sci U S A. .

Abstract

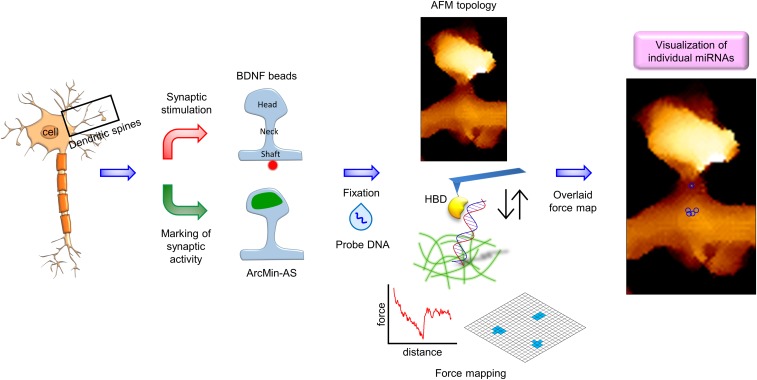
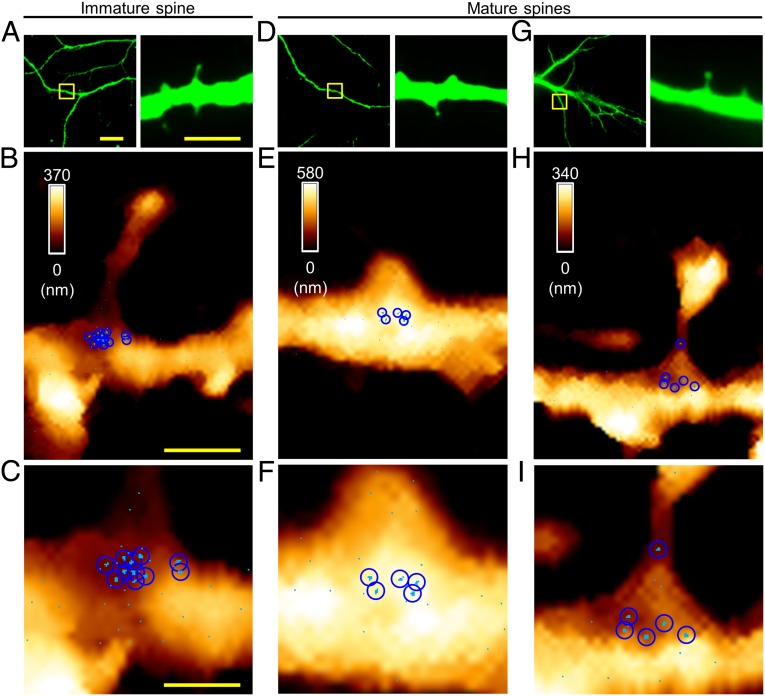
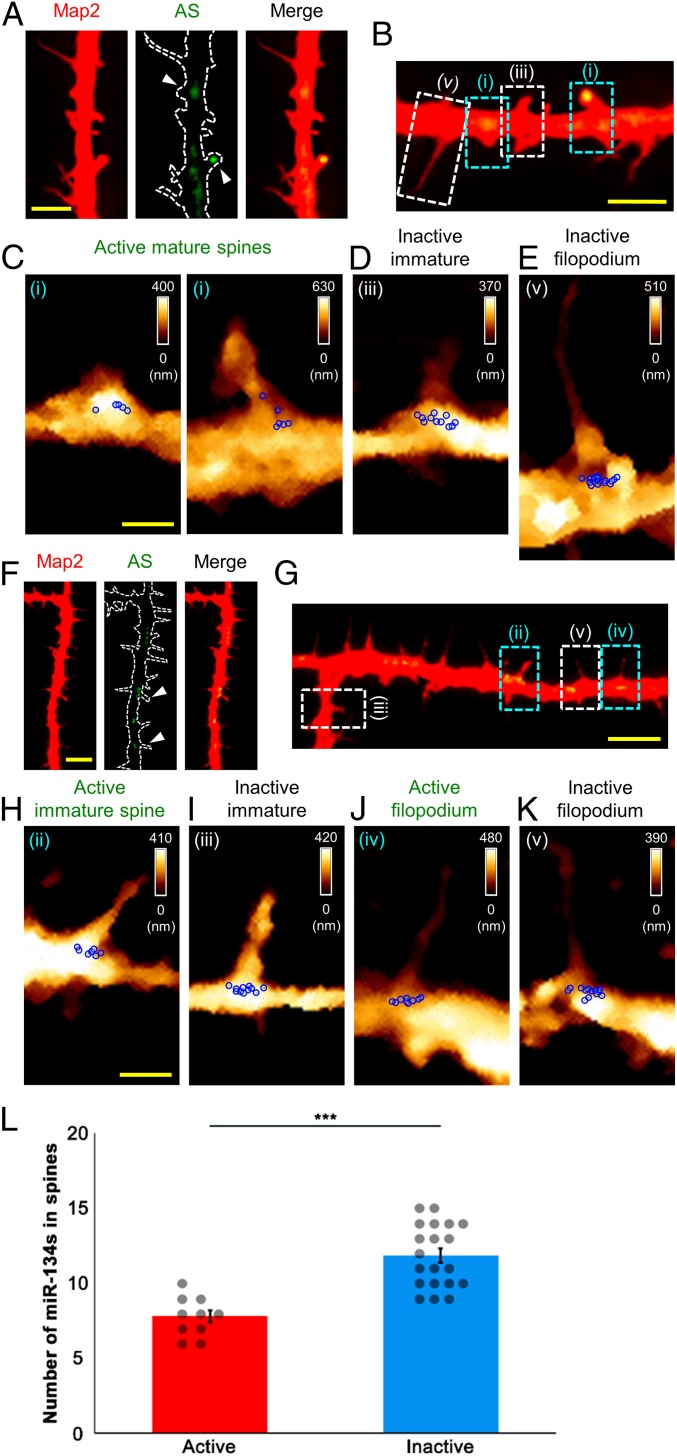
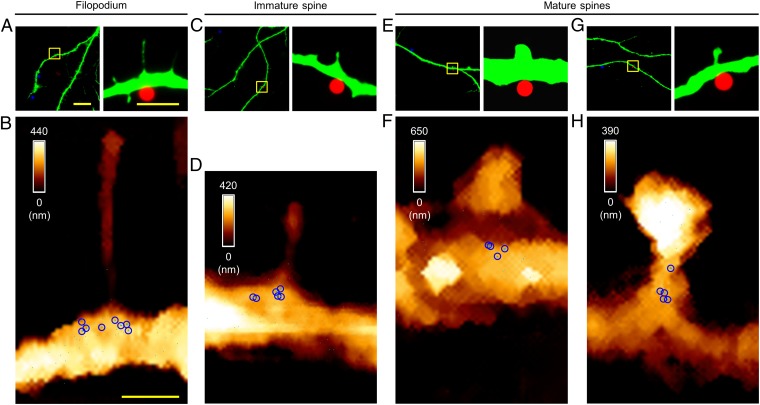
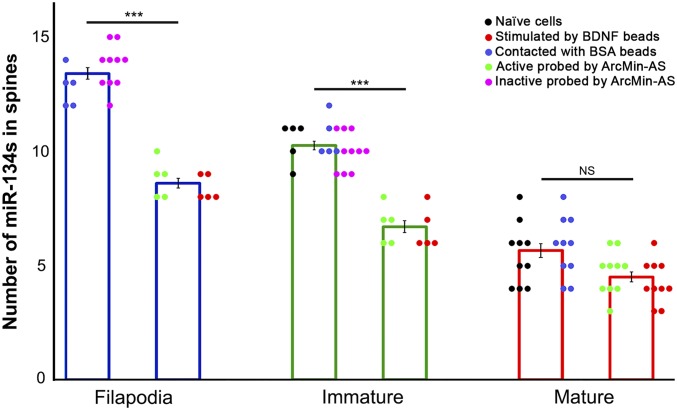
Dendritic spines are major loci of excitatory inputs and undergo activity-dependent structural changes that contribute to synaptic plasticity and memory formation. Despite the existence of various classification types of spines, how they arise and which molecular components trigger their structural plasticity remain elusive. microRNAs (miRNAs) have emerged as critical regulators of synapse development and plasticity via their control of gene expression. Brain-specific miR-134s likely regulate the morphological maturation of spines, but their subcellular distributions and functional impacts have rarely been assessed. Here, we exploited atomic force microscopy to visualize in situ miR-134s, which indicated that they are mainly distributed at nearby dendritic shafts and necks of spines. The abundance of miR-134s varied between morphologically and functionally distinct spine types, and their amounts were inversely correlated with their postulated maturation stages. Moreover, spines exhibited reduced contents of miR-134s when selectively stimulated with beads containing brain-derived neurotropic factor (BDNF). Taken together, in situ visualizations of miRNAs provided unprecedented insights into the "inverse synaptic-tagging" roles of miR-134s that are selective to inactive/irrelevant synapses and potentially a molecular means for modifying synaptic connectivity via structural alteration.

Keywords: atomic force microscopy; dendritic spines; force mapping; microRNAs; structural plasticity.


Conflict of interest statement

The authors declare no conflict of interest.

Figures

Fig. 1.
Fig. 1.
The experimental scheme for activity-dependent miRNA detection at single dendritic spines using single-molecule adhesion of HBD. (Left) For nanoscale visualization of individual miRNAs, single spines are stimulated with BDNF-coated beads or functional states of spines are labeled with ArcMin-AS. (Middle) Fluorescence and topology images are obtained to classify dendritic spine types. Force maps of entire spine regions are generated using an HBD-tethering AFM tip. (Right) Spine topology and force maps are overlaid in a final map. As a result, miRNAs appear in a cluster of positive pixels on the adhesion force map.
Fig. 2.
Fig. 2.
Visualization of miR-134s at individual spines. (A) Fluorescence images showing an immature spine (DIV14); the boxed area (Left) is shown at higher magnification (Right); MAP2, green. (B) AFM topographic image (3.0 × 4.0 μm2) of the boxed area in A and the force map showing individual miR-134/DNA hybrids. (C) Magnified force map of the dendritic shaft region in B. (D and G) Fluorescence images showing mature spines; the boxed areas (Left) are shown at higher magnification (Right). (E and H) AFM topographic images and overlaid force maps (3.0 × 4.0 μm2) of the boxed areas in D and G. (F and I) Magnified force maps in E and H; a sky-blue pixel represents a location where specific unbinding events were observed in more than two out of five measurements (pixel size, 10 nm); a blue circle indicates a cluster corresponding to the hydrodynamic radius observed at high resolution. [Scale bars: 20 μm (A, Left), 5.0 μm (A, Right), 1.0 μm (B), 0.50 μm (C). The scale bar for the fluorescence images in D and G is the same as that for the corresponding image in A; the scale bar for the AFM maps in E, F, H, and I is same as that for the corresponding maps in B and C.]
Fig. 3.
Fig. 3.
Mapping of miR-134s at spontaneously active filopodia and dendritic spines labeled with ArcMin-AS. (A, B, F, and G) Fluorescence images of filopodia and dendritic spines (DIV14); AS, ArcMin-AS. Each arrowhead indicates active filopodium and dendritic spines. (B and G) Active mature (i) and immature spine (ii) and filopodium (iv), and inactive immature spine (iii) and filopodium (v). (CE and HK); AFM topographic images and force maps were obtained for the boxed areas in B and G (3.0 × 5.0 μm2 or 3.0 × 5.5 μm2). (L) Numbers of miR-134s for active filopodia and immature spines vs. those for inactive filopodia and immature spines (two tailed t test, ***P < 0.001). [Scale bars: 20 μm (A and F), 5.0 μm (B and G), 1.0 μm (C and H). The scale bar for the AFM maps in D, E, I, J, and K are the same as those for the corresponding maps C or H.]
Fig. 4.
Fig. 4.
Mapping of miR-134s at filopodia and dendritic spines stimulated with BDNF-coated beads. (A) Fluorescence images of a filopodium (DIV14); the boxed area (Left) is shown at higher magnification (Right), where a BDNF-coated bead (in red) is seen in contact with the dendrite (MAP2, green). (B) AFM topographic image of the boxed area in A (3.0 × 5.0 μm2) overlaid with the force map for the stimulated filopodium. (C) Fluorescence images of an immature spine. (D) AFM topographic image of the boxed area in C (3.0 × 4.0 μm2) overlaid with the force map for the stimulated immature spine. (E and G) Fluorescence images of mature spines. (F and H) AFM topographic images of the boxed areas in E and G (3.0 × 5.0 μm2) overlaid with the force maps for the stimulated mature spines; BSA-coated beads are shown in blue, to the left in A, C, E, and G. [Scale bars: 20 μm (A, Left), 5.0 μm (A, Right), 1.0 μm (B). The scale bar for the fluorescence images in C, E, and G is same as that for the corresponding image in A, and the scale bar for the AFM maps in D, F, and H is same as that for the corresponding map in B.]
Fig. 5.
Fig. 5.
Numbers of miR-134 clusters at filopodia and various types of dendritic spines; miR-134s associated with filopodia and various spine types were quantified under each condition (n ≥ 5 spines); naïve cells refer to untreated spines; error bars indicate the SEM (***P < 0.001 via one-way ANOVA followed by a Tukey’s post hoc test; NS, not significant).

Similar articles

Cited by

References

    1. Hering H, Sheng M. Dendritic spines: Structure, dynamics and regulation. Nat Rev Neurosci. 2001;2:880–888. - PubMed
    1. Yuste R. Dendritic spines and distributed circuits. Neuron. 2011;71:772–781. - PMC - PubMed
    1. Rogerson T, et al. Synaptic tagging during memory allocation. Nat Rev Neurosci. 2014;15:157–169. - PMC - PubMed
    1. Araya T, et al. CLE-CLAVATA1 peptide-receptor signaling module regulates the expansion of plant root systems in a nitrogen-dependent manner. Proc Natl Acad Sci USA. 2014;111:2029–2034. - PMC - PubMed
    1. Bosch M, Hayashi Y. Structural plasticity of dendritic spines. Curr Opin Neurobiol. 2012;22:383–388. - PMC - PubMed

Publication types

LinkOut - more resources