. 2019 Apr 24;9(1):6362.
doi: 10.1038/s41598-019-42945-w.

Ensuring expression of four core cardiogenic transcription factors enhances cardiac reprogramming

Affiliations

Ensuring expression of four core cardiogenic transcription factors enhances cardiac reprogramming

Zhentao Zhang et al. Sci Rep. .

Abstract

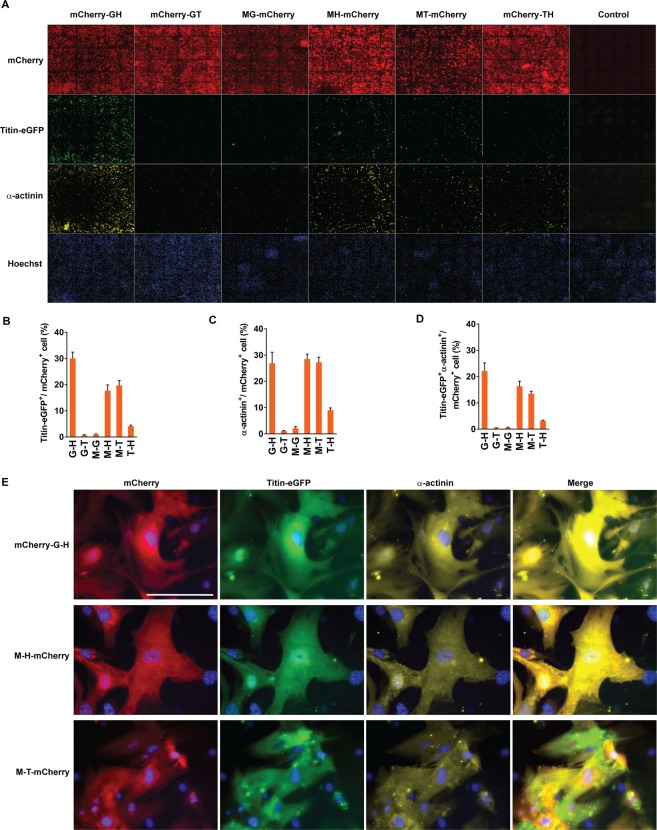
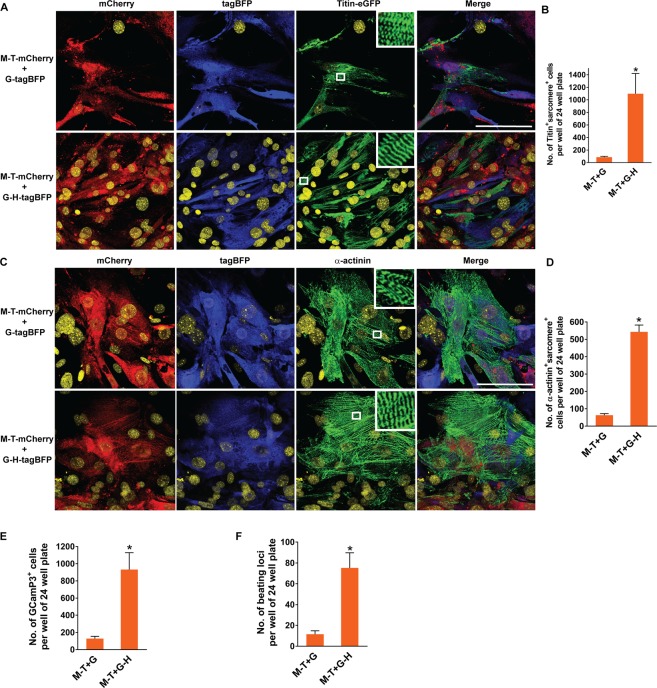
Previous studies have shown that forced expression of core cardiogenic transcription factors can directly reprogram fibroblasts to induced cardiomyocyte-like cells (iCMs). This cardiac reprogramming approach suggests a potential strategy for cardiomyocyte regeneration. However, a major challenge of this approach remains the low conversion rate. Here, we showed that ensuring expression of four cardiogenic transcription factors (i.e. Gata4 (G), Hand2 (H), Mef2c (M), and Tbx5 (T)) in individual fibroblasts is an initial bottleneck for cardiac reprogramming. Following co-transduction of three or four retroviral vectors encoding individual cardiogenic transcription factors, only a minor subpopulation of cells indeed expressed all three (GMT) or four (GHMT) factors. By selectively analyzing subpopulations of cells expressing various combinations of reprogramming factors, we found that co-expression of GMT in individual fibroblasts is sufficient to induce sarcomeric proteins. However, only a small fraction of those cells expressing GMT were able to develop organized sarcomeric structures and contractility. In contrast, ensuring expression of GHMT markedly enhanced the development of contractile cardiac structures and functions in fibroblasts, although its incremental effect on sarcomeric protein induction was relatively small. Our findings provide new insights into the mechanistic basis of inefficient cardiac reprogramming and can help to devise efficient reprogramming strategies.


Conflict of interest statement

The authors declare no competing interests.

Figures

Figure 1
Figure 1
Co-expression efficiency following simultaneous transducing different numbers of retroviral vectors encoding individual reprogramming factors tagged with a distinct fluorescent reporter. MEFs were transduced with indicated vectors. Expression of reprogramming factors was analyzed by expression of tagged fluorescent reporters using flow cytometry. (A) Representative flow cytometry analysis showing expression efficiency following a single vector transduction. The number indicates the percentage of cells expressing a single factor following single vector transduction. (B) Representative flow cytometry analysis showing co-expression efficiency for two factors following simultaneous transduction of two vectors. The number in the red box indicates the percentage of cells expressing both factors. (C) Representative flow cytometry analysis showing co-expression efficiency for three factors following simultaneous transduction of three vectors. The number in the red box indicates the percentage of cells expressing two factors following transduction of three vectors. The top number in the blue box indicates the percentage of cells expressing the third factor among cells expressing two factors indicated by red box. The bottom number in the blue box indicates the percentage of cells expressing all three factors in the whole cell population (37.2 × 0.965 = 35.8%). (D) Representative flow cytometry analysis showing co-expression efficiency for four factors following simultaneous transduction of four vectors. The number in the red box indicates the percentage of cells expressing two factors following transduction of four vectors. The top number in the blue box indicates the percentage of cells expressing the other two factors among the cellular population expressing the two factors indicated by red box. The bottom number in the blue box indicates the percentage of cells expressing all four factors in the whole cell population (38.1 × 0.862 = 32.8%). (E) A summary graph of co-expressing efficiency for indicated number(s) of factors. Data from three or four independent experiments are presented as means ± s.d.
Figure 2
Figure 2
Cardiac reprogramming by combinations of two cardiogenic transcription factors. (A) Representative immunofluorescent images used for high content imaging analyses to quantify Titin-eGFP and/or α-actinin expression following transduction of tri-cistronic vectors harboring various combinations of two cardiogenic transcription factors and mCherry. The indicated vectors were transduced into MEFs isolated from Titin-eGFP reporter knock-in mice. Immunofluorescence staining followed by high content imaging analyses was performed at day 15 after transduction. Each panel shows a composition of 36 images taken by 10X objective in the high content imaging system. (BD) Summary of high content imaging analyses for the percentage of Titin-eGFP+ (B), α-actinin+ (C), or Titin-eGFP+ and α-actinin+ (D) cells among cells expressing various combinations of two reprogramming factors. Three independent experiments are presented as mean ± s.d. (E) Representative high magnification views of immunofluorescent images of the cells analyzed by a high content imaging system. Sarcomere protein induction in mCherry-G-H, M-H-mCherry, and M-T-mCherry expressing cells was shown. Scale bar, 100 µM.
Figure 3
Figure 3
Quantification of sarcomeric protein induction in GMT or GHMT expressing fibroblasts by high content imaging analyses. (A) Representative immunofluorescent images used for high content imaging analyses to quantify Titin-eGFP expression following M-T-mCherry and G-tagBFP or G-H-tagBFP transduction. The indicated combinations of vectors were transduced into MEFs isolated from Titin-eGFP reporter knock-in mice. Immunofluorescence staining followed by high content imaging analyses was performed at day 15 post-transduction. Each panel shows a composition of 20 images taken by the 10X objective in the high content imaging system. (B) Summary of high content imaging analyses for the percentage of Titin-eGFP+ cells among cells expressing GMT or GHMT. Six independent experiments are presented as mean ± s.d. P > 0.5. (C) Representative immunofluorescent images used for high content imaging analyses to quantify α-actinin expression following M-T-mCherry and G-tagBFP or G-H-tagBFP transduction into MEFs. The indicated combinations of vectors were transduced into MEFs isolated from wild type mice. Immunofluorescence staining followed by high content imaging analyses was performed at day 15 post-transduction. Each panel shows a composition of 36 images taken by the 10X objective in the high content imaging system. (D) Summary of high content imaging analyses for the percentage of α-actinin+ cells among cells expressing GMT or GHMT. Six independent experiments are presented as mean ± s.d. *P < 0.05.
Figure 4
Figure 4
Structural and functional quality of the iCMs derived from GMT or GHMT expressing fibroblasts. (A) Immunofluorescence staining of M-T-mCherry and G-tagBFP or G-H-tagBFP transduced Titin-eGFP reporter MEFs for mCherry (red), tagBFP (blue), and Titin-eGFP (green). The indicated combinations of vectors were transduced into MEFs isolated from Titin-eGFP reporter knock-in mice. Immunofluorescence staining was performed at day 15 post-transduction. White boxes are enlarged in insets to demonstrate M-band structures in the sarcomere. Nuclei are stained with DRAQ5 (yellow). Scale bar, 100 µM. (B) Quantification of well-organized sarcomere+ cells identified by visualizing M-band structures with Titin-eGFP expression after M-T-mCherry and G-tagBFP or G-H-tagBFP transduction. Well-organized sarcomeric structures were counted on 40X fields of epifluorescent microscope. Four independent experiments are presented as mean ± s.d. *P < 0.05. (C) Immunofluorescence staining of M-T-mCherry and G-tagBFP or G-H-tagBFP transduced wild type MEFs for mCherry (red), tagBFP (blue), and α-actinin (green). Immunofluorescence staining was performed at day 15 post-transduction. White boxes are enlarged in insets to demonstrate Z-band structures in the sarcomere. Scale bar, 100 µM. (D) Quantification of well-organized sarcomere+ cells identified by visualizing Z-band structures with α-actinin expression after M-T-mCherry and G-tagBFP or G-H-tagBFP transduction. Four independent experiments are presented as mean ± s.d. *P < 0.0001. (E) Quantification of GCaMP3+ cells following M-T-mCherry and G-tagBFP or G-H-tagBFP transduction into MEFs isolated from αMHC-Cre: Rosa26-GCaMP3 mice. Calcium oscillation identified by flashing green fluorescence was counted on 20X fields of epifluorescent microscope at day 20 or 21 post-transduction. Eight independent experiments are presented as mean ± s.d. *P < 0.005. (F) Quantification of spontaneously beating loci following M-T-mCherry and G-tagBFP or G-H-tagBFP transduction. Beating loci were counted at day 18 or D19 post- transduction. Four independent experiments are presented as mean ± s.d. *P < 0.01.

Similar articles

Cited by

References

    1. Takahashi K, Yamanaka S. Induction of pluripotent stem cells from mouse embryonic and adult fibroblast cultures by defined factors. Cell. 2006;126:663–676. doi: 10.1016/j.cell.2006.07.024. - DOI - PubMed
    1. Choi J, et al. MyoD converts primary dermal fibroblasts, chondroblasts, smooth muscle, and retinal pigmented epithelial cells into striated mononucleated myoblasts and multinucleated myotubes. Proc Natl Acad Sci USA. 1990;87:7988–7992. doi: 10.1073/pnas.87.20.7988. - DOI - PMC - PubMed
    1. Xie H, Ye M, Feng R, Graf T. Stepwise reprogramming of B cells into macrophages. Cell. 2004;117:663–676. doi: 10.1016/S0092-8674(04)00419-2. - DOI - PubMed
    1. Zheng JL, Gao WQ. Overexpression of Math1 induces robust production of extra hair cells in postnatal rat inner ears. Nat Neurosci. 2000;3:580–586. doi: 10.1038/75753. - DOI - PubMed
    1. Izumikawa M, et al. Auditory hair cell replacement and hearing improvement by Atoh1 gene therapy in deaf mammals. Nat Med. 2005;11:271–276. doi: 10.1038/nm1193. - DOI - PubMed

Publication types

MeSH terms

LinkOut - more resources