. 2019 Apr 24;9(1):6478.
doi: 10.1038/s41598-019-42981-6.

Glucagon reduces airway hyperreactivity, inflammation, and remodeling induced by ovalbumin

Affiliations

Glucagon reduces airway hyperreactivity, inflammation, and remodeling induced by ovalbumin

Daniella B R Insuela et al. Sci Rep. .

Abstract

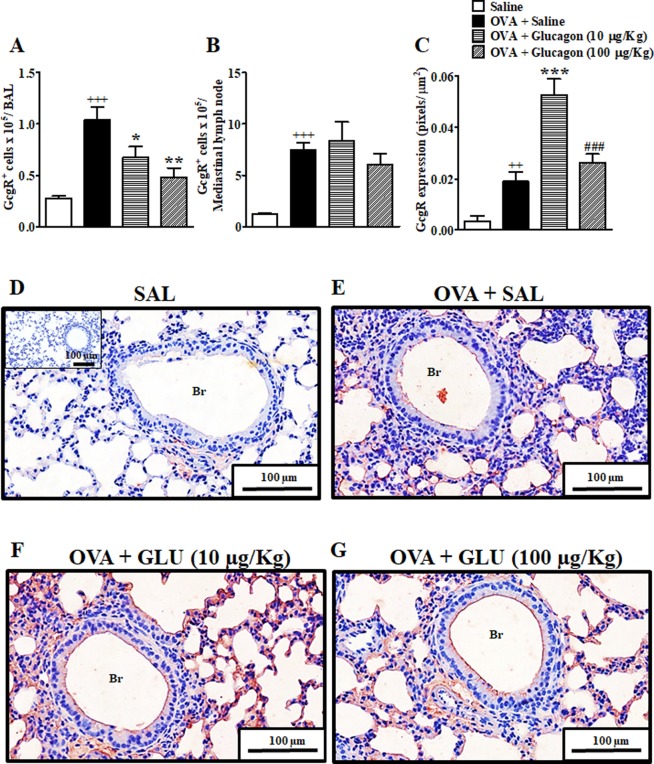
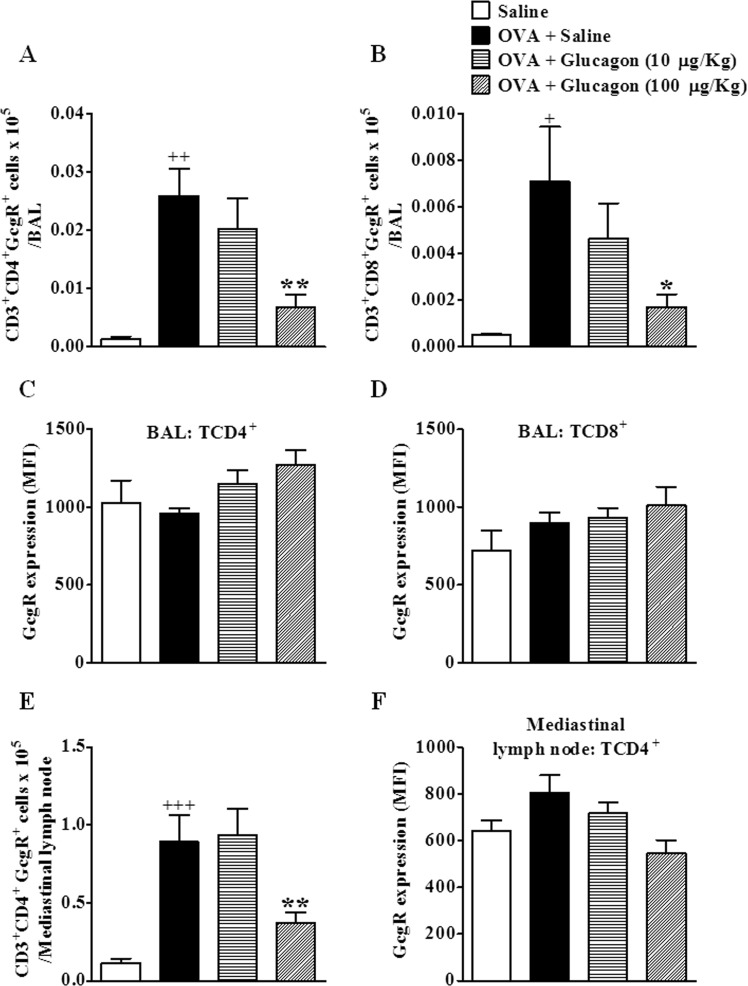
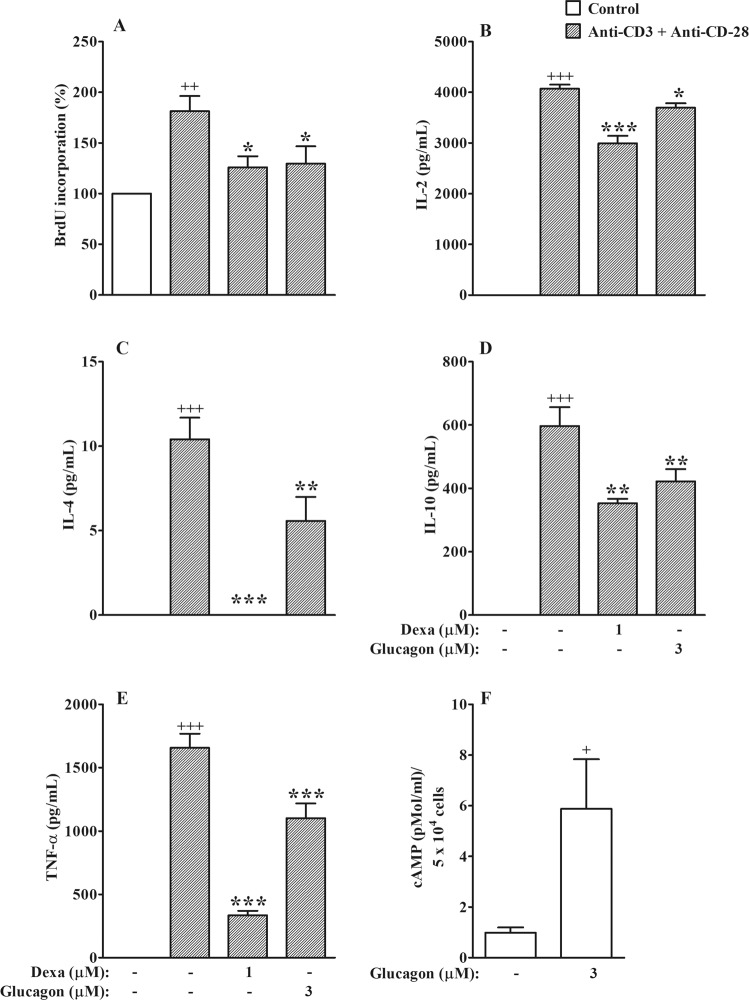
Glucagon has been shown to be beneficial as a treatment for bronchospasm in asthmatics. Here, we investigate if glucagon would prevent airway hyperreactivity (AHR), lung inflammation, and remodeling in a murine model of asthma. Glucagon (10 and 100 µg/Kg, i.n.) significantly prevented AHR and eosinophilia in BAL and peribronchiolar region induced by ovalbumin (OVA) challenge, while only the dose of 100 µg/Kg of glucagon inhibited subepithelial fibrosis and T lymphocytes accumulation in BAL and lung. The inhibitory action of glucagon occurred in parallel with reduction of OVA-induced generation of IL-4, IL-5, IL-13, TNF-α, eotaxin-1/CCL11, and eotaxin-2/CCL24 but not MDC/CCL22 and TARC/CCL17. The inhibitory effect of glucagon (100 µg/Kg, i.n.) on OVA-induced AHR and collagen deposition was reversed by pre-treatment with indomethacin (10 mg/Kg, i.p.). Glucagon increased intracellular cAMP levels and inhibits anti-CD3 plus anti-CD28-induced proliferation and production of IL-2, IL-4, IL-10, and TNF- α from TCD4+ cells in vitro. These findings suggest that glucagon reduces crucial features of asthma, including AHR, lung inflammation, and remodeling, in a mechanism probably associated with inhibition of eosinophils accumulation and TCD4+ cell proliferation and function. Glucagon should be further investigated as an option for asthma therapy.


Conflict of interest statement

The authors declare no competing interests.

Figures

Figure 1
Figure 1
Glucagon inhibits the increased number of GcgR+ cells in BAL and rise the expression of GcgR in lungs induced by OVA. The animals were challenged i.n. with OVA (25 μg/25 μL) or sterile saline (0.9%) once a day for 2 consecutive days and the treatment with glucagon (10 and 100 µg/Kg, i.n.) or sterile saline (0.9%) was performed 1 h before each challenge with OVA. BAL was collected, and mediastinal lymph node and lungs were removed for analysis 24 h after the last challenge. The number of cells expressing GcgR in BAL (A) and mediastinal lymph node (B) of A/J mice after i.n. challenged with OVA and treated with saline. Quantification of pixels corresponding to positive GcgR expression in lungs (C). Representative photomicrographs of GcgR expression on bronchioles and peribronchiolar region of lungs from saline-challenged (0.9%, i.n.) (D), OVA-challenged treated with saline (E) and OVA-challenged mice treated with glucagon 10 (F) or 100 µg/Kg, i.n. (G). The results are expressed as the mean ± SEM of 3–6 animals per group. Statistical analysis was performed using a one-way ANOVA followed by Newman–Keuls-Student’s T test. ++P < 0.01 compared to the group challenged with saline. +++P < 0.001 compared to the group challenged with saline. *P < 0.05 compared to the group challenge with OVA plus saline. **P < 0.01 compared to the group challenge with OVA plus saline. ***P < 0.001 compared to the group challenge with OVA plus saline. ###P < 0.001 compared to the group challenge with OVA and treated with glucagon 10 µg/Kg. Br = Bronchiolar lumen. SAL = Saline. OVA = Ovalbumin. GLU = Glucagon.
Figure 2
Figure 2
Glucagon prevents OVA-induced AHR to methacholine, and infiltration of eosinophils in BAL and lung of A/J mice. The treatment with glucagon (10 and 100 µg/Kg, i.n.) or its vehicle (sterile saline 0.9%, i.n.) was performed 1 h before each challenge with OVA, once a day for 2 consecutive days. Glucagon inhibited the elevation on Raw (A) and EL (B) induced by increasing concentrations of methacholine (3–27 mg/mL) in A/J mice challenged i.n. with sterile saline (0.9%) or OVA (25 μg/25 μL). The results are expressed as the mean ± SEM of 7–8 animals per group. Statistical analysis was performed using a two-way ANOVA followed by Bonferroni post-test. Glucagon inhibited total leukocyte and eosinophil accumulation in BAL (C) and EPO activity in lungs (G), 24 h after the last challenge with OVA (25 μg/25 μL) or saline. Photomicrographs of representative airways in Sirius Red-stained lung sections from mice challenged with saline (D), OVA plus saline (E), and OVA plus glucagon (100 μg/Kg) (F). Blue arrows indicate eosinophils. The number of eosinophils (H), mononuclear cells (I) and neutrophils (J) in peribronchiolar regions were counted in 7–10 bronchioles per mouse. The results are expressed as the mean ± SEM of 5 animals per group to inflammatory cells accumulation in the BAL; 8–10 animals per group to EPO activity; and 3–5 animals per group to histological analyses. Statistical analysis was performed using a one-way ANOVA followed by Newman–Keuls-Student’s T test. +P < 0.05 compared to the group challenged with saline. ++P < 0.01 compared to the group challenged with saline. +++P < 0.001 compared to the group challenged with saline. *P < 0.05 compared to the group challenged with OVA plus saline. **P < 0.01 compared to the group challenged with OVA OVA plus saline. Br = Bronchiolar lumen. Eos = Eosinophils. Mono = Mononuclear. Neu = Neutrophils. SAL = Saline. OVA = Ovalbumin. GLU = Glucagon.
Figure 3
Figure 3
Glucagon prevents elevation of TCD4+ and TCD8+ in BAL and mediastinal lymph node and inhibits the increase of TCRαβ expression in lungs of A/J mice challenged with OVA. Treatment with glucagon (10 and 100 µg/Kg, i.n.) or its vehicle (sterile saline 0.9%, i.n.) was performed 1 h before each challenge with OVA, once a day, for 2 consecutive days. Numbers of TCD4+ and TCD8+ cells in BAL (A,C, respectively) and total leukocytes, TCD4+ and TCD8+ cells in mediastinal lymph node (E,G,H, respectively). (B) Representative images of the expression of TCRαβ determined by western blot. Densitometry analysis of the expression of β (D) and α chains (F) of TCR in the lungs of A/J mice challenged i.n. with OVA and treated with glucagon or sterile saline. Full-length blots of TCR α and β chain and β-actin are reported in Supplementary Fig. S5.The results are expressed as the mean ± SEM of 4–6 animals per group. Statistical analysis was performed using one-way ANOVA followed by Newman–Keuls-Student’s T test. +P < 0.05 compared to the group challenged with saline. ++P < 0.01 compared to the group challenged with saline. +++P < 0.001 compared to the group challenged with saline. *P < 0.05 compared to the group challenge with OVA plus saline. **P < 0.01 compared to the group challenge with OVA plus saline. ***P < 0.001 compared to the group challenge with OVA plus saline. SAL = Saline. OVA = Ovalbumin. GLU = Glucagon.
Figure 4
Figure 4
Glucagon prevents chemokines and cytokine generation in the lung tissue of A/J mice challenged with OVA. The treatment with glucagon (10 and 100 μg/Kg, i.n.) or its vehicle (sterile saline 0.9%, i.n.) was performed 1 h before each challenge with OVA, once a day, for 2 consecutive days. Lung tissue levels of Eot-1/CCL11 (A), Eot-2/CCL24 (B), MDC/CCL22 (C), TARC/CCL17 (D), IL-4 (E), IL-5 (F), IL-13 (G), and TNF-α (H) were evaluated 24 hours after the last i.n. challenge with OVA (25 μg/25 μL) or saline. The levels of the chemokines and cytokines were quantified by ELISA. The results are expressed as the mean ± SEM of 8–10 animals per group. Statistical analysis was performed using a one-way ANOVA followed by Newman–Keuls-Student’s T test. +P < 0.05 compared to the group challenged with saline. ++P < 0.01 compared to the group challenged with saline. +++P < 0.001 compared to the group challenged with saline. *P < 0.05 compared to the group challenge with OVA plus saline. **P < 0.01 compared to the group challenge with OVA plus saline.
Figure 5
Figure 5
Glucagon prevents subepithelial peribronchiolar fibrosis induced by OVA challenge. The treatment with glucagon (10 and 100 μg/Kg, i.n.) or its vehicle (sterile saline 0.9%, i.n.) was performed 1 h before each challenge with OVA, once a day, for 2 consecutive days. Photomicrographs of representative lung histologic sections stained Masson’s Trichrome from saline-challenged (0.9%, i.n.) (A), OVA-challenged mice (25 µg/25 µL, i.n.) treated with sterile saline (0.9%, i.n.) (B), and OVA-challenged mice treated with glucagon 100 µg/Kg, i.n. (C). Subepithelial peribronchiolar fibrosis (D) was quantified digitally in 8–10 airways per animals. The results are expressed as the mean ± SEM of 5 animals per group. Statistical analysis was performed using a one-way ANOVA followed by Newman–Keuls-Student’s T test. +P < 0.05 compared to the group challenged with saline. *P < 0.05 compared to the group challenge with OVA plus saline. Br = Bronchiolar lumen. SAL = Saline. OVA = Ovalbumin. GLU = Glucagon.
Figure 6
Figure 6
Indomethacin prevented the inhibitory effect of glucagon on OVA-induced AHR to methacholine and collagen deposition in the lungs of A/J mice. Indomethacin (10 mg/Kg, i.p.) abolished the protective effect of glucagon (100 µg/Kg, i.n.) on increase of Raw (A), EL (B) and lung collagen content (C) in A/J mice challenged i.n. with sterile saline (0.9%) or OVA (25 μg/25 μL). The treatment with glucagon (100 μg/Kg, i.n.) or its vehicle (sterile saline 0.9%, i.n.) was performed 1 h before each challenge with OVA, once a day, for 2 consecutive days. Indomethacin or its vehicle (DMSO 0.3%) was injected 30 min before each glucagon treatment. The results are expressed as the mean ± SEM of 6–8 animals per group. Statistical analysis was performed using a two-way ANOVA followed by Bonferroni post-test for AHR evaluation. Statistical analysis was performed by ANOVA followed by Newman–Keuls-Student’s T test for collagen evaluation. +++P < 0.001 compared to the group challenged with saline. *P < 0.05 compared to the group challenge with OVA plus saline. ***P < 0.001 compared to the group challenge with OVA plus saline. #P < 0.05 compared to the group challenge with OVA and treated with glucagon 100 µg/Kg. ###P < 0.001 compared to the group challenge with OVA and treated with glucagon 100 µg/Kg. OVA = Ovalbumin. Indo = Indomethacin.
Figure 7
Figure 7
Glucagon inhibits the increase on TCD4+ GcgR+ and TCD8+ GcgR+ cells induced by OVA in BAL and mediastinal lymph node. Treatment with glucagon (10 and 100 µg/Kg, i.n.) or its vehicle (sterile saline 0.9%, i.n.) was performed 1 h before each challenge with OVA, once a day, for 2 consecutive days. Numbers of TCD4+ GcgR+ and TCD8+ GcgR+ cells in BAL (A,B, respectively) and TCD4+ GcgR+ in mediastinal lymph node (E). Median fluorescent intensity (MFI) of GcgR on TCD4+ (C,F) and TCD8+ (D) cells in BAL (C,D), and on TCD4+ cells in mediastinal lymph node (F). Isotype control of GcgR in flow cytometry showed less than 3% of positive events in all experiments. The results are expressed as the mean ± SEM of 4–6 animals per group. Statistical analysis was performed using a one-way ANOVA followed by Newman–Keuls-Student’s T test. +P < 0.05 compared to the group challenged with saline. ++P < 0.01 compared to the group challenged with saline. +++P < 0.001 compared to the group challenged with saline. *P < 0.05 compared to the group challenge with OVA plus saline. **P < 0.01 compared to the group challenge with OVA plus saline.
Figure 8
Figure 8
Glucagon increases intracellular cAMP levels and inhibits the proliferative response and cytokine production, by TCD4+ cells stimulated in vitro. Effect of glucagon on proliferation (A) and secretion of IL-2 (B), IL-4 (C), IL-10 (D), and TNF-α (E) by TCD4+ cells and stimulated with anti-CD3 plus anti-CD28 in vitro. Effect of glucagon on the intracellular levels of cAMP in TCD4+ cells (F). The results are expressed as the mean ± SEM of 4 animals per group. Statistical analysis was performed using a one-way ANOVA followed by Newman–Keuls-Student’s T test. +P < 0.05 compared to cells stimulated with sterile saline in vitro. ++P < 0.01 compared to cells stimulated with sterile saline in vitro. +++P < 0.001 compared to cells stimulated with sterile saline in vitro. *P < 0.05 compared to cells stimulated with anti-CD3 plus anti-CD28 in vitro. **P < 0.01 compared to cells stimulated with anti-CD3 plus anti-CD28 in vitro. ***P < 0.001 compared to cells stimulated with anti-CD3 plus anti-CD28 in vitro. Dexa = Dexamethasone.

Similar articles

Cited by

References

    1. Yu M, et al. Identification of an IFN-gamma/mast cell axis in a mouse model of chronic asthma. The Journal of clinical investigation. 2011;121:3133–3143. doi: 10.1172/JCI43598. - DOI - PMC - PubMed
    1. Sulaiman I, Lim JC, Soo HL, Stanslas J. Molecularly targeted therapies for asthma: Current development, challenges and potential clinical translation. Pulmonary pharmacology & therapeutics. 2016;40:52–68. doi: 10.1016/j.pupt.2016.07.005. - DOI - PubMed
    1. Lloyd CM, Hessel EM. Functions of T cells in asthma: more than just T(H)2 cells. Nature reviews. Immunology. 2010;10:838–848. doi: 10.1038/nri2870. - DOI - PMC - PubMed
    1. Fahy JV. Type 2 inflammation in asthma–present in most, absent in many. Nature reviews. Immunology. 2015;15:57–65. doi: 10.1038/nri3786. - DOI - PMC - PubMed
    1. Barnes PJ. Biochemical basis of asthma therapy. The Journal of biological chemistry. 2011;286:32899–32905. doi: 10.1074/jbc.R110.206466. - DOI - PMC - PubMed

Publication types

MeSH terms