. 2019 May;569(7757):570-575.
doi: 10.1038/s41586-019-1150-2. Epub 2019 Apr 24.

NAD metabolic dependency in cancer is shaped by gene amplification and enhancer remodelling

Affiliations

NAD metabolic dependency in cancer is shaped by gene amplification and enhancer remodelling

Sudhir Chowdhry et al. Nature. 2019 May.

Abstract

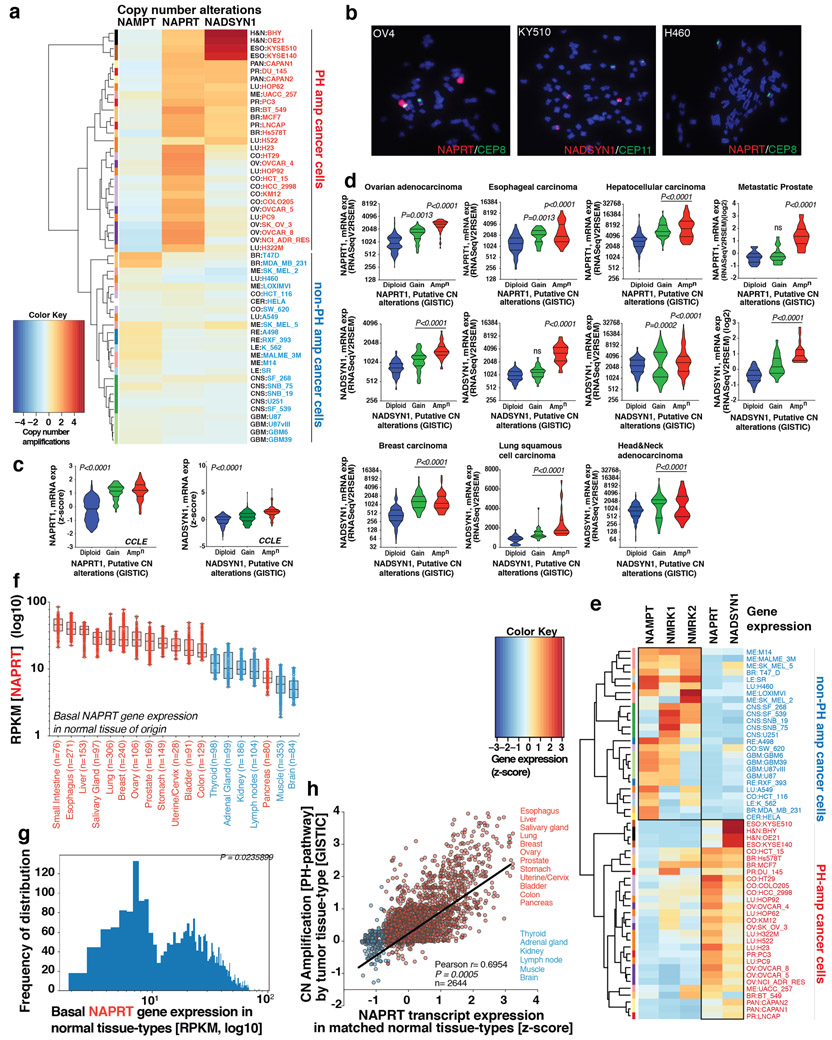
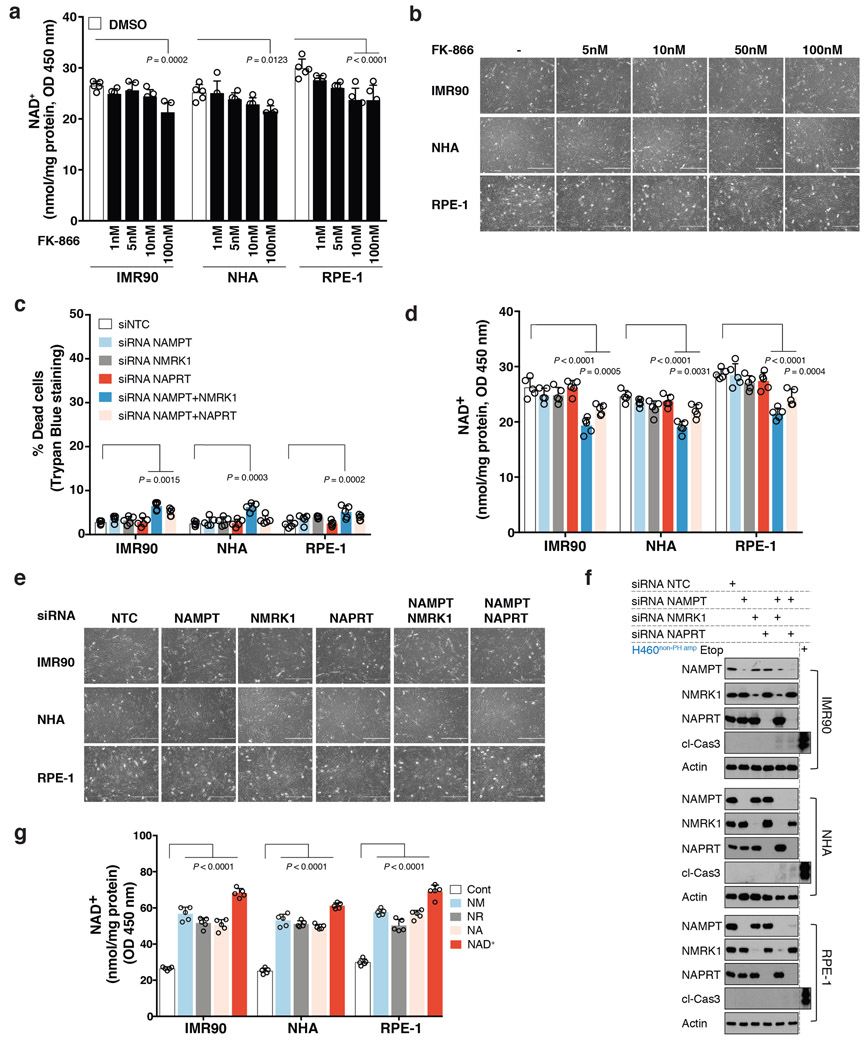
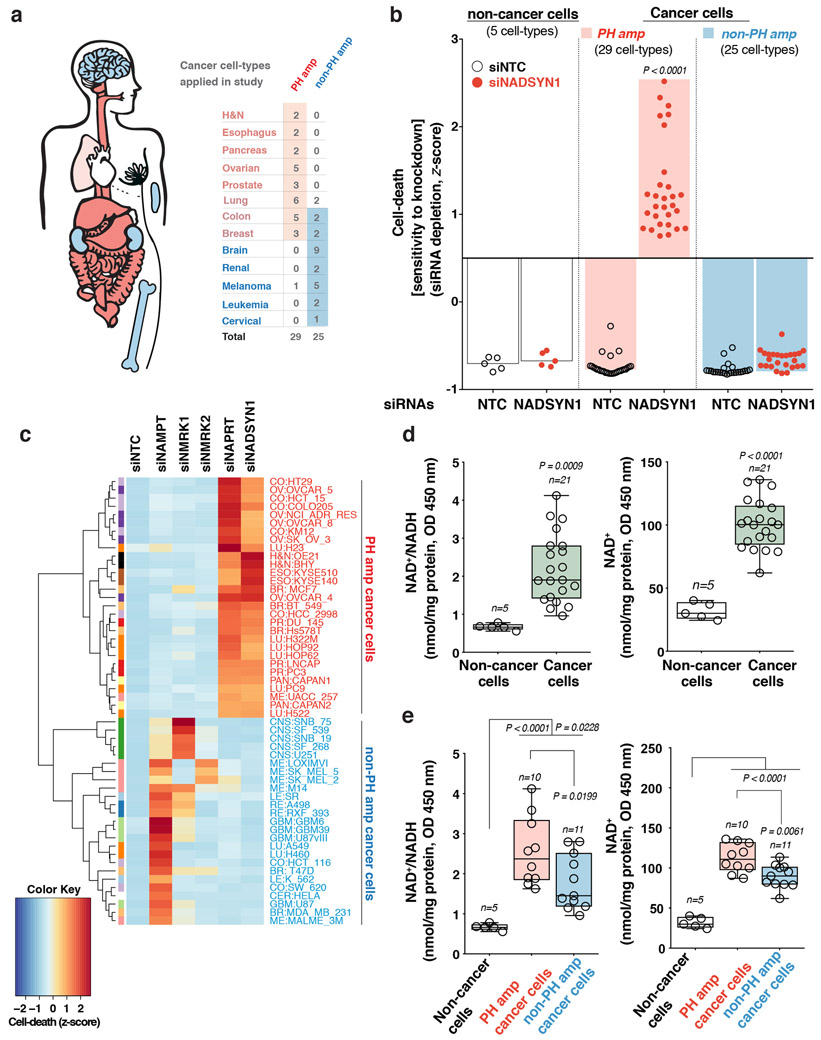
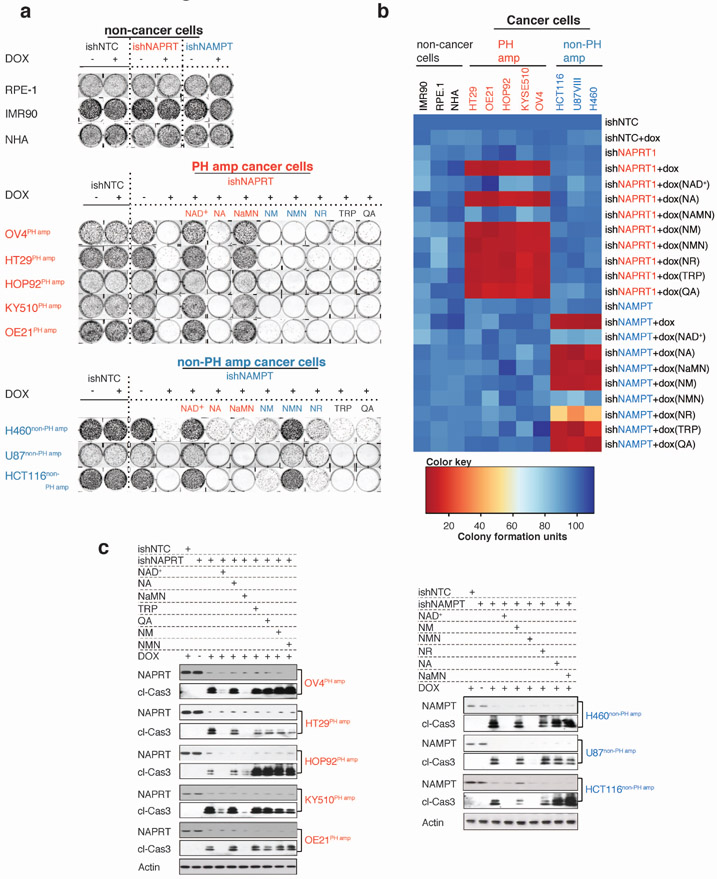
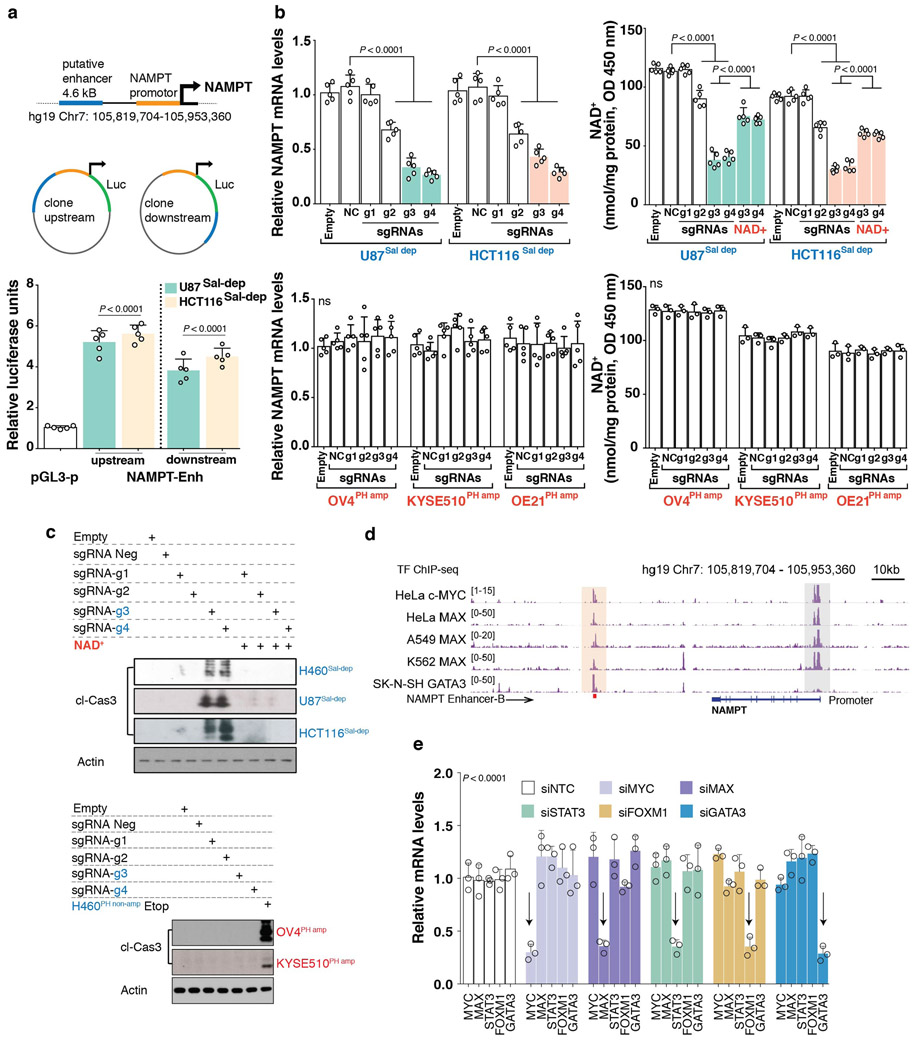
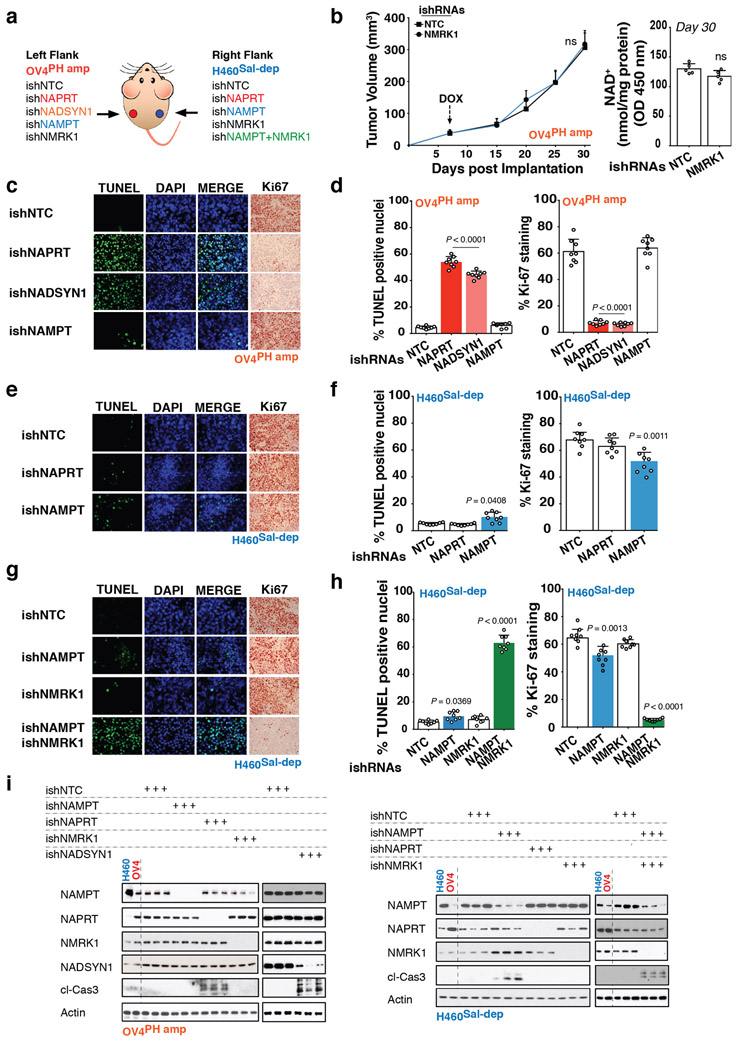
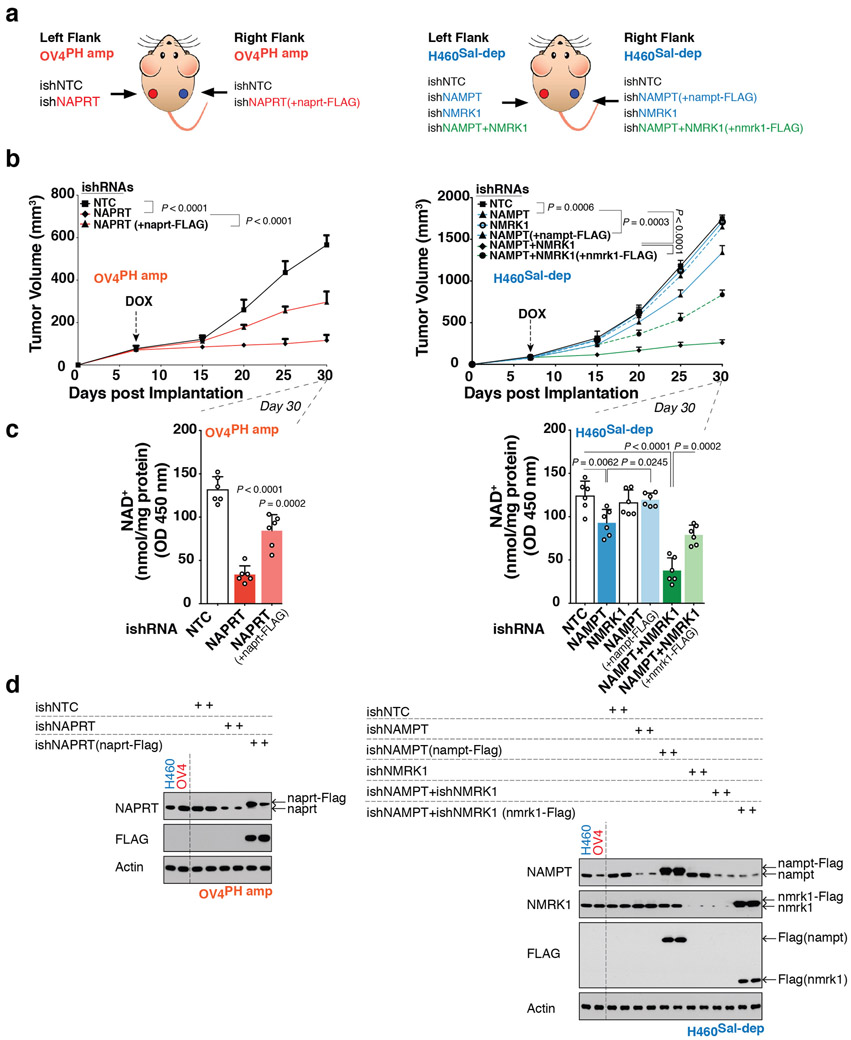
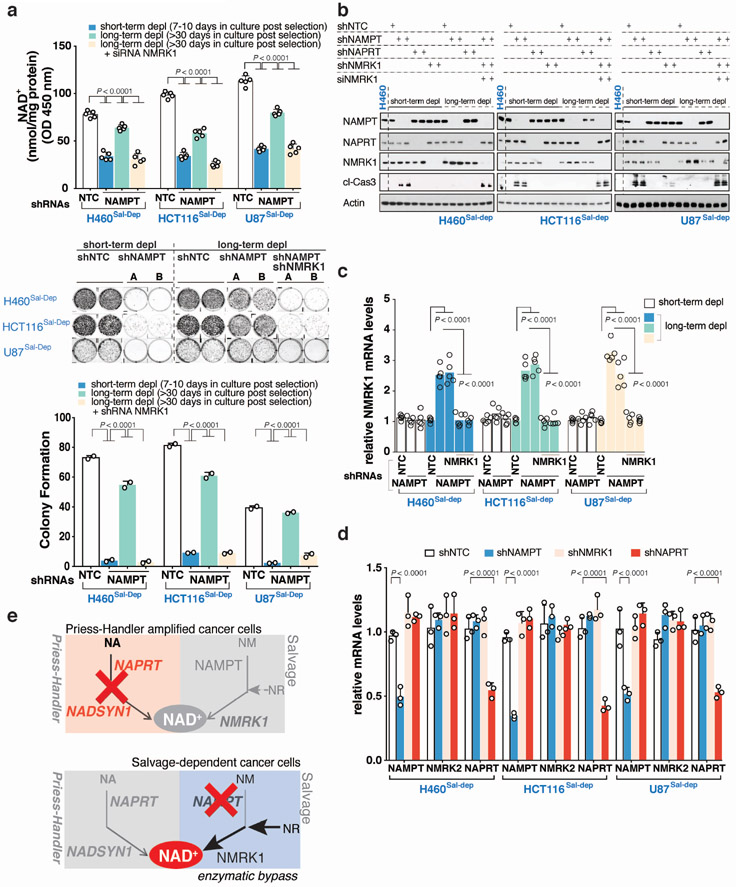
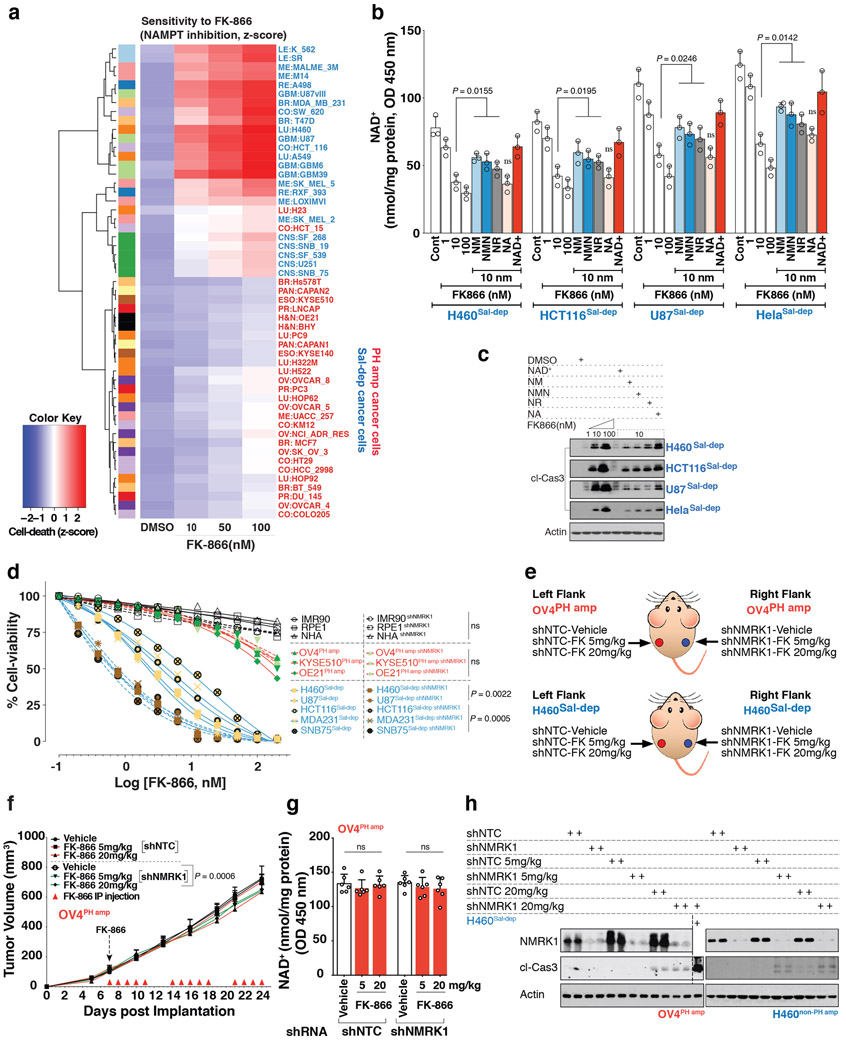
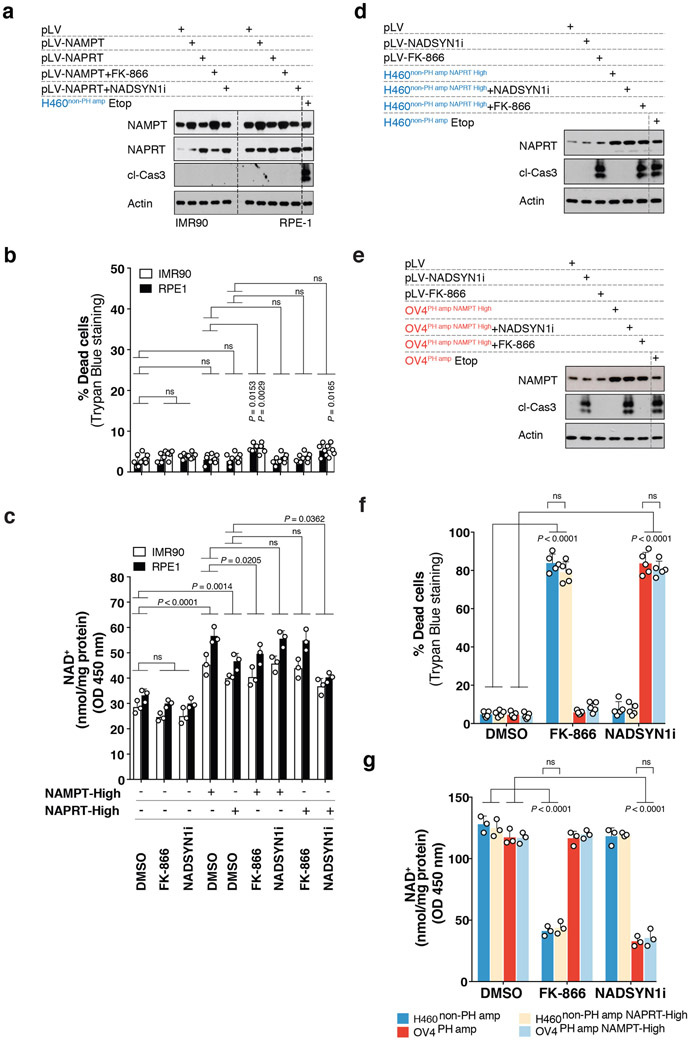
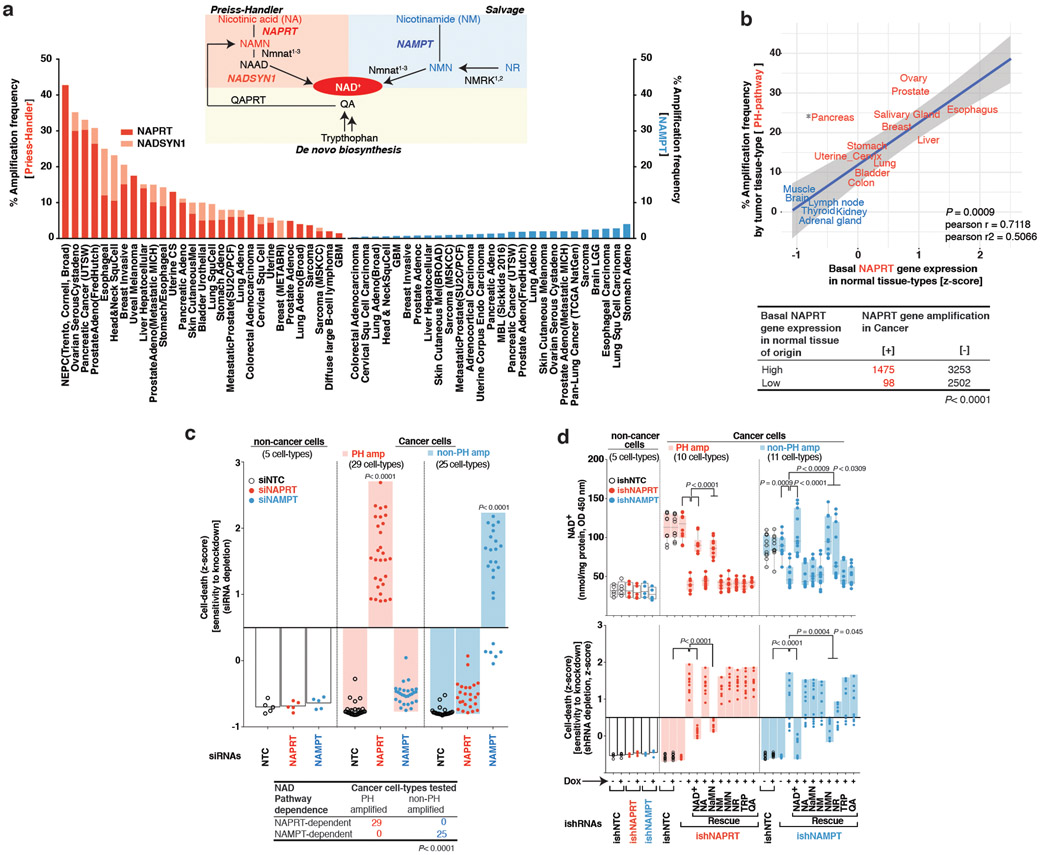
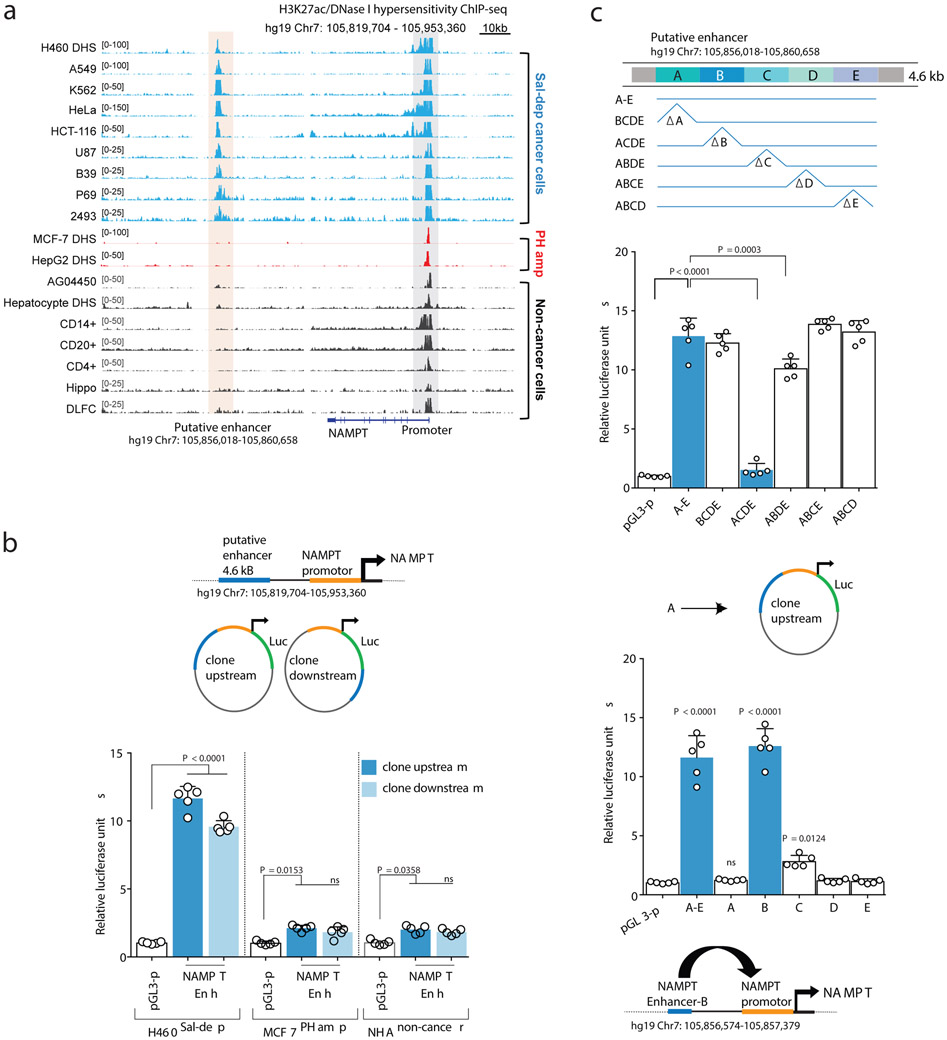
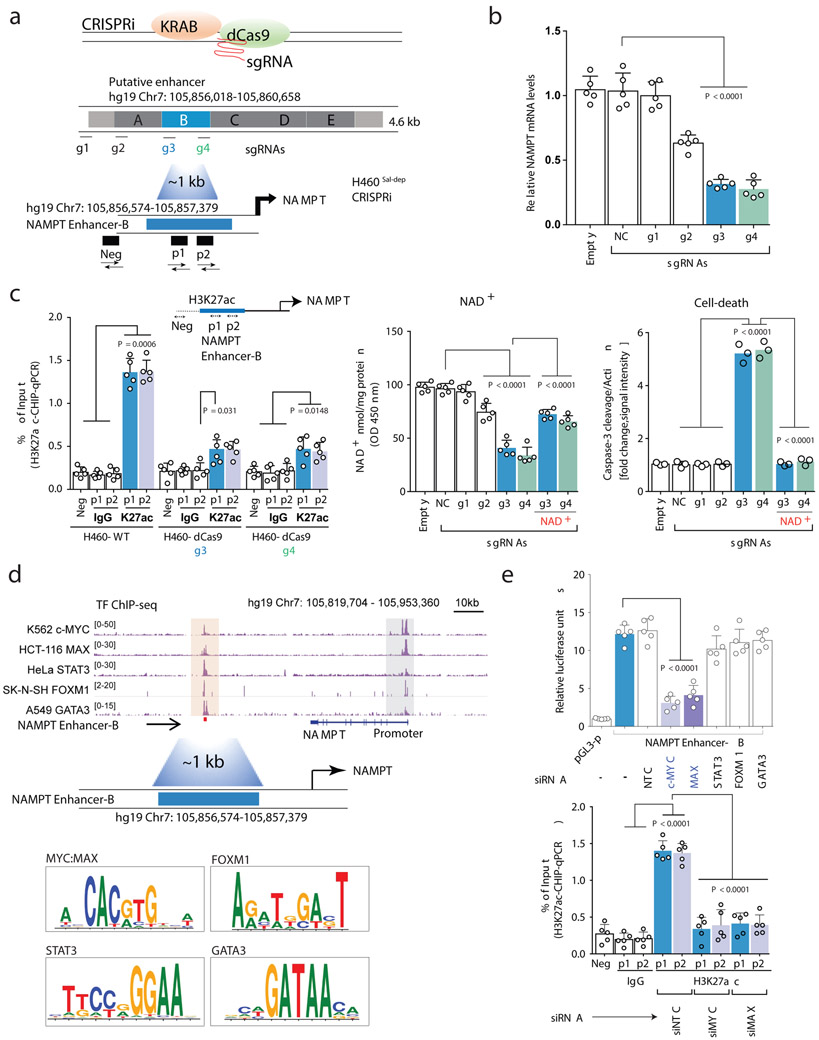
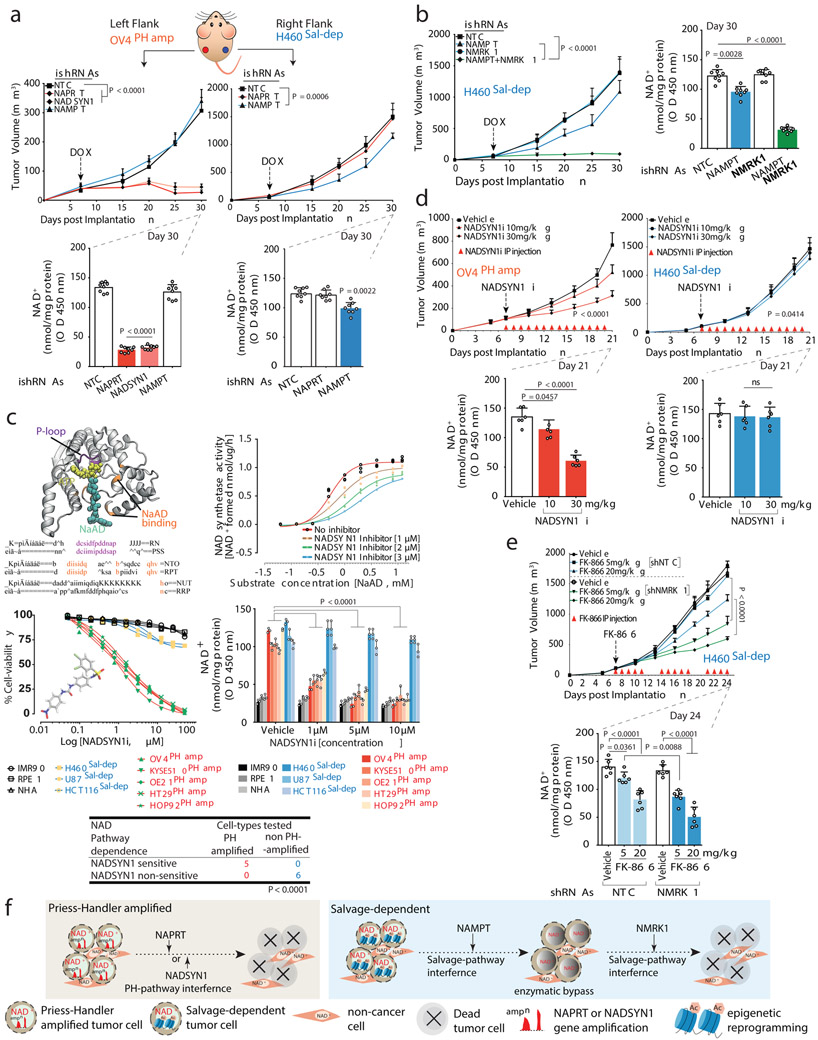
Precision oncology hinges on linking tumour genotype with molecularly targeted drugs1; however, targeting the frequently dysregulated metabolic landscape of cancer has proven to be a major challenge2. Here we show that tissue context is the major determinant of dependence on the nicotinamide adenine dinucleotide (NAD) metabolic pathway in cancer. By analysing more than 7,000 tumours and 2,600 matched normal samples of 19 tissue types, coupled with mathematical modelling and extensive in vitro and in vivo analyses, we identify a simple and actionable set of 'rules'. If the rate-limiting enzyme of de novo NAD synthesis, NAPRT, is highly expressed in a normal tissue type, cancers that arise from that tissue will have a high frequency of NAPRT amplification and be completely and irreversibly dependent on NAPRT for survival. By contrast, tumours that arise from normal tissues that do not express NAPRT highly are entirely dependent on the NAD salvage pathway for survival. We identify the previously unknown enhancer that underlies this dependence. Amplification of NAPRT is shown to generate a pharmacologically actionable tumour cell dependence for survival. Dependence on another rate-limiting enzyme of the NAD synthesis pathway, NAMPT, as a result of enhancer remodelling is subject to resistance by NMRK1-dependent synthesis of NAD. These results identify a central role for tissue context in determining the choice of NAD biosynthetic pathway, explain the failure of NAMPT inhibitors, and pave the way for more effective treatments.


Figures

Extended Data Fig. 1:
Extended Data Fig. 1:. Tissue lineage-dependent, PH-pathway gene amplification in Cancer.
a. Heatmap illustrating copy number (CN) alterations (z-score) for NAMPT; NAPRT and NADSYN1 across cancer cell types (n=54 cell-types). b. Representative FISH images of cells in metaphase from two independent experiments with similar observations displaying NAPRT and NADSYN1 gene amplification on Homogenously Staining Regions (HSRs) in PH-amplified (OV4PH amp and KYSE510PH amp) and non-PH amplified cancer cell lines (H460non-PH amp) as indicated. c. Violin plots of NAPRT (left) or NADSYN1 (right) mRNA expression against putative CN alterations from multiple tumor-types from CCLE (n=947 from biologically independent samples including shallow/deep deletion). d. Violin plots of NAPRT or NADSYN1 mRNA expression stratified by NAPRT and NADSYN1 CN alterations in multiple tumor-types from cBioportal (Ovarian adenocarcinoma: n=403; Esophageal carcinoma: n=150; Hepatocellular carcinoma: n=341; Metastatic Prostate adenocarcinoma: n=99; Breast carcinoma: n=311; Lung Squamous cell carcinoma: n=163; Head & Neck adenocarcinamoma: n=503, from biologically independent samples). e. Heatmap illustrating differential gene expression profiles of NAD biosynthesis enzymes in ‘PH-amp’ and ‘non-PH amp’ cancer cell types (z-score, n=54). Cancer cell-lines amplified for the PH-pathway enzymes (NAPRT or NADSYN1) are denoted as ‘PH amp’ marked in ‘red’, while cancer cell-lines that are not amplified for NAPRT or NADSYN1 are denoted as ‘non-PH amp’ marked in ‘blue’. f. Box and whisker plots showing normalized NAPRT transcript level (RPKM) in 19 distinct normal tissue of origin obtained from GTEx and TCGA portal (www.gtexportal.org) (www.portal.gdc.cancer.gov/repository). Centre line, median; box limits; whiskers, min to max, all points are plotted according to the Tukey method g. Bimodal distribution based on Dip Test of unimodality of two distributions stratified as ‘high’ and ‘low’ (n=2644 biologically independent samples). For tissues to be classified as having ‘high’ or ‘low’ expression of the gene critical point of distribution was chosen at 10 RPKM, at which the two distributions have identical density. h. Pearson correlation between NAPRT transcript expression (RPKM, z-score) in 19 normal tissues and NAPRT or NADSYN1 CN in 23 cancer types (n=2644 biologically independent samples). Statistical significance for violin plots display median, first and third quartiles, showing mRNA expression against putative CN alterations assessed using two-tailed unpaired Student’s t-test (c,d).
Extended Data Fig. 2:
Extended Data Fig. 2:. Non-cancer cells are not dependent on a single NAD biosynthetic pathway for survival.
a. Intracellular NAD+ level measurement in non-cancer cells upon treatment with increasing doses of NAMPT inhibitor FK-866 for 72 h. b. Representative images of non-cancer cells from one of the two independent experiments, treated with increasing doses of NAMPT inhibitor FK-866 for 72 h. Both biological replicates showed similar results. Images taken on 10X objective. c-f. Non-cancer cells transfected with siRNAs targeting NAMPT (siNAMPT); NMRK1 (siNMRK1) and NAPRT (siNAPRT) either individually or in combination. A non-targeting siNTC was used a negative control. c. Scattered data plots with bars representing (%) cell death assessed by trypan blue exclusion assay in non-cancer cells. d. Intracellular measurement of NAD+ levels in non-cancer cells. e. Representative images of non-cancer cells from one of the two independent experiments, transfected with siRNAs targeting NAMPT (siNAMPT); NMRK1 (siNMRK1) and NAPRT (siNAPRT) either individually or in combination. Both biological replicates showed similar results. Images taken on 10X objective. f. Immunoblotting for cleaved-caspase 3 as a measure of cell-death and to test for abundance of NAMPT, NMRK1 and NAPRT protein expression. Protein lysates from etoposide (Etop) treated H460 cancer cells was used as a control, when immunoblotting for cleaved-caspase 3. Actin was used as a loading control. Representative blots are from one of the two independent experiments. Both biological replicates showed similar results. g. Intracellular measurement of NAD+ levels in non-cancer cells supplemented with exogenous NAD+ (200 μM) or with the indicated precursors, NA; NM or NR at a concentration of 500 μM. Data are representative of five independent biological replicates, n=5 (a,c,d,g). Data are represented as mean ± s.d, analysed by one-way ANOVA with Tukey’s multiple comparisons test (a,c,d,g). For gel source data, see Supplementary Fig. 1.
Extended Data Fig. 3:
Extended Data Fig. 3:. Tissue context determines the NAD metabolic pathway dependence of cancer cells.
a. Schematic overview of 54 distinct established cancer models of 13 histological types analyzed in the study. b. Waterfall plot of cell death by Propidium Iodide staining (z-score). Both non-cancer and cancer cells (n=59 cell-types) were transfected with siRNAs targeting NADSYN1. Four different siRNAs were used to target NADSYN1 (siNADSYN1: red circle) and a non-targeting siNTC (clear circle) was used a negative control. c. Heatmap illustrating cell death measured by Propidium Iodide staining (z-score). Different cancer cell types (n=54 cell-types) were transfected with siRNAs. Four different siRNAs were used for each gene (siNAMPT; siNMRK1; siNMRK2; siNAPRT and siNADSYN1). Non-targeting siNTC was used a negative control. Figure 3c is a heatmap illustration of RNAi screen already shown in Figure 1c and Extended Data Figure 3b, but also contains siNMRK1 and siNMRK2 screen datasets to provide a complete perspective. d. Intracellular measurement of NAD+/NADH (left) and NAD+ (right) levels in non-cancer (n=5 cell-types) and cancer cell-lines (n=21 cell-types). e. Intracellular measurement of NAD+/NADH (left) and NAD+ (right) levels in non-cancer (n=5 cell-types), PH amp or non-PH amp cancer cell-lines (n=21 cell-types). Cancer cell-lines amplified for the PH-pathway enzymes (NAPRT or NADSYN1) are denoted as ‘PH amp’ marked in ‘red’, while cancer cell-lines not amplified for NAPRT or NADSYN1 are denoted as ‘non-PH amp’ marked in ‘blue’. Box and whisker plots showing intracellular measurement of NAD+/NADH and NAD+ levels display center line, median; box limits; whiskers, min to max, all points. Data are representative of independent biological replicates. Statistical significance for was assessed using one-way ANOVA with Tukey’s multiple comparisons test (b), while for (d) and (e)a two-tailed unpaired Student’s t-test was used.
Extended Data Fig. 4:
Extended Data Fig. 4:. Genetic depletion of genes encoding key enzymes of NAD biosynthesis pathways combined with metabolic addbacks identify mechanistic basis of NAD pathway addiction.
Cancer cell-lines (n=8 cell-types) amplified for the PH-pathway enzymes (NAPRT or NADSYN1) denoted as ‘pH amp’ marked in ‘red’ or not amplified for NAPRT or NADSYN1 denoted as ‘non-PH amp’ marked in ‘blue’ were transduced independently with the indicated DOX-inducible ishRNAs, including, non-targeting control (ishNTC); NAPRT (ishNAPRT) or NAMPT (ishNAMPT), followed up with DOX treatment post puromycin selection. Non-cancer cell-lines (n=3 cell-types) marked in ‘black’ used as controls were also transduced with the indicated DOX-inducible ishRNAs. During this time, cells were supplemented with fresh growth media and exogenous NAD+ (200 μM) or with the indicated precursors, NA; NaMN; NM; NMN; NR; TRP or QA at a concentration of 500 μM every 2-3 days. a. Representative images of colony formation assay using Crystal violet staining from one of the two independent experiments. Both biological replicates showed similar results. Cells stably expressing different ishRNAs were stained with crystal violet after 15-18 days post transduction and selection. b. Heatmap illustrating absolute colony formation units. c. Immunoblotting for cleaved-caspase 3 as a measure of cell-death and to test for protein abundance for NAPRT and NAMPT in ‘PH amp’ (left) and ‘non-PH amp’ (right) cancer cells transduced with respective ishRNAs. Actin was used as a loading control. Representative blots from one of the two independent experiments. Both biological replicates showed similar results. For gel source data, see Supplementary Fig. 1.
Extended Data Fig. 5:
Extended Data Fig. 5:. NAMPT enhancer drives NAD Salvage-pathway addiction in cancer.
a. Luciferase enhancer-reporter assay of the putative downstream enhancer. To test the effect of a predicted enhancer, cis regulatory region of the NAMPT locus was cloned into pGL3 reporter constructs in the direction indicated. Enhancer activity of the 4.641 kb cis regulatory region corresponding to the H3k27ac/DHS peak was tested using luciferase reporter assay, when present both upstream and downstream of the luciferase gene in a construct containing the NAMPT promoter. The pGL3 reporter plasmid containing the NAMPT promoter but without the enhancer region is used as a negative control (pGL3). Luciferase reporter assay measuring the enhancer activity (NAMPT-Enh) was tested in Salvage-dependent, U87Sal-dep and HCT116Sal-dep cancer cells. Relative luciferase units are normalized to Renilla luciferase. b. NAMPT transcript levels (left) as measured by quantitative PCR and Intracellular measurement of NAD+ levels (right) in cells transduced with the KRAB-dCAS9 genetic repression system (Top left-right: U87Sal-dep and HCT116Sal-dep; bottom left-right: OV4PH amp, KYSE510PH amp and OE21PH amp). c. Immunoblotting for cleaved caspase-3 abundance (top, H460Sal-dep, U87Sal-depand HCT116Sal-dep; bottom, OV4PH amp and KYSE510PH amp), in cells transduced with the KRAB-dCAS9 genetic repression system. Representative blots are from one of the two independent experiments. Both biological replicates showed similar results. Actin was used as loading control. When quantifying NAD+ measurement and cleaved caspase-3 abundance in H460Sal-dep, U87Sal-dep and HCT116Sal-dep, cells were treated with exogenous NAD+ (200 μM) to test for the rescue of the phenotype. Please refer to the schematic overview (Fig 3a) for the design of KRAB-dCas9 mediated repression of the NAMPT-enhancer embedded within the ‘B’ sub-region. Five different guide RNAs were individually fused to dCAS9 expressing construct (‘NC’, ‘g1’ to ‘g4’). ‘Empty’: no sgRNA; ‘NC’: sgRNA that is predicted to not recognize any genomic regions; ‘g1’: sgRNA recognizing Chr7 genomic loci >20kb away from the NAMPT ‘B’ enhancer region; ‘g2’: sgRNA recognizing 4.641 kb long cis regulatory region; ‘g3’ and ‘g4’: sgRNAs recognizing NAMPT ‘B’ enhancer region. d. Genome browser screenshot illustrating TF (transcription factor)-ChIP-seq epigenome profiles across multiple ‘Sal-dep’ cancer cells (HeLa, A549, K562 and SK-N-SH). The peach shaded region embedding the TF-ChIP-seq peaks indicate putative TF recruitment sites that overlap NAMPT ‘B’ enhancer region (marked by a red square box at the bottom of the clustering, hg19 Chr7: 105,856,541-105,858,299). The grey shaded region corresponds to the NAMPT promoter (hg19_dna chr7:105,925,229-105,926,250). e. Transcript levels of MYC, MAX, STAT3, FOXM1 and GATA3 transcription factors (TFs) in H460Sal-dep cancer cells upon siRNA mediated depletion of the respective TFs. Non-targeting siNTC was used a negative control. Scatter data plots with bars are representative of five (a,b, n = 5) and three (b-bottom-right, e, n = 3) independent biological replicates. Data are represented as mean ± s.d, analysed by one-way (a,b) or two-way ANOVA (e) with Tukey’s multiple comparisons test. For gel source data, see Supplementary Fig. 1.
Extended Data Fig. 6:
Extended Data Fig. 6:. In vivo demonstration of NAD metabolic pathway dependencies.
a. Schematic diagram of experiment - OV4PH amp cells (Ovarian adenocarcinoma) stably expressing DOX-inducible shRNA either against NAPRT (ishNAPRT), NADSYN1 (ishNADSYN1), NAMPT (ishNAMPT) or NMRK1 (ishNMRK1) were inoculated into the left flank of nude mice. H460Sal-dep NSCLC cells stably expressing DOX-inducible shRNA either against NAPRT (ishNAPRT), NAMPT (ishNAMPT), NMRK1 (ishNMRK1) or both NAMPT (ishNAMPT) and NMRK1 (ishNMRK1) were inoculated into the right of the same nude mice. ishNTC was used as a non-targeting control inducible shRNA for both the tumor types. b. Tumor volume (left) and Intratumoral NAD+ measurement (right) of nude mice bearing OV4PH amp stably expressing DOX-inducible shRNA against NMRK1 (ishNMRK1) taken at the end of experiment on Day 30. Tumor volume was monitored over a 30-day period. DOX treatment was initiated on day 7 post implantation until the end of the experiment. c, e and g. Representative images illustrating TUNEL+ nuclei and Ki67+ cells from one of the two independent experiments. Both biological replicates showed similar results. d, f and h. Quantification for TUNEL+ nuclei and Ki67+ cells in tumor tissues from respective tumor types. DAPI was used to stain DNA for TUNEL staining. When measuring TUNEL+ nuclei, 10000-12000 cells were counted for each cohort, whereas for Ki67+ cells, 15000-20000 cells were counted for each cohort. I. Immunoblotting for cleaved-caspase 3 as a measure of cell-death and to test for protein abundance for NAMPT, NAPRT, NMRK1 and NADSYN1 in tumor tissues obtained from the indicated tumor types. Representative blots are from one of the two independent experiments. Both biological replicates showed similar results. Actin was used as a loading control. Data are representative of eight (b-left,d,f,h, n=8) and five (b-right, n=5) independent biological replicates. Mean tumor volume ± s.e.m is shown (n=8 tumors/cohort) with statistical significance assessed using two-way ANOVA to calculate significance on repeated measurements over time (b-left). Data as scatter plots with bars are represented as mean ± s.d, analysed by one-way ANOVA with Tukey’s multiple comparisons test (d,f,h). For gel source data, see Supplementary Fig. 1 ns, not significant.
Extended Data Fig. 7:
Extended Data Fig. 7:. In vivo genetic depletion of genes encoding key enzymes of NAD biosynthesis pathways combined with genetic rescue identify mechanistic basis of NAD pathway addiction.
a. Schematic diagram of experiment - OV4PH amp or H460Sal-dep cells stably expressing DOX-inducible shRNA targeting the 3' UTR of the target genes, NAPRT (ishNAPRT), NAMPT (ishNAMPT), NMRK1 (ishNMRK1) or co-deletion of NAMPT+NMRK1 (ishNAMPT+NMRK1) were inoculated into the left flank of individual nude mice as indicated. Same clone of stably engineered OV4PH amp or H460Sal-dep cells but with an expression of exogenous cDNA corresponding to the target not susceptible to silencing compared to the endogenous copy, (ishNAPRT(+naprt-FLAG)), (ishNAMPT(+nampt- FLAG)) or (ishNAMPT+NMRK1(+nmrk1-FLAG)) were inoculated into the right flank of individual mice as indicated. ishNTC was used as a non-targeting control inducible shRNA for both the tumor types. b. Tumor volume from different tumor types as indicated. Tumor volume was monitored over a 30-day period. DOX treatment was initiated on day 7 post implantation until the end of the experiment. c. Intratumoral NAD+ measurement of nude mice bearing tumors taken at the end of experiment on Day 30 for the indicated tumor types. d. Immunoblotting for NAPRT, NAMPT, NMRK1 and FLAG in tumor tissues obtained from the indicated tumor types to check for protein abundance. Representative blots are from one of the two independent experiments. Both biological replicates showed similar results. Actin was used as a loading control. Data are representative of eight (b, n=8) and six (c, n=6) independent biological replicates. Mean tumor volume ± s.e.m is shown (n=8 tumors/cohort) with statistical significance assessed using two-way ANOVA to calculate significance on repeated measurements over time (b). Data as scatter plots with bars are represented as mean ± s.d, analysed by one-way ANOVA with Tukey’s multiple comparisons test (c). For gel source data, see Supplementary Fig. 1.
Extended Data Fig. 8:
Extended Data Fig. 8:. NAMPT deficiency leads to enzymatic bypass of the Salvage-pathway successfully reprogramming NAD biosynthesis in Cancer.
Genetically engineered Salvage-dependent cancer cells including, H460Sal-dep, HCT116Sal-dep and U87Sal-dep were transduced with stable a silencing system targeted against NAMPT using shRNA followed up with puromycin selection. Two different shRNAs were tested against NAMPT. A non-targeting shNTC was used a control. a. Intracellular NAD+ measurement (top). Representative images of clonogenic survival assay using Crystal violet staining (middle) from one of the two independent experiments. Both biological replicates showed similar results. Quantification of colony formation units (bottom). For ‘short-term depl’ cells were seeded 7-10 days post transduction/selection for clonogenic survival assay, while for ‘long-term depl’, cells were seeded ≥30 days post transduction/selection. Cells were stained with crystal violet after 15-18 days of seeding. Salvage-dependent cancer cells stably silenced for NAMPT grown for an extended duration of time (long-term depl), were later silenced for NMRK1 using shRNA. b. Immunoblotting for cleaved-caspase 3 as a measure of cell-death and to test for protein abundance for NAMPT, NMRK1 and NAPRT. Representative blots are from one of the two independent experiments. Both biological replicates showed similar results. Actin was used as a loading control. Salvage-dependent cancer cells stably silenced for NAMPT and grown for an extended duration of time (long-term depl), were later silenced for NMRK1 using siRNA. For ‘short-term depl’ cells were harvested for protein extraction 7-10 days post transduction/selection, while for ‘long-term depl’, cells were harvested for protein extraction ≥30 days post transduction/selection (including transient transfection using siRNA) and later immunoblotted. c. Relative NMRK1, d. Relative NAMPT, NMRK2 or NAPRT transcript levels as measured by quantitative PCR. For ‘short-term depl’, cells were harvested for RNA extraction 7-10 days post transduction/selection, while for ‘long-term depl’ cells were harvested for RNA ≥30 days post transduction/selection. Salvage-dependent cancer cells stably silenced for NAMPT and grown for an extended duration of time (long-term depl), were later silenced for NMRK1 using shRNA. e. Schematic overview of the model illustrating NAD pathway addiction in cancer is driven through two separate mechanisms, one that gets shaped by gene amplification (left) while the other through epigenetic reprogramming (right). The model demonstrates tissue context-based amplifications of genes encoding key enzymes (NAPRT/NADSYN1) of the PH-pathway and subsequent tumor cell dependence that is absolute and not subjected to enzymatic bypass rewiring. In contrast, epigenetically-determined dependence on the NAMPT driven Salvage-pathway is subject to enzymatic bypass, requiring combination therapies. Data are representative of five (a-top,c, n=5), three (d, n=3) and two (a-middle, a-bottom, n=2) independent biological replicates. Data as scatter plots with bars are represented as mean ± s.d, analysed by one-way ANOVA with Tukey’s multiple comparisons test (a,c,d). For gel source data, see Supplementary Fig. 1.
Extended Data Fig. 9:
Extended Data Fig. 9:. Genetic depletion of NMRK1 in non-PH amplified tumor cells enhances sensitivity to FK-866 inducing tumor cell death.
a. Heatmap illustrating cell death measured by Propidium Iodide staining (z-score). Cancer cells were treated with increasing doses of NAMPT inhibitor, FK-866 for 72 h. Cancer cells amplified for the PH-pathway enzymes (NAPRT or NADSYN1) are denoted as ‘PH amp’ marked in ‘red’, while cancer cells not amplified for NAPRT or NADSYN1 are denoted as ‘Sal-dep’ marked in ‘blue’. b. Intracellular NAD+ level measurement, and c. Immunoblotting for cleaved-caspase 3, in ‘Sal-dep’ cancer cells treated with 10nM FK-866 for 72 h. To rescue depleted (b) intracellular NAD+ pools and (c) apoptosis as measured by cleaved-caspase 3 abundance, cells were supplemented with exogenous NAD+ (200 μM) or with the indicated precursors, NM; NMN; NR or NA at a dose of 500 μM. d. Cell viability of non-cancer and cancer cells (PH amp and Sal-dep) stably silenced using shRNA against NMRK1 (shNMRK1) as the target gene, treated with increasing doses of FK-866 for 72 h. shNTC was used as a non-targeting control shRNA. e. Schematic diagram of experiment - OV4PH amp (top) and H460Sal-dep (bottom) cells stably expressing shRNA against the target gene NMRK1 (shNMRK1), implanted subcutaneously. shNTC was used as a non-targeting shRNA control for both the tumor types, f. Tumor volume of nude mice bearing stably engineered OV4PH amp cells implanted subcutaneously. Tumor volume was monitored over a 24-day period. Mice were IP injected with FK-866 twice daily, g. Intratumoral NAD+ measurement of nude mice bearing stably engineered OV4PH amp tumors, taken at the end of experiment on Day 24. h. Immunoblotting for cleaved-caspase 3 as a measure of cell-death and to test for protein abundance for NMRK1 in tumor tissues obtained from the indicated tumor types. Representative blots are from one of the two independent experiments. Both biological replicates showed similar results. Actin was used as a loading control (c,h). Data are representative of three (b,d, n=3), eight (f, n=8) and six (g, n=6) independent biological replicates. Data as scatter plots with bars are represented as mean ± s.d, analysed by one-way ANOVA with Tukey’s multiple comparisons test (b,g). Statistical significance for cell-viability data was assessed using two-tailed unpaired Student’s t-test (d). Mean tumor volume ± s.e.m is shown (n=8 tumors/cohort) with statistical significance assessed using two-way ANOVA to calculate significance on repeated measurements over time (f). For gel source data, see Supplementary Fig. 1. ns, not significant.
Extended Data Fig. 10:
Extended Data Fig. 10:. Overexpression of rate-limiting NAD biosynthesis enzymes is not sufficient to generate or reverse metabolic addiction.
a. Immunoblotting for cleaved-caspase 3 as a measure of cell-death and to test for abundance of NAMPT and NAPRT protein expression in non-cancer cells (IMR90, RPE-1) stably over-expressing NAMPT or NAPRT. Protein lysates from etoposide (Etop) treated H460 cancer cells was used as a control, b. Scattered plots with bars represent (%) cell death assessed by trypan blue exclusion assay, c. Intracellular measurement of NAD+ levels. d,e. Immunoblotting for cleaved-caspase 3 as a measure of cell-death and to test for abundance of NAPRT (d, top, in H460non-PH amp) and NAMPT (e, bottom, in OV4PH amp) protein expression. Protein lysates from etoposide (Etop) treated H460 or OV4 cancer cells was used as a control, f. Scattered plots with bars represent (%) cell death assessed by trypan blue exclusion assay, g. Intracellular measurement of NAD+ levels, upon stable over-expression of NAPRT or NAMPT in H460 or in OV4 cancer cells as indicated. Stably engineered non-cancer and cancer cells (10a-g) post selection were treated with FK-866 (10nM) or NADSYNUi (2μM) as indicated for 72 h. Representative blots are from one of the two independent experiments. Both biological replicates showed similar results. Actin was used as a loading control (a,d,e). Data are representative of five (b,f, n=5) and three (c,g, n=3) independent biological replicates. Data as scatter plots with bars are represented as mean ± s.d, analysed by two-way ANOVA with Tukey’s multiple comparisons test (b,c,f,g). For gel source data, see Supplementary Fig. 1. ns, not significant.
Fig. 1:
Fig. 1:. Tissue lineage-dependent, PH-pathway addiction in cancer driven by gene amplification.
a. NAD+ biosynthesis pathways and gene amplification frequencies in cancer. b. If the rate limiting enzyme (NAPRT) of de novo NAD biosynthesis PH-pathway is highly expressed in a normal tissue-type, cancers that arise from that tissue will have high amplification frequency of genes encoding key enzymes (NAPRT/NADSYN1) of the PH pathway–analysis of >7000 cancer samples of 23 histological types from TCGA, and matched normal tissue samples from GTEx and TCGA. For tissues to be classified as having ‘high’ or ‘low’ expression of the gene critical point of distribution was chosen at 10 RPKM, at which the two distributions have identical density. c. Tissue context determines NAD metabolic pathway dependence of cancer cells–analysis of 54 tumor cell-lines of 13 histological types from NCI-60 panel and 5 non-cancer cell lines. d. Unlike normal cells, PH-pathway amplified tumor cells are completely dependent on NAPRT for survival. Tumor cells lacking these amplicons are entirely dependent on NAMPT for survival. shRNA +/− addback of key pathway intermediates confirms that survival dependence is mediated completely via NAD synthesis. Box and whisker plots showing intracellular NAD+ levels. Centre line, median; box limits; whiskers, min to max, all points. Statistical significance was assessed using Hartigan’s dip test followed by Bayesian probability statistics and Two-sided Fishers exact test (b). Data are representative of three biological replicates, n = 3 (c,d). Data are represented as mean ± s.d, analysed by one-way ANOVA with Tukey’s multiple comparisons test (c,d).
Fig. 2:
Fig. 2:. Identification of an epigenetic basis for NAMPT-pathway addiction in non-PH amplified Cancers.
a. Genome browser snapshot (top) illustrating H3K27ac and DHS ChIP-seq signal peaks across cancer cell-lines and matched tumor tissue biopsies. Peach shaded region embedding H3K27ac or DHS peaks indicate a putative NAMPT enhancer. b. Putative NAMPT enhancer locus cloned into an engineered luciferase reporter construct, upstream or downstream of the native NAMPT promoter. Bar plot showing luciferase reporter activity. c. Step-wise site-directed mutagenesis to delete or clone (top) small ~1kb long individual enhancer fragments identifies the region required for driving NAMPT transcription in a luciferase reporter assay (bottom). Bar plot showing luciferase reporter activity. Data are representative of five independent biological replicates, n = 5 (b,c). Data are represented as mean ± s.d, analysed by one-way ANOVA with Tukey’s multiple comparisons test (b,c). ns, not significant.
Fig. 3:
Fig. 3:. Dissection of NAMPT enhancer and its regulation in Cancer.
a. Schematic overview (top) of CRISPRi strategy to identify the cis-regulatory element controlling NAMPT pathway addiction in cancer, revealing the specific enhancer element that regulates, b. NAMPT transcript levels, c. H3k27ac ChIP-qPCR (left), NAD+ levels (middle) and Cleaved Caspase-3 abundance (right). d. Genome browser screenshot indicates TF-ChIP-seq signal across multiple cancer cell-types; peach shaded region illustrate putative TF recruitment sites overlapping NAMPT enhancer. TF motif analysis (bottom) e. Bar plots showing luciferase reporter assay (top) and H3k27 acetylation ChIP-qPCR (bottom) to demonstrate Myc-Max dependence of NAMPT enhancer activity. Data are representative of five independent biological replicates, n = 5 (b,c,e). Data are represented as mean ± s.d, analysed by one-way ANOVA with Tukey’s multiple comparisons test (b,c,e).
Fig. 4:
Fig. 4:. PH-pathway survival addiction is not subject to enzymatic bypass, resulting in massive tumor cell death in vivo; epigenetically determined Salvage-pathway dependence is subject to resistance through enzymatic bypass.
a. Tumor volumes (top) of nude mice bearing engineered OV4PH-amp and H460Sal-dep cells implanted subcutaneously into the left or right flank. Intratumoral NAD+ levels (bottom). b. Tumor volume of nude mice bearing engineered H460Sal-dep cells implanted subcutaneously (left). Intratumoral NAD+ levels (right). c. Crystal structure of glutamine-dependent NAD synthetase from B. subtilis, bound to ATP and NaAD. Sequence alignment of P loop (purple) and NaAD binding sites (orange). NAD synthetase activity (top,right) of human recombinant enzyme. Cell viability (middle,left) of non-cancer and cancer cells treated with NADSYNi for 72 h. Intracellular NAD+ levels (middle, right) in non-cancer and cancer cell-lines (‘PH amp’ and ‘Sal-dep’) treated with NADSYN1i. Two-sided Fishers exact test (bottom). d. Tumor volumes (top) of nude mice bearing OV4PH-amp and H460Sal-dep cells implanted subcutaneously into the left or right flank. Mice were IP injected with NADSYN1i once daily. Intratumoral NAD+ levels (bottom). e. Tumor volume of nude mice bearing H460Sal-dep cells implanted subcutaneously into the right flank. Mice were IP injected with FK-866 twice daily. Intratumoral NAD+ levels (bottom). f. Schematic overview of the molecular basis of NAD metabolic pathway addiction in cancer. DOX treatment or drug administration was initiated on day 7 post implantation once the tumors were visible. Data are representative of eight (a,b,d,e: tumor volumes; a,b: NAD+ levels), six (d-e: NAD+ levels) and three (c) independent biological replicates. Mean tumor volume ± s.e.m is shown (n=8 tumors/cohort) with statistical significance assessed using two-way ANOVA to calculate significance on repeated measurements over time. Bar plots are represented as mean ± s.d, analysed by one-way ANOVA with Tukey’s multiple comparisons test (a-e).

Comment in

References

    1. Roychowdhury S and Chinnaiyan AM. Translating genomics for precision cancer medicine. Annu Rev Genomics Hum Genet. 15: 395–415. 2014. - PubMed
    1. Mayers JR and Vander Heiden MG. Nature and Nurture: What Determines Tumor Metabolic Phenotypes. Cancer Res. 77(12): 3131–4. 2017. - PubMed
    1. Canto C et al. NAD(+) Metabolism and the Control of Energy Homeostasis: A Balancing Act between Mitochondria and the Nucleus. Cell Metabolism. 22(1):31–53. 2015 - PMC - PubMed
    1. Verdin E NAD+ in aging, metabolism, and neurodegeneration. Science. 350(6265):1208–1213. 2015. - PubMed
    1. Vander Heiden MG and DeBerardinis RJ. Understanding the Intersections between Metabolism and Cancer Biology. Cell. 168(4): 657–669. 2017. - PMC - PubMed

Supplementary References

    1. Heintzman ND. et al. Distinct and predictive chromatin signatures of transcriptional promoters and enhancers in the human genome. Nat Genet. 39: 311–318. 2007. - PubMed
    1. Cerami E et al. The cBio Cancer Genomics Portal: An Open Platform for Exploring Multidimensional Cancer Genomics Data. Cancer Discovery. 2 (5):_401–404. 2012. - PMC - PubMed
    1. Lonsdale J et al. The Genotype-Tissue Expression (GTEx) project. Nature Genetics 45:580–585. 2013. - PMC - PubMed
    1. Grossman RL. Toward a Shared Vision for Cancer Genomic Data. New England Journal of Medicine. 375(12):1109–1112. 2016. - PMC - PubMed
    1. Hartigan JA; Hartigan PM The Dip Test of Unimodality. Ann. Statist. 13 (1):70–84. 1985.

Publication types

MeSH terms

Substances