. 2019 May;569(7754):66-72.
doi: 10.1038/s41586-019-1146-y. Epub 2019 Apr 24.

Self-organization and symmetry breaking in intestinal organoid development

Affiliations

Self-organization and symmetry breaking in intestinal organoid development

Denise Serra et al. Nature. 2019 May.

Abstract

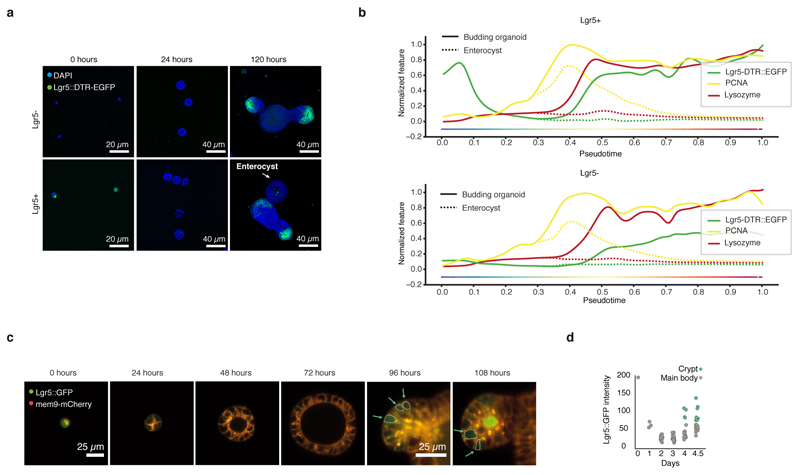
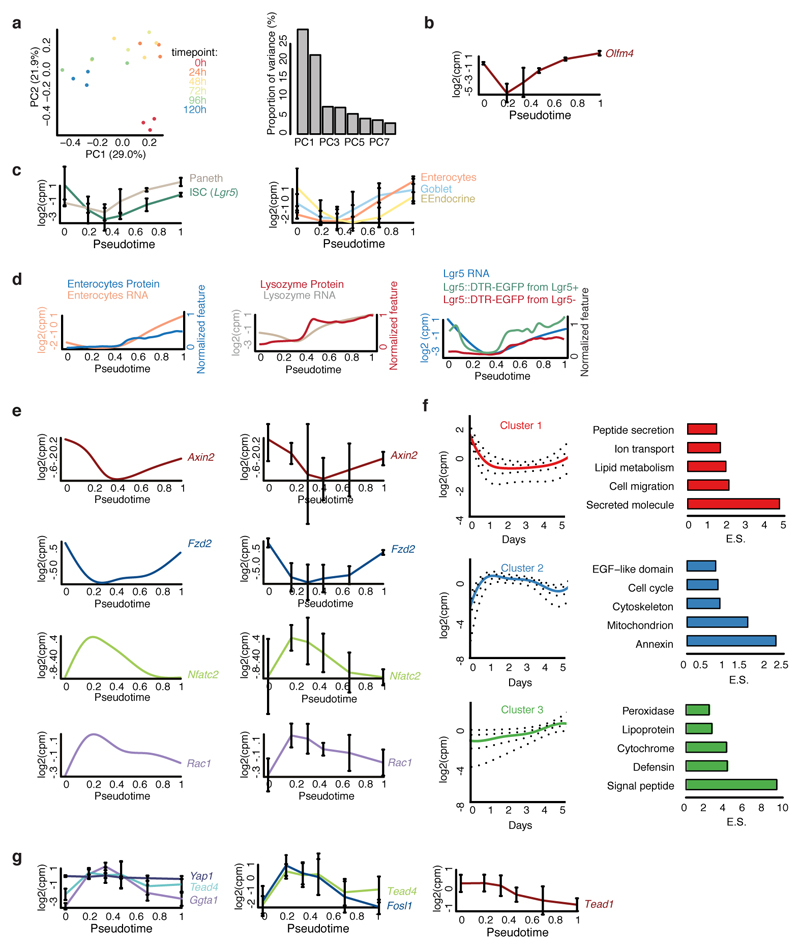
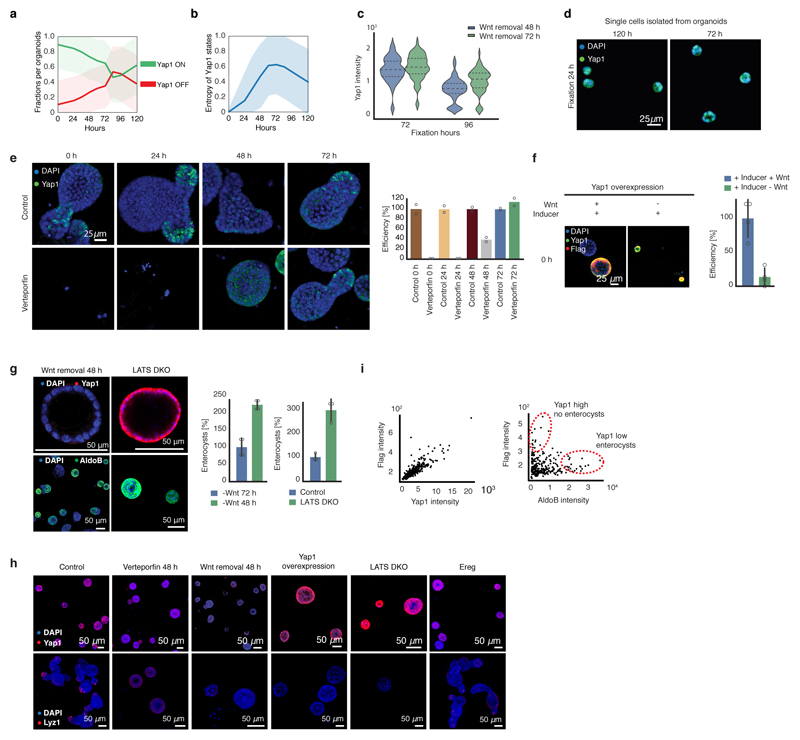
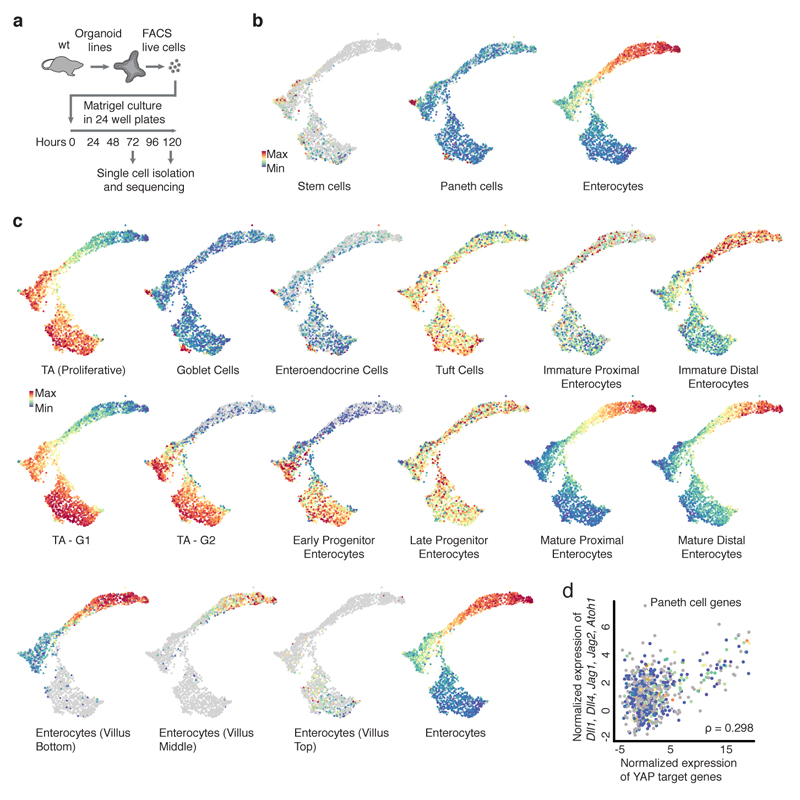
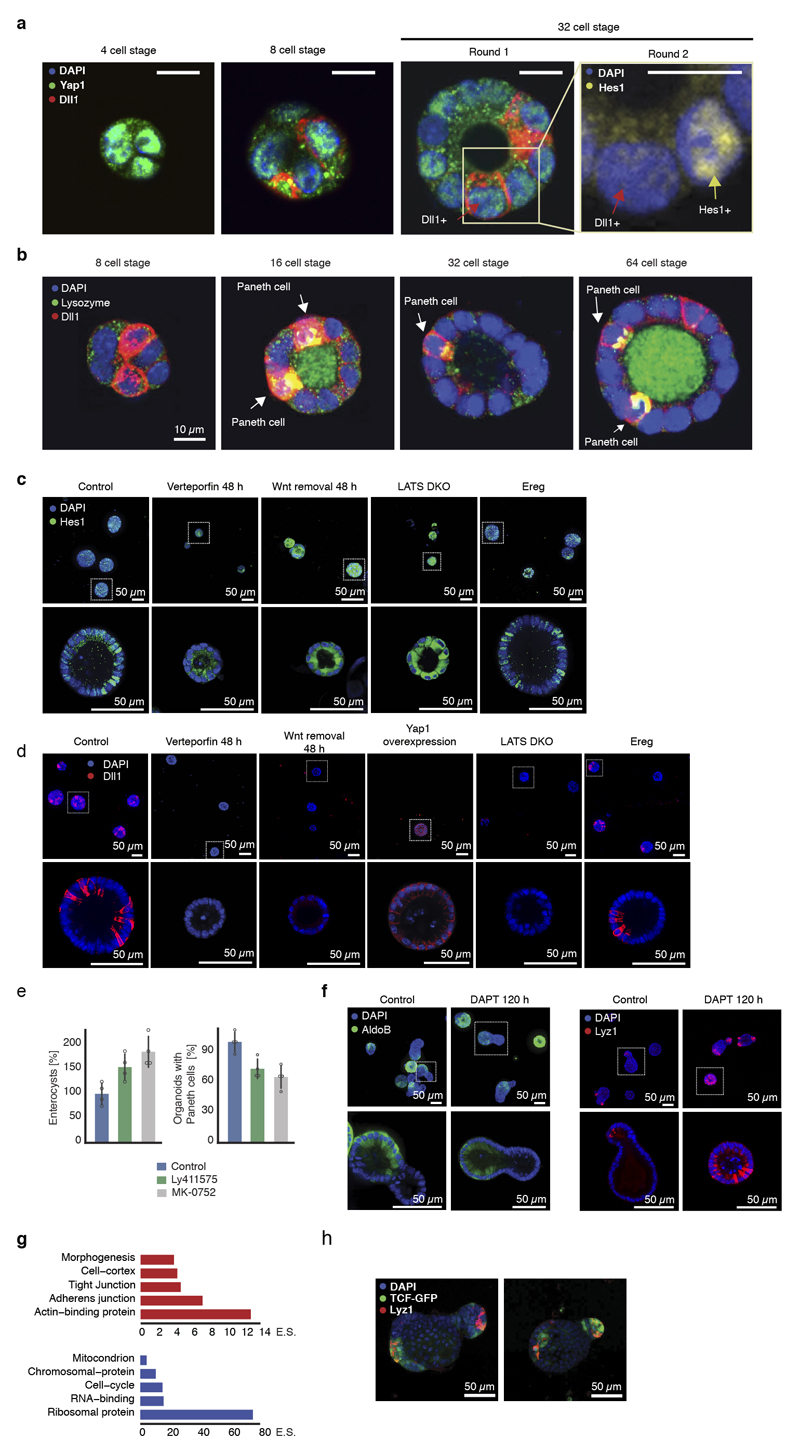
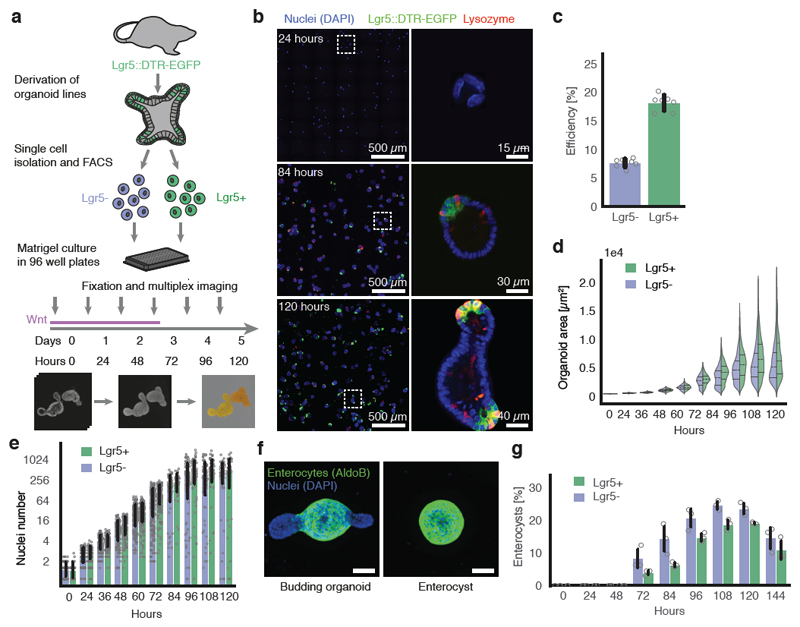
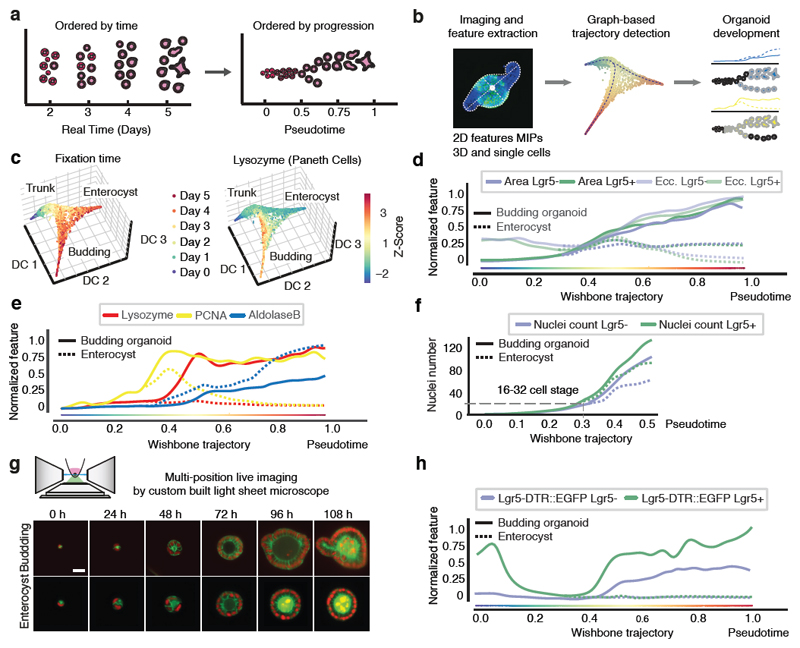
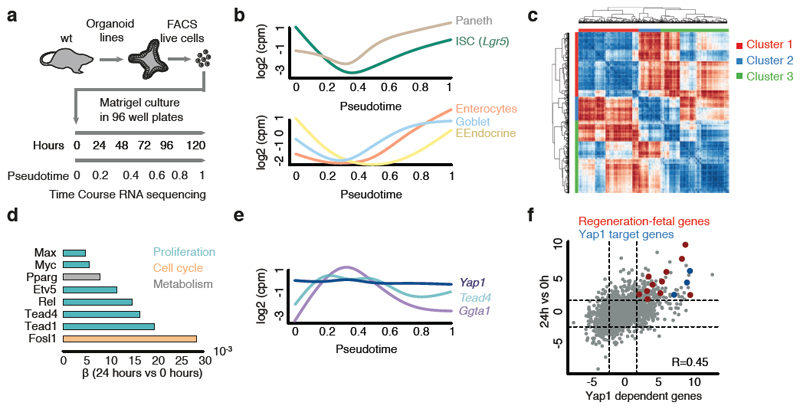
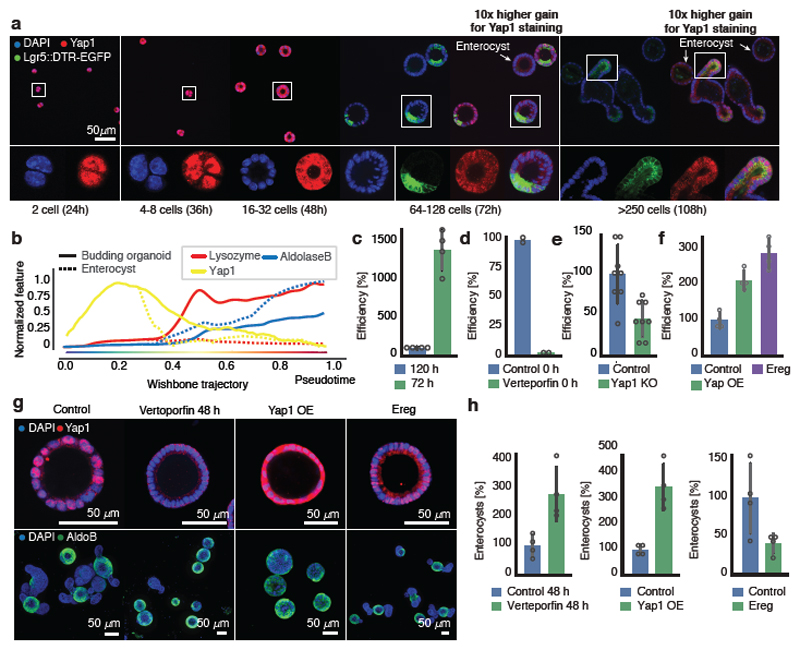
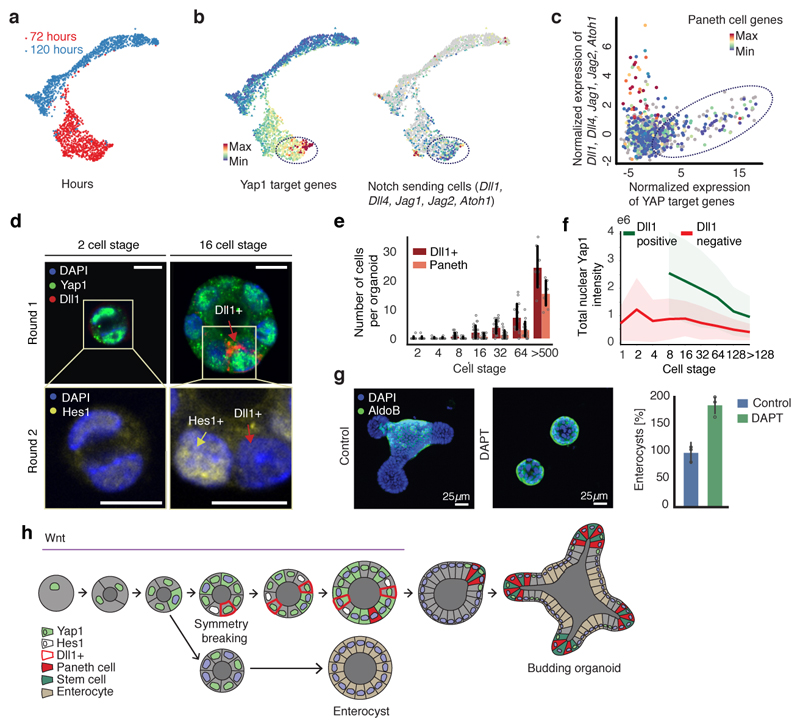
Intestinal organoids are complex three-dimensional structures that mimic the cell-type composition and tissue organization of the intestine by recapitulating the self-organizing ability of cell populations derived from a single intestinal stem cell. Crucial in this process is a first symmetry-breaking event, in which only a fraction of identical cells in a symmetrical sphere differentiate into Paneth cells, which generate the stem-cell niche and lead to asymmetric structures such as the crypts and villi. Here we combine single-cell quantitative genomic and imaging approaches to characterize the development of intestinal organoids from single cells. We show that their development follows a regeneration process that is driven by transient activation of the transcriptional regulator YAP1. Cell-to-cell variability in YAP1, emerging in symmetrical spheres, initiates Notch and DLL1 activation, and drives the symmetry-breaking event and formation of the first Paneth cell. Our findings reveal how single cells exposed to a uniform growth-promoting environment have the intrinsic ability to generate emergent, self-organized behaviour that results in the formation of complex multicellular asymmetric structures.


Conflict of interest statement

Competing interests: A.B. and P.S. co-founders of Viventis Microscopy Sàrl that commercializes the light-sheet microscope.

Figures

Extended Data Figure 1
Extended Data Figure 1. Intestinal organoids development from Lgr5+ and Lgr5-.
a, Lgr5+ and Lgr5- single cells sorted from Lgr5::DTR-EGFP reporter mouse 3h after FACS (left panel) with boxplot showing Lgr5::DTR-EGFP intensity quantification (right panel, n=602 for Lgr5+ and n=576 for Lgr5-, n=organoids). Boxplot elements show quartiles. Boxplot whiskers show 1.5 x the interquartile range. b, FACS histogram of GFP signal of Lgr5::DTR-EGFP single cells. Dashed boxes depict gating. c, Representative images of 4i imaging showing the same organoids stained with DAPI, GFP, Lysozyme, PCNA, AldolaseB and Cell Trace. d, Distribution of eccentricity at 120h of development for Lgr5+ and Lgr5- starting populations (Lgr5+ n=463, Lgr5- n=711, n=organoids). e, Representative images of Lgr5+ and Lgr5- cells at 120h of development. Enlargements (bottom panel): Budding organoids and enterocysts. f, Representative images of enterocysts stained with DAPI, different cell type and proliferation markers. g, Left panel: representative images of organoids grown from Lgr5+ and Lgr5- single cells in presence of Wnt signaling inhibition (IWP-2 2 μM) or activation (CHIR99021 5 μM). Organoids are fixed at 120h and stained for nuclear marker (DAPI) and enterocyte marker (AldoB). Top-row shows complete wells overview, while bottom-row shows zoom-in examples of single organoid. Right panel: quantification of enterocysts at 120h of organoid development after Wnt signaling inhibition (IWP-2 2 μM) or activation (CHIR99021 2 μM) (n=2 replicates). Barplots show mean values.
Extended Data Figure 2
Extended Data Figure 2. Feature selection for organoid development.
a, Pearson correlation cluster gram between the 14 selected features used for trajectory inference (n=23421 organoids). b, 14 selected features are grouped based on the underlying information c, Comparison between eccentricities calculated on projected images and on 3D volumes (n=16175 organoids). d, Number of in-focus planes at different time points in cleared and un-cleared organoids (n=2310, n=organoids). Planes are classified as in-focus with a logistic regression using the ratio of maximum in-plane intensity to maximum intensity in the whole stack as feature. shades: s.d. e, Diffusion-maps for pooled Lgr5+ and Lgr5-organoids (14 selected features, n=23421 organoids) color-coded: starting population and pseudotime. f, Diffusion maps for Lgr5- (first column, 14 selected features, n=13623), Lgr5+ (second column, 14 selected features, n=9798) and for the pooled dataset with the full feature set (third column, 66 features, n=23421) color coding: enterocytes (AldoB), PCNA, Paneth cells (Lysozyme), organoid area, eccentricity and SVM for enterocysts.
Extended Data Figure 3
Extended Data Figure 3. Cell types and proliferation markers along organoid development trajectories.
Proliferation (PCNA) and cell type marker (Lysozyme and AldolaseB) trends on pseudotime for Lgr5+ (n=9798) and Lgr5- (n=13623).
Extended Data Figure 4
Extended Data Figure 4. Dual illumination inverted light sheet for organoids imaging.
a, Cross-sectional view of objective mounting block showing illumination paths (light blue dashed line) and imaging path (green dashed line). Illumination and imaging objective are solid mounted in the aluminum block and immersed in water contained in the reservoir (black arrow). b, Side view of microscope objectives arrangement: the sample embedded in Matrigel (red arrow) is held on the FEP membrane (black arrow) mounted in a sample holder and positioned between the two illumination objectives. c, Organoids handling procedure: Grown organoids are dissociated and single cells are embedded in Matrigel. Multiple Matrigel drops can be transferred into the imaging chamber allowing imaging parallelization. d, Illustration of image improvement by double illumination. Scattering of single illumination beam by the organoid prevents complete and homogenous illumination (red arrows). This problem is minimized by double illumination. Scale bar: 25μm. e, Representative images of an organoid expressing H2b-mCherry (red) and membrane bound GFP (green). Slices every 20 μm across the organoid volume are shown. Scale bar: 25μm. f, Workflow of light sheet data analysis. g, Morphological features (major axis, area and volume) derived from light sheet imaging. Budding organoids n=6, enterocysts n=3. h, Dynamic time warp mapping of light sheet data onto the trajectory. Budding organoid branch for mean area progression inferred from the trajectory (orange line, n=23421) and mean area progression extracted from time-lapse light sheet imaging (violet line, n=6) before morphing (left panel) and after morphing (right panel). Red dots indicate positions of real time (h) relative to pseudotime. Shades: s.d.
Extended Data Figure 5
Extended Data Figure 5. Lgr5 dynamics during organoid development.
a, Representative images of organoids grown from Lgr5+ and Lgr5- starting populations at 0, 24 and 120h of development. b, Cell types and proliferation markers plotted on pseudotime for Lgr5+ (top panel, n=9798) and Lgr5- (bottom panel, n=13623) starting populations. c, Light-sheet time-lapse imaging of organoid formation starting from a single Lgr5+ cell (GFP signal) expressing membrane bound mCherry (mem9-mCherry). Green arrows are pointing to cells re-acquiring GFP signal from Lgr5 reporter in the organoid crypts. d, Quantification of GFP signal of Lgr5 reporter from time lapse shown in panel c. Cells localized in the organoid crypt are plotted in green, cells localized outside the crypt and on the main body are plotted in grey (n=91 cells).
Extended Data Figure 6
Extended Data Figure 6. Bulk RNA sequencing analysis.
a, PCA analysis of time-course (0h - 120h) bulk RNA-sequencing shows no mouse or batch effect (n=3 biological replicates). b, Unsmoothed gene expression profile mapped on pseudotime trajectory of stem cell marker Olfm4. c, Unsmoothed gene expression profiles mapped on pseudotime trajectory of cell-type specific genes. Paneth cell = Lyz1, ISC = Lgr5, Enterocyte = Apoc3, Goblet cell = Muc2, Enteroendocrine cell = Sst. d, Left panel: protein abundance of Enterocyte marker AldoB and gene expression profile of Enterocyte marker Apoc3 mapped on pseudotime trajectory. Middle panel: protein abundance and gene expression profile of Paneth cell marker Lyz1 mapped on pseudotime trajectory. Right panel: protein abundance and gene expression profile of ISC marker Lgr5 mapped on pseudotime trajectory. e, Smoothed and unsmoothed gene expression profile of canonical Wnt target gene Axin2, Fzd2 and non-canonical target genes Nfatc2 and Rac1. f, Mean expression profile for each cluster and relative quantiles (0.05, 0.25, 0.50, 0.75, 0.95). Annotation enrichments are shown on the right. Enrichment Score (E.S.). g, Unsmoothed gene expression profile of Yap1, Tead4, Ggta1 and top 3 transcription factors (Tead1, Tead4 and Fosl1) contributing to differential gene expression between 24h – 0h. (b, c, e, g) Mean values are shown with error bars corresponding to standard deviation (n=3 biological replicates).
Extended Data Figure 7
Extended Data Figure 7. Yap1 is necessary but not sufficient for organoid formation.
a, Fraction of cells per organoid having Yap1 in ON state (green, nuclear localization) or in OFF state (red, cytoplasm localization) over time (n=1074 organoids). b, Entropy of Yap1 states (i.e. variability in Yap1 activation ON and OFF state) over time (n =1074 organoids). (a, b) Shades show s.d. c, Quantification of Yap1 mean intensity after Wnt removal at 48h or 72h in organoids fixed at 72h or 96h (n=4 replicates). Violin plot lines show quartiles. d, Images of organoids derived from single cells isolated from organoids at 72h or at 120h. e, Organoids treated at different time points with control or with Verteporfin. Fixation at 96h. Left: representative images, right: efficiency quantification (normalization: control, n=2 replicates). Barplots: mean. f, Yap1 overexpressing organoids with or without Wnt. Fixation at 96h. Left: representative images, right: efficiency quantification (normalization: control, n=4 replicates, two-sided t-test, p-value 0.001). g, Left: images of organoids with Wnt removal at 48h or LATS DKO. Top-row: fixation at 72h. Bottom-row: fixation at 96h (Wnt removal 48h) or 120h (LATS DKO). Right: quantification of enterocysts as retrieved in the left panel. (n=4 replicates for Wnt removal 48h and two-sided t-test, p-value 0.0001, n=3 replicates for LATS DKO and two-sided t-test p-value 0.002). h, Representative images of control, Verteporfin treatment at 48h, Wnt removal at 48h, Yap1 overexpression, LATS DKO or treatment with Ereg. Top-row: Fixation at 72h. Bottom-row: Fixation at 96h (Wnt removal 48h, Yap1 overexpression, LATS DKO) or 120h (control, Verteporfin 48h, Ereg). i, Scatterplot of Flag mean intensity signal and Yap1 mean intensity signal (left) and of Flag mean intensity and AldoB mean intensity (right) in Yap1 overexpressing organoids at 96h. (f, g) Barplots: mean ± s.d.
Extended Data Figure 8
Extended Data Figure 8. Griph robustness analysis and comparison to other methods.
Comparison of Griph lower dimensional embedding (Griph/LargeVis) to different embedding approaches (PCA, PCA combined with t-SNE, diffusion maps) and analysis of method sensitivity for variable gene selection. Five different sets of variable genes have been selected (using Griph to retain 10%, 25% or 50% of genes per bin, by Michaelis-Menten fitting of the gene dropout rates as implemented in M3Drop, or by the mean-variance fitting procedure described in Brennecke et al., 2013) and analyzed. a, First and second dimension are shown and results are color-coded for Enterocytes marker genes (as in Fig. 5b) and b, Yap1 target genes (as in Fig. 5c). n= 1863 cells.
Extended Data Figure 9
Extended Data Figure 9. scRNA analysis.
a, Experimental workflow for single cell RNA-sequencing. b, Griph-based visualization of single cell degree of expression of Stem cell, Paneth cell and Enterocyte marker genes. c, Griph-based visualization of single cell degree of expression of Transient Amplifying cells, Goblet cells, Enteroendocrine cells, Tuft cells, Immature Proximal Enterocytes, Immature Distal Enterocytes, Transient Amplifying cells G1-phase, Transient Amplifying cells G2-phase, Early progenitor enterocytes, Late progenitor enterocytes, Mature proximal enterocytes, Mature distal enterocytes, Enterocytes (Villus Bottom), Enterocytes (Villus Middle), Enterocytes (Villus Top) and Enterocytes marker genes. d, Spearman correlation between Yap1 target genes expression and Dll1, Dll4, Jag1, Jag2, Atoh1 expression in single cells 120h not expressing Paneth, Goblet, Enteroendocrine, Enterocyte and Stem cell markers (n=696 cells).
Extended Data Figure 10
Extended Data Figure 10. Yap1 cell-to-cell variability allow a Notch/Dll1 event and symmetry breaking.
a, Images showing Yap1 variability and Dll1+ cells. Zoom in: nuclear localization of Hes1 in the same organoid. Arrows: Red (Dll1+ cells), yellow (Hes1+). Scale bar=10 μm. b, Images showing overlap of Paneth cells with Dll1+ cells. c, MIP images (top row) and zoom-in single plane images (bottom row) of: control, Verteporfin added at 48h, Wnt removal at 48h, LATS DKO and Ereg treatment. Organoids are fixed at 72h. d, MIP images (top-row) and zoom-in single plane images (bottom-row) of: control, Verteporfin added at 48h, Wnt removal at 48h, Yap1 overexpression, LATS DKO and Ereg treatment. Organoids are fixed at 72h. e, Fraction of enterocysts (left panel) and fraction of organoids with Paneth cells (right panel) for control and organoids treated with Ly411575 or MK-0752 at 0h. Fixation at 120h. (normalization: control, n=4 replicates, two-sided t-test, p-value Ly411575 0.009, MK-0752 0.003). Barplots: mean ± s.d. f, MIP images (top-row) and zoom-in single plane images (bottom-row) of organoids treated with control or DAPT at 120h and fixed at 144h and stained for AldoB (left panel) or Lys1 (right panel) g, Top panel: annotation enrichment of genes correlated with Yap1 target genes expression in cells expressing Yap1 target genes and Dll1, Dll4, Jag1, Jag2, Atoh1 genes. Bottom panel: annotation enrichment of genes anti-correlated with Yap1 target genes expression in cells expressing Yap1 target genes and Dll1, Dll4, Jag1, Jag2, Atoh1 genes. Enrichment Score (E.S.). h, MIP images of organoids at 120h, showing canonical Wnt signalling response (TCF-GFP) in cells neighbouring Paneth cells.
Figure 1
Figure 1. Intestinal organoids development from Lgr5+ and Lgr5- single cells.
a, Workflow of organoid development time-course from Lgr5+ and Lgr5- FACS sorted single cells (Lgr5::DTR-EGFP mice). b, Representative images of organoids (nuclei (DAPI)), stem cells (Lgr5::DTR-EGFP), Paneth cells (Lysozyme). Left column: maximum intensity projections (MIP). Right column: single plane zoom-in. c, Lgr5+ higher efficiency of organoid formation (n=7 for each condition, n=replicates, two-sided t-test, p-value 7.6*10-10). d, Organoid area (n=9798 Lgr5+, n=13623 Lgr5-, n=organoids), violin plot lines: quartiles for each group. e, Nuclei number (n=2829, n=organoids). f, Representative images of budding organoids and enterocysts. Scale bar = 50 μm. g, Relative amount of enterocysts over time (n=3 replicates for each condition, two-sided t-test at 120h, p-value 0.019). (c, e, g) Barplots: mean ± s.d.
Figure 2
Figure 2. Trajectory of organoid development.
a, b, Pseudotime ordering and trajectory inferences. c, Diffusion-maps for pooled Lgr5+ and Lgr5-organoids (n=23421), color-coding: fixation time and Lysozyme intensity (Paneth cells). d, Morphological features on pseudotime of Lgr5+ (n=9798) and Lgr5- (n=13623). e, Cell types and proliferation markers on pseudotime (n=23421). f, Nuclei number on pseudotime for Lgr5+ (n=4104), Lgr5- (n=5593). Dashed lines: cell state around the branch point. g, Custom built light-sheet and imaging of single cells forming budding organoids or enterocysts (H2B-mCherry, red; mem9-GFP, green). Single planes in the middle of organoids. Scale bar = 25 μm. h, Lgr5::DTR-EGFP reporter signal on pseudotime of Lgr5+ (n=9798), Lgr5- (n=13623).
Figure 3
Figure 3. Yap1 target genes are transiently expressed during organoids development.
a, Workflow for bulk RNA-sequencing time-course. b, Expression profiles of cell-type markers mapped on pseudotime. Paneth cells (Lysozyme), ISCs (Lgr5), Enterocytes (Apolipoprotein), Goblet cells (Mucin 2), EEndocrine cells (Somatostatin). c, Hierarchical clustering of gene expression correlation profiles. d, Magnitude of contribution (β) of transcription factors to differential expression 24h vs 0h. e, Gene expression profiles of Yap1, Tead4 and Ggta1 mapped on pseudotime. f, Pearson correlation between genes expressed 24h vs 0h and genes expressed in Yap1 overexpression (OE) vs knockdown (KD). n=3 organoid cultures from 3 independent mice.
Figure 4
Figure 4. Transient Yap1 activation is necessary for symmetry breaking.
a, Yap1 localization (Lgr5::DTR-EGFP). b, Yap1 protein abundance along pseudotime (n=6892, n=organoids). c, Efficiency of organoids formation from cells isolated at 72h and at 120h (normalization: 120h). Fixed: 72h (n=4, n=replicates, two-sided t-test, p-value 0.00007). d, Efficiency of organoid formation in Verteporfin (normalization: control). Fixed: 48h (n=2, n=replicates). e, Efficiency of organoid formation from Yap1 KO (normalization: control). Fixed: 72h (n=8, n=replicates, two-sided t-test, p-value 0.002). f, Efficiency of organoid formation from Yap1 overexpression and Ereg activation (normalization: control). (n=4, n=replicates, two-sided t-test, p-value: Yap1OE-0.001, Ereg-0.0002). g, Images of organoids treated with Verteporfin (at 48h), Yap1-overexpression and Ereg. Top panel: fixed at 72h. Bottom panel: fixed at 96h (Yap1-overexpression) or 120h (Control, Verteporfin, Ereg). h, Quantification of enterocysts as retrieved in g. (normalization: control). (n=4, n=replicates, two-sided t-test, p-value Verteporfin-0.01, Yap1 OE-0.002, Ereg-0.05). (c, d, e, f, h) Barplots: mean ± s.d.
Figure 5
Figure 5. Yap1 cell-to-cell variability allow Notch/Dll1 activation and symmetry breaking.
a, Griph-based visualization (72h and 120h) of single cells. b, Single-cell expression of Yap1 targets and Notch ligand. Dotted square: high Yap1 targets expressing cells. c, Spearman correlation between Yap1 target genes and Notch ligand expression at 72h (n=798, n=cells). d, Multiplexed imaging Yap1 variability and Dll1+ cells. Upper panel: nuclei, Yap1 (green), Dll1(red). Lower panel: nuclei and Hes1 (yellow). Arrows: Red (Dll1+ cells), yellow (Hes1+). Scale bar=10 μm. e, Number of Dll1+ and Paneth cells (n=170, n=organoids). f, Nuclear Yap1 intensity in Dll1+ (green) and Dll1- (red) cells (n=73899, n=cells). Shadows: s.d. g, Left panel: images of organoid treated with DAPT. Fixed 96h. Right panel: quantification of fraction of enterocysts (normalization: control). Fixed 96h (n=3, n=replicates, two-sided t-test, p-value 0.003). h Model of organoid development and symmetry breaking. (e, g) Barplots: mean ± s.d.

Comment in

Similar articles

Cited by

References

    1. Sasai Y. Cytosystems dynamics in self-organization of tissue architecture. Nature. 2013;493:318–326. - PubMed
    1. Ohnishi Y, et al. Cell-to-cell expression variability followed by signal reinforcement progressively segregates early mouse lineages. Nat Cell Biol. 2014;16:27–37. - PMC - PubMed
    1. Goolam M, et al. Heterogeneity in Oct4 and Sox2 Targets Biases Cell Fate in 4-Cell Mouse Embryos. Cell. 2016;165:61–74. - PMC - PubMed
    1. Hanna J, et al. Direct cell reprogramming is a stochastic process amenable to acceleration. Nature. 2009;462:595–601. - PMC - PubMed
    1. Eldar A, Elowitz MB. Functional roles for noise in genetic circuits. Nature. 2010;467:167–173. - PMC - PubMed

MeSH terms