. 2019 May;569(7754):141-145.
doi: 10.1038/s41586-019-1135-1. Epub 2019 Apr 24.

Serotonin transporter-ibogaine complexes illuminate mechanisms of inhibition and transport

Affiliations

Serotonin transporter-ibogaine complexes illuminate mechanisms of inhibition and transport

Jonathan A Coleman et al. Nature. 2019 May.

Abstract

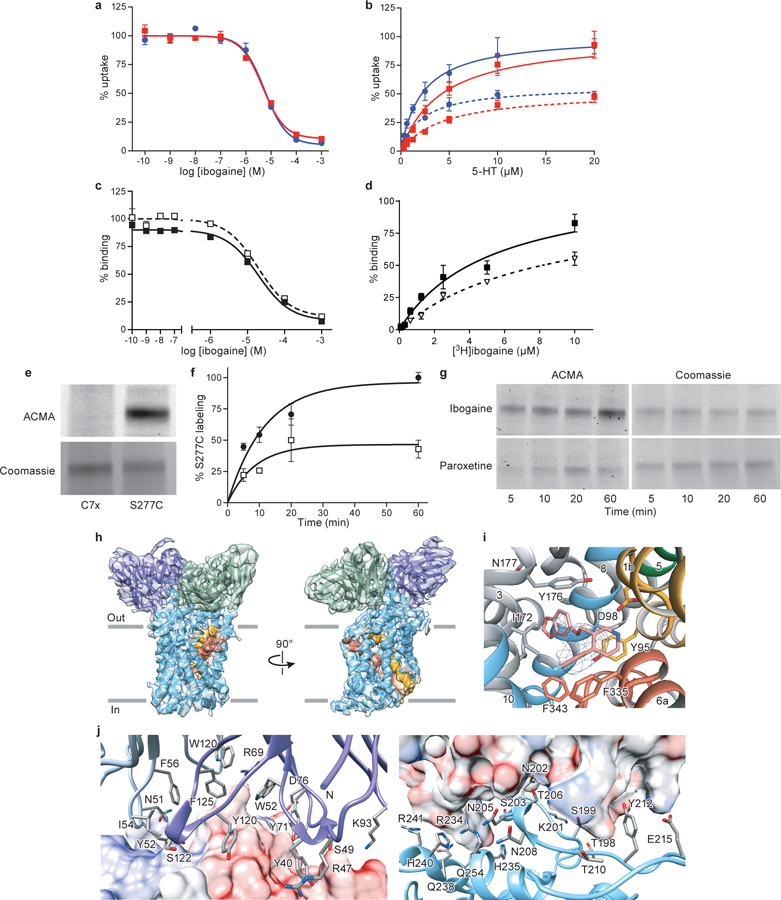
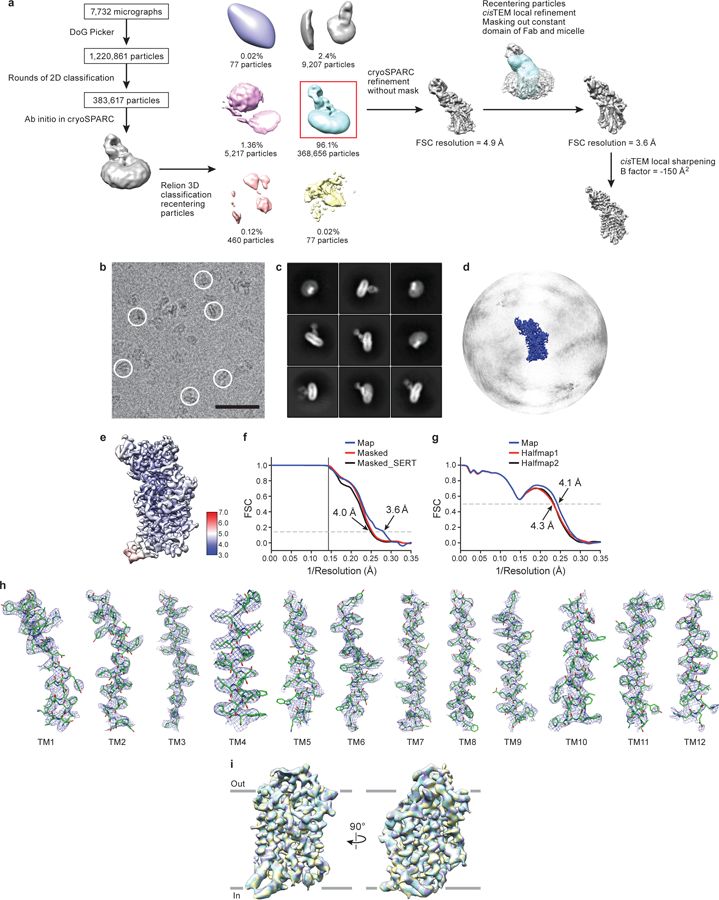
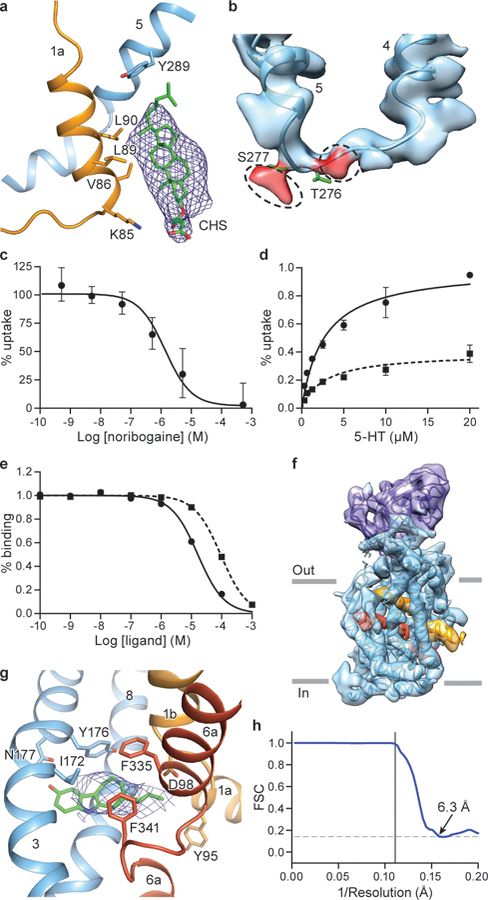
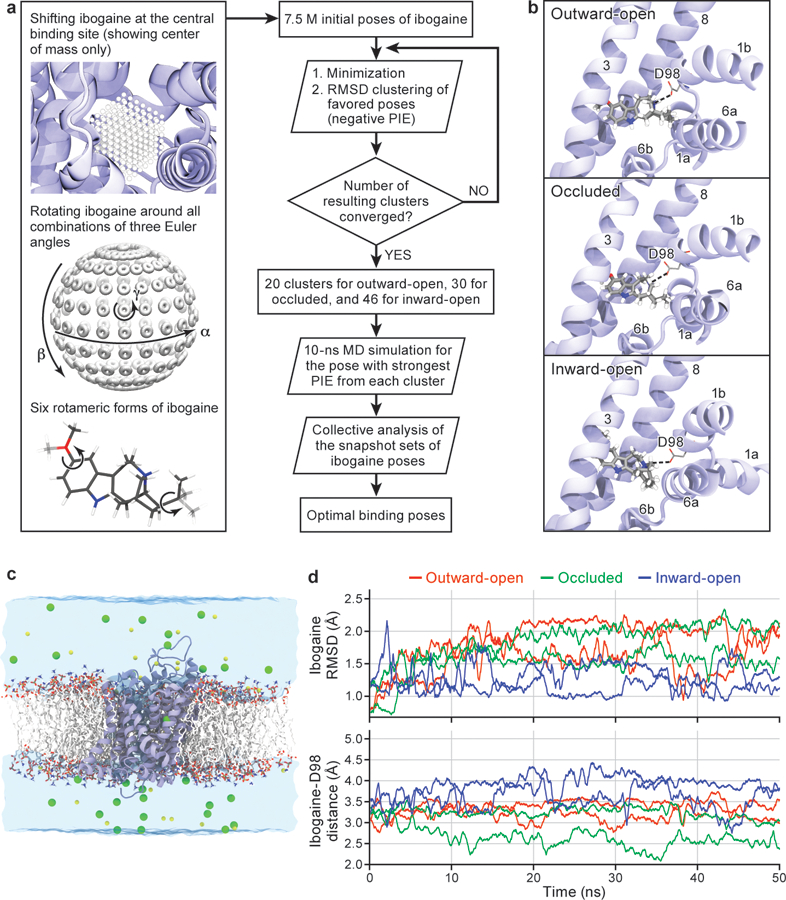
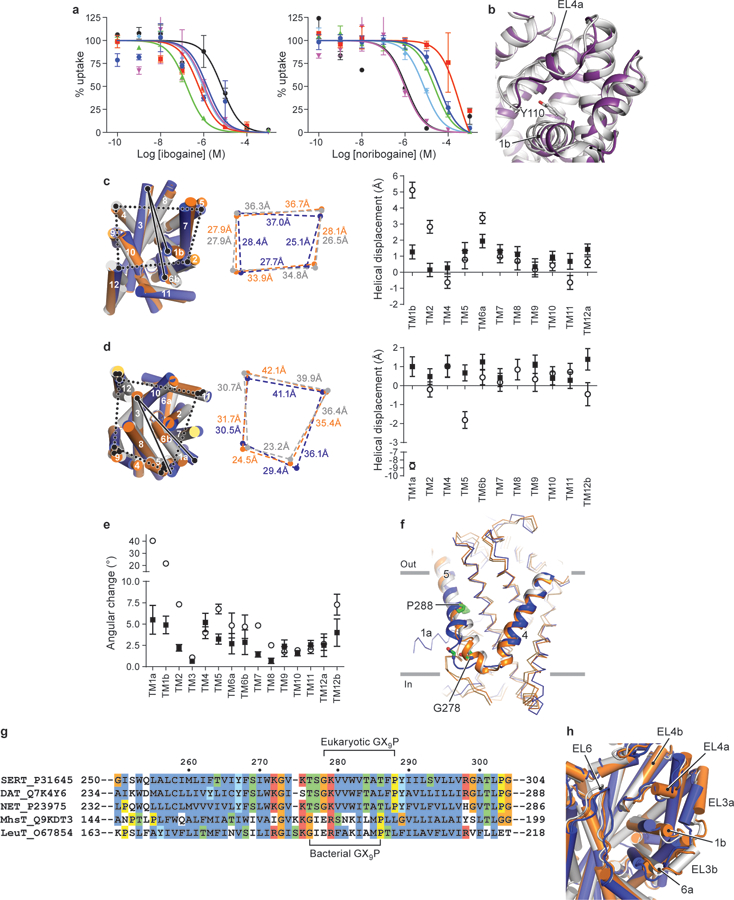
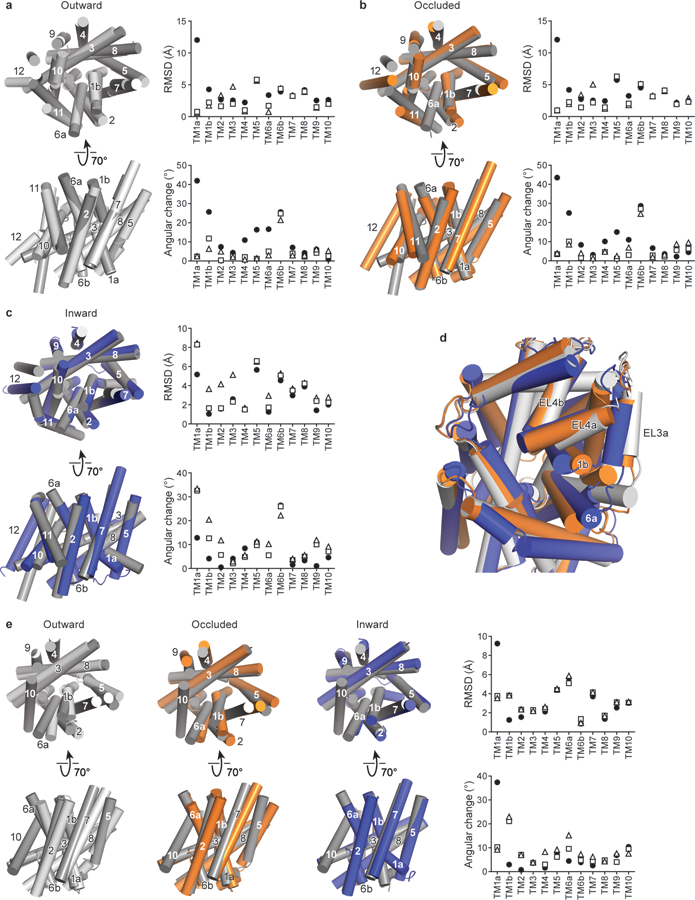
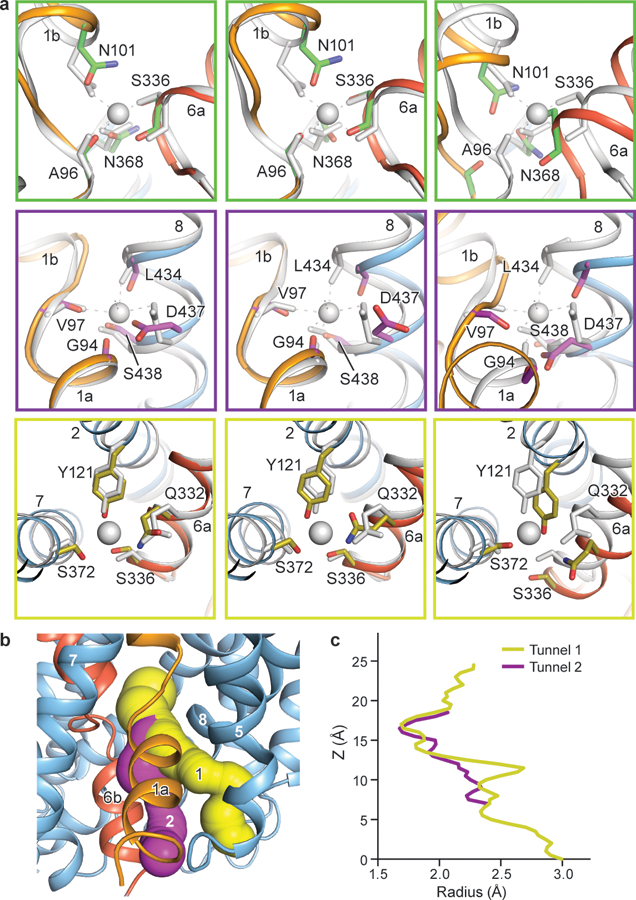
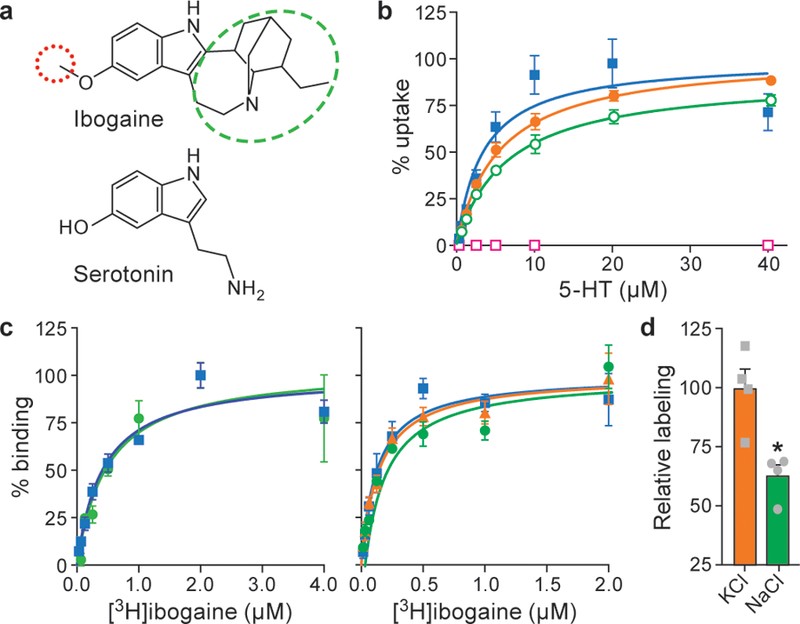
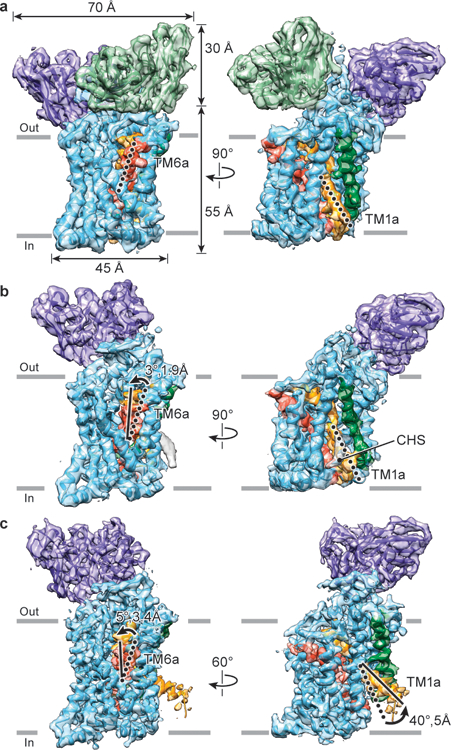
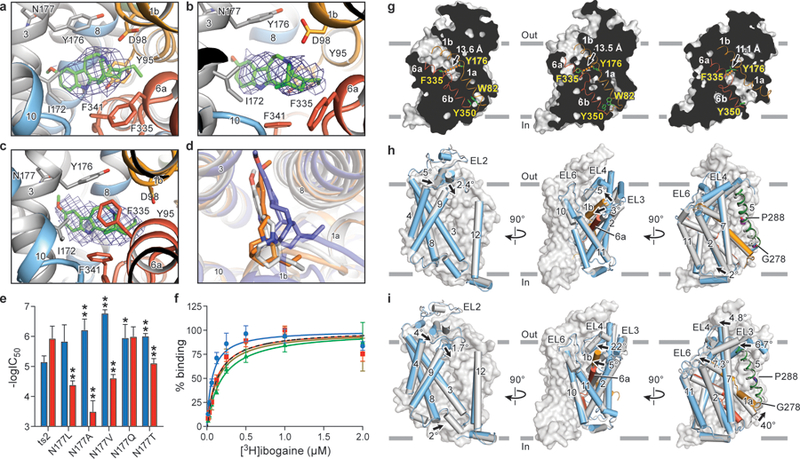
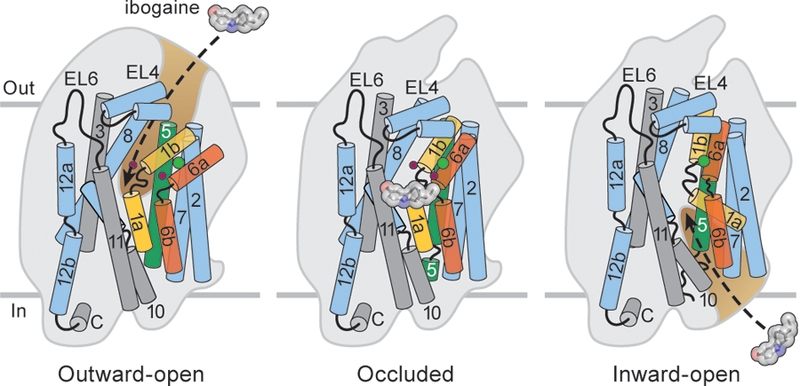
The serotonin transporter (SERT) regulates neurotransmitter homeostasis through the sodium- and chloride-dependent recycling of serotonin into presynaptic neurons1-3. Major depression and anxiety disorders are treated using selective serotonin reuptake inhibitors-small molecules that competitively block substrate binding and thereby prolong neurotransmitter action2,4. The dopamine and noradrenaline transporters, together with SERT, are members of the neurotransmitter sodium symporter (NSS) family. The transport activities of NSSs can be inhibited or modulated by cocaine and amphetamines2,3, and genetic variants of NSSs are associated with several neuropsychiatric disorders including attention deficit hyperactivity disorder, autism and bipolar disorder2,5. Studies of bacterial NSS homologues-including LeuT-have shown how their transmembrane helices (TMs) undergo conformational changes during the transport cycle, exposing a central binding site to either side of the membrane1,6-12. However, the conformational changes associated with transport in NSSs remain unknown. To elucidate structure-based mechanisms for transport in SERT we investigated its complexes with ibogaine, a hallucinogenic natural product with psychoactive and anti-addictive properties13,14. Notably, ibogaine is a non-competitive inhibitor of transport but displays competitive binding towards selective serotonin reuptake inhibitors15,16. Here we report cryo-electron microscopy structures of SERT-ibogaine complexes captured in outward-open, occluded and inward-open conformations. Ibogaine binds to the central binding site, and closure of the extracellular gate largely involves movements of TMs 1b and 6a. Opening of the intracellular gate involves a hinge-like movement of TM1a and the partial unwinding of TM5, which together create a permeation pathway that enables substrate and ion diffusion to the cytoplasm. These structures define the structural rearrangements that occur from the outward-open to inward-open conformations, and provide insight into the mechanism of neurotransmitter transport and ibogaine inhibition.


Conflict of interest statement

The authors declare no competing interests.

Figures

Extended Data Figure 1.
Extended Data Figure 1.. Non-competitive inhibition of transport by ibogaine, ibogaine binding to outward-open, detection of the inward-open conformation, and the paroxetine ts2-inactive reconstruction.
a, Ibogaine inhibition of 5-HT transport for wild type (blue, circles) and ts2 (red, squares) variants using 20 μM [3H]5-HT. Symbols show the mean derived from n=3 biological replicates. Error bars show the s.e.m. Experiment was performed three times independently with the same results. b, Michaelis–Menten plots of 5-HT uptake for wild type (blue) transporter in the absence (circles), or in the presence (dash, circles) of 5 μM ibogaine, and for ts2 (red) in the absence (squares), or in the presence (dash, squares) of 5 μM ibogaine. Symbols show the mean derived from n=3 biological replicates. Error bars show the s.e.m. Experiment was performed three times independently with the same results. The mean Km and error (s.e.m.) of curve fitting for ΔN72,C13: 2.2 ± 0.3 µM; ts2-active: 4 ± 1 µM. c, Competition binding of ibogaine with [3H]paroxetine for ts2 in the absence (filled squares) or presence (open squares) of 1μM 15B8 and 8B6 yields a Ki value 3.2 ± 0.4 µM. Symbols show the mean derived from n=3 technical replicates. Error bars show the s.e.m. The mean Ki and error (s.e.m.) of curve fitting are reported. Experiment was performed three times independently with the same results. d, [3H]-ibogaine saturation binding experiments of ts2-inactive and ts2-active 15B8 Fab/8B6 scFv complex in 100 mM NaCl, and corresponding mean Kd values derived from the curve fit: ts2-inactive (filled squares, > 5 µM), ts2-active 15B8 Fab/8B6 scFv complex (open triangles, > 8 µM). Symbols show the mean derived from n=6 biological replicates. Error bars show the s.e.m. Experiment was performed twice with similar results. e, SDS-PAGE of Ser277Cys labeling with MTS-ACMA compared with the C7X construct in nanodiscs in the presence of 1 mM ibogaine and 100 mM NaCl. There is no detectable labeling of the C7X construct. Experiment was performed three independent times with similar results. f, Time-dependent labeling of Ser277Cys (background construct: ts2-active, C7X) with MTS-ACMA in the presence of ibogaine (filled circles) and paroxetine (open squares) in 100 mM NaCl. Symbols show the mean derived from n=3 technical replicates. Error bars show the s.e.m. Experiment was performed three times with similar results. g, Analysis of Ser277Cys labeling experiments using MTS-ACMA in the presence of ibogaine or paroxetine analyzed by SDS-PAGE and visualized by in-gel fluorescence. Experiment was performed three independent times with similar results. h, Three-dimensional reconstruction and fit to the density map with the model derived from the paroxetine-bound x-ray structure (PDB code: 6AWN). SERT is cyan, 15B8 is purple and 8B6 is green; TM1 and TM6 are orange and red, respectively. i, The fit of paroxetine into the EM density map (blue mesh) and interacting residues. j, Left panel, details of the 15B8-SERT interface with the EL2 region shown as an electrostatic surface potential map and 15B8 shown in ribbon representation. The Fab is colored dark blue (heavy chain) or light blue (light chain), selected Fab residues within 5 Å of SERT are shown as sticks. The right panel is a similar view but with the Fab shown as a semitransparent electrostatic surface potential. EL2 of SERT is shown in ribbon representation and colored cyan.
Extended Data Figure 2.
Extended Data Figure 2.. Cryo-EM reconstruction of ts2-inactive 15B8 Fab/8B6 scFv/paroxetine complex.
a, Work-flow of cryo-EM data processing of the ts2-inactive Fab/scFv complex with paroxetine in outward-open conformation. After particle picking, particles were sorted using 2D classification. 3D ab-initio classification was performed after 2D classification on cryoSPARC. One out of two predominant classes (boxed) exhibited a subset of homogeneous particles which were used for further processing and global alignment in cryoSPARC. The other class upon refinement only yielded a low-resolution map which did not exhibit any significant differences upon comparison between classes. cisTEM local refinement improved the resolution upon masking of the Fab constant domain and micelle (mask is shown overlaid in blue on top of the reconstruction). The final reconstructed volume was sharpened using Phenix. b, Representative cryo-EM micrograph. Individual single particles are circled in white. Bar equals 50 nm. c, 2D class averages after three rounds of classification. d, The angular distribution of particles used in the final reconstruction. e, Cryo-EM density map colored by local resolution estimation. f, FSC curves for cross-validation, the final map (blue), masked SERT-Fab complex (red), and a mask which isolated SERT (black). The high-resolution limit cutoff for refinement was 7.5 Å. g, model vs. half map 1 (working, red), half map 2 (free, black), model vs. final map (blue). h, Cryo-EM density segments of TM1 - TM12. i, A spherical mask placed over SERT was used for focused 3D classification with 3 classes. Comparison of the classes did not reveal any substantial differences. The antibodies were removed for clarity. The number of particles belonging to each class average are: class 1, purple (11.9%, 25,530 particles); class 2, yellow (54.9%, 117,781 particles); class 3, cyan (33.2%, 71,226 particles).
Extended Data Figure 3.
Extended Data Figure 3.. Cryo-EM reconstruction of ts2-active 15B8 Fab/8B6 scFv/ ibogaine complex.
a, Work-flow of cryo-EM data processing of the ts2-active Fab/scFv complex with ibogaine in outward-open conformation. After particle picking, particles were sorted using 2D classification. Ab-initio was performed in cryoSPARC after 2D classification to obtain an initial reconstruction. Particles were used for further processing and global alignment in cryoSPARC followed by recentering in Relion and calculation of the local CTF using GCTF. cisTEM local refinement improved the resolution upon masking of the Fab constant domain and micelle (mask is shown overlaid in blue on top of the reconstruction). The final reconstructed volume was sharpened using cisTEM. b, Representative cryo-EM micrograph. Individual single particles are circled in white. Bar equals 50 nm. c, 2D class averages after three rounds of classification. d, The angular distribution of particles used in the final reconstruction. e, Cryo-EM density map colored by local resolution estimation. f, FSC curves for cross-validation, the final map (blue), masked SERT-Fab complex (red), and a mask which isolated SERT (black). The high-resolution limit cutoff for refinement was 7.5 Å. g, Model vs. half map 1 (working, red), half map 2 (free, black), model vs. final map (blue). h, Cryo-EM density segments of TM1 – TM12. i, A spherical mask placed over SERT was used for focused 3D classification with 3 classes. Comparison of the classes did not reveal any substantial differences. The antibodies were removed for clarity. The number of particles belonging to each class average are: class 1, purple (33.6%, 51,739 particles); class 2, yellow (38.8%, 59,747 particles); class 3, cyan (27.6%, 42,500 particles).
Extended Data Figure 4.
Extended Data Figure 4.. Cryo-EM reconstruction of ΔN72,C13 SERT/15B8 Fab/ibogaine complex in NaCl.
a, Work-flow of cryo-EM data processing of the ΔN72,C13 SERT/15B8 Fab complex with ibogaine in occluded conformation. After particle picking, particles were sorted using 2D classification. Ab-initio was performed in cryoSPARC after 2D classification to obtain an initial reconstruction. Particles were used for further processing and global alignment in cryoSPARC followed by recentering in Relion and calculation of the local CTF using GCTF. cisTEM local refinement improved the resolution upon masking of the Fab constant domain and micelle (mask is shown overlaid in blue on top of the reconstruction). The final reconstructed volume was sharpened using cisTEM. b, Representative cryo-EM micrograph. Individual single particles are circled in white. Bar equals 50 nm. c, 2D class averages after three rounds of classification. d, The angular distribution of particles used in the final reconstruction. e, Cryo-EM density map colored by local resolution estimation. f, FSC curves for cross-validation, the final map (blue), masked SERT-15B8 Fab complex (red), and a mask which isolated SERT (black). The high-resolution limit cutoff for refinement was 7.0 Å. g, model vs. half map 1 (working, red), half map 2 (free, black), model vs. final map (blue). h, Cryo-EM density segments of TM1 - TM12. i, A spherical mask placed over SERT was used for focused 3D classification with 3 classes. Comparison of the classes did not reveal any substantial differences. The Fab was removed for clarity. The number of particles belonging to each class average are: class 1, purple (78.9%, 571,547 particles); class 2, yellow (6.9%, 49,983 particles); class 3, cyan (14.2%, 102,863 particles).
Extended Data Figure 5.
Extended Data Figure 5.. Cryo-EM reconstruction of ΔN72,C13 SERT/15B8 Fab/ibogaine complex in KCl.
a, Work-flow of cryo-EM data processing of the ΔN72,C13 SERT/15B8 Fab complex with ibogaine in KCl in the inward-open conformation. After particle picking, particles were sorted using 2D classification. Ab-initio was performed in cryoSPARC after 2D classification to obtain an initial reconstruction. Particles were further sorted in Relion using 3D classification and refined further in cryoSPARC. cisTEM local refinement improved the resolution upon masking of the Fab constant domain and micelle (mask is shown overlaid in blue on top of the reconstruction). The final reconstructed volume was sharpened using cisTEM. b, Representative cryo-EM micrograph. Individual single particles are circled in white. Bar equals 50 nm. c, 2D class averages after three rounds of classification. d, The angular distribution of particles used in the final reconstruction. e, Cryo-EM density map colored by local resolution estimation. f, FSC curves for cross-validation, the final map (blue), masked SERT-Fab complex (red), and a mask which isolated SERT (black). The high-resolution limit cutoff for refinement was 7.5 Å. g, model vs. half map 1 (working, red), half map 2 (free, black), model vs. final map (blue). h, Cryo-EM density segments of TM1 - TM12. i, A spherical mask placed over SERT was used for focused 3D classification with 3 classes. Comparison of the classes did not reveal any substantial differences. The Fab was removed for clarity. The number of particles belonging to each class average are: class 1, purple (32.9%, 121,288 particles); class 2, yellow (33.7%, 124,237 particles); class 3, cyan (33.4%, 123,131 particles).
Extended Data Figure 6.
Extended Data Figure 6.. Cholesteryl hemisuccinate, map features at Thr276 and Ser277, and SERT-noribogaine complex.
a, Interaction between CHS, TM1a and TM5 in the occluded conformation of the ΔN72,C13 SERT/15B8/ibogaine complex in 100 mM NaCl. b, Non-proteinaceous density features (red) near Thr276 and Ser277. c, Noribogaine inhibition of 5-HT transport for ΔN72,C13 SERT. 5-HT transport was measured using 20 μM [3H]5-HT in presence of the indicated concentrations of noribogaine. The mean IC50 of noribogaine inhibition of serotonin transport was determined from the curve with the error of the fit (s.e.m.): 1.2 ± 0.2 µM. Symbols show the mean derived from n=3 biological replicates. Error bars show the s.e.m. Experiment was performed twice independently with the same results. d, Michaelis–Menten plots of 5-HT uptake for the ΔN72,C13 transporter in the absence (circles), or in presence (dash, squares) of 1 µM noribogaine, the mean Km was determined from the curve with the error of the fit (s.e.m.): ΔN72,C13: 2.7 ± 0.6 µM; in presence of noribogiane: 2.7 ± 0.9 µM. Symbols show the mean derived from n=3 biological replicates. Error bars show the s.e.m. e, Noribogaine (circles) and ibogaine (dash, squares) competition binding with [3H]paroxetine for ΔN72,C13 SERT, Symbols show the mean derived from n=3 technical replicates. Error bars show the s.e.m. f, Density map of the ΔN72,C13 SERT/15B8/noribogaine complex, in 100 mM KCl, fit with the model derived from the inward-open ibogaine-bound SERT complex. SERT is cyan and the 15B8 Fab is purple; TM1 and TM6 of SERT are shown in orange and red, respectively. g, Noribogaine density in the central binding pocket. The fit of noribogaine into the EM density map was derived from ibogaine bound SERT in the inward-open conformation and shown in blue mesh, and residues involved in binding (Tyr176, Asp98, Phe341, Phe335, Asn177, Ile172 and Tyr95) are drawn as sticks. h, FSC curve for noribogaine bound SERT complex. The high-resolution limit cutoff for refinement was 9.0 Å.
Extended Data Figure 7.
Extended Data Figure 7.. Ibogaine docking and molecular dynamics simulations.
a, Workflow of ligand docking. b, Optimal binding poses of ibogaine in the central binding site of the outward-open, occluded, and inward-open conformations. For clarity, only TM helices surrounding the central binding site, i.e., TM1, TM3, TM6, and TM8, are shown. The interaction between ibogaine and Asp98 of SERT, both shown in sticks, is highlighted. c, Simulation system used to study the structural stability and ibogaine binding of different conformations of SERT (two independent 50 ns simulations for each conformation), showing the transporter in cartoon, with 1-palmitoyl-2-oleoyl-sn-glycero-3-phosphocholine lipids drawn in sticks, bulk water in a transparent surface, and solute ions (100 mM NaCl for the outward-open simulation) in yellow (Na+) and green (Cl) spheres. d, Structural stability of bound ibogaine measured as the mass-weighted root-mean-square deviation (RMSD, including hydrogen atoms) of the ligand, as well as the Asp98-ibogaine (O-N) distance. The trajectories of outward-open, occluded, and inward-open SERT are plotted in red, green, and blue respectively, and shown for two independent simulations.
Extended Data Figure 8.
Extended Data Figure 8.. Measurement of ibogaine and noribogaine inhibition of mutants, effect of thermostabilizing Tyr110Ala mutation, movements of structural elements associated with alternating access mechanism, and alignment of TM5.
a, Inhibition of serotonin uptake by ibogaine or noribogaine for ts2. The mean IC50 of ibogaine and noribogaine inhibition of serotonin transport was determined from the curve with the error of the fit (s.e.m.) (black circles, ibogaine IC50, 7 ± 2 µM; noribogaine IC50, 1.1 ± 0.7 µM), Asn177Leu (blue circles, 1 ± 1 µM; 40 ± 10 µM), Asn177Val (green triangles, 0.17 ± 0.04 µM; 24 ± 5 µM), Asn177Ala (red squares, 0.6 ± 0.3 µM; 300 ± 200 µM), Asn177Thr (cyan diamonds, 1.0 ± 0.2 µM; 8 ± 2 µM), and Asn177Gln (magenta inverted triangles, 1.1 ± 0.7 µM; 1.0 ± 0.5 µM). Symbols show the mean derived from n=6 and n=3 biological replicates for ibogaine and noribogaine respectively. Error bars show the s.e.m. Experiment was performed three times independently with the same results. b, Comparison of EL4 and TM1b between the x-ray ts3 paroxetine (PDB code: 5I6X, purple) structure and the ts2 active ibogaine outward-open cryo-EM structure (grey). Residues Tyr110 (ts2-active) and Ala110 (ts3) are shown in sticks. c, Comparison of the TM helices of the outward-open (grey), occluded (orange), and inward-open (blue) conformations viewed from the extracellular side of the membrane. The positions of TM2, 4, 5, and 12 for each conformation are shown (middle panel). The right panel shows the helical displacement measured from marker positions in each TM to a position in TM3 (Tyr186). Outward-open to occluded conformation (filled circles) and from the occluded to the inward-open conformation (open circles). The TM marker positions are described further in the ‘Methods’ section. Error bars represent the standard deviation, see Measurement section in Methods for further details. d, Comparison of the TM helices viewed from the intracellular side of the membrane. The positions of TM5, 9, 11, and 12 for each conformation are shown (middle panel). The right panel shows the helical displacement measured from marker positions in each TM to a position in TM3 (Gly160). Outward-open to occluded conformation (filled circles) and from the occluded to the inward-open conformation (open circles). Error bars represent the standard deviation. e, Angular changes of TMs associated with transition from the outward-open to the occluded conformation (filled circles) and from the occluded to the inward-open conformation (open circles). Error bars represent the standard deviation. f, The intracellular region of TM5 ‘unwinds’ in the inward-open conformation. Gly278 and Pro288 in the GX9P motif are shown in sticks. g, Alignment of TM5 of SERT, DAT, and NET with LeuT and MhsT. The position of the GX9P motif is indicated. h, Comparison of the extracellular loops 3, 4, and 6 in the outward-open (grey), the occluded (orange), and the inward-open (blue) conformations.
Extended Data Figure 9.
Extended Data Figure 9.. Comparison of SERT to bacterial transporters.
a, Superposition of the ibogaine-bound outward-open conformation (light-grey) with the LeuT outward-open conformation (PDB code: 3F3A, dark grey). The graphs depict the RMSD and angular differences between the outward-open conformations of SERT and LeuT (3F3A, open triangles), LeuT outward-occluded (PDB code: 2A65, open squares), and LeuT inward-open (PDB code: 3TT3, closed circles). b, Superposition of the ibogaine-bound occluded conformation (orange) with LeuT outward-occluded (PDB code: 2A65, dark grey). The graphs compare the occluded conformation of SERT with LeuT conformations as described in a. c, Superposition of the ibogaine-bound inward-open conformation (blue) with LeuT inward-open (PDB code: 3TT3, dark grey). The graphs compare the occluded conformation of SERT to LeuT conformations as described in a. d, Comparison of the extracellular loops of LeuT between outward-open (grey), occluded (orange), and inward-open (blue) conformations. e, Comparison of outward-open (light-grey), occluded (orange), and inward-open (blue) with the inward-occluded conformation of MhsT (PDB code: 4US3, dark grey). The graphs compare each conformation of SERT with MhsT as described in a.
Extended Data Figure 10.
Extended Data Figure 10.. Sodium and chloride ion-binding sites and putative substrate and ion release pathways.
a, Comparison of the Na1 site (green boxes) and the Na2 site (purple boxes), and the Cl site (olive boxes) with the outward-open S-citalopram and paroxetine x-ray structures of SERT (PDB codes: 5I71 and 5I6X, grey). Left panel, outward-open ibogaine conformation; middle panel, occluded conformation; right panel, inward-open conformation. The position of sodium ions found in the x-ray structure are shown in grey. b, Solvent accessible pathways in the inward-open conformation. Pathway 1 leads from the Na2 site to an opening formed between TM1a and TM5. Pathway 2 leads from the central binding site to an opening between TM1a, TM6b, and TM5. c, The minimum radius was plotted as a function of the profile
Figure 1.
Figure 1.. Ibogaine binding, uptake and labeling experiments.
a, Ibogaine and serotonin with the methoxy group and bicyclic cage highlighted by red and green dashed ovals, respectively. Demethylation of the methoxy group of ibogaine produces noribogaine. b, Plots of [14C]5-HT uptake for ts2-active SERT in the absence (blue, squares) or presence (red, open squares) of 1 μM 15B8 and 8B6. [14C]5-HT uptake for ΔN72,C13 SERT (orange, circles) and in the presence of 1μM 15B8 (green, open circles). Symbols show the mean derived from n=3 biological replicates. Error bars show the s.e.m. Experiment was performed three times independently with the same results. c, Left panel, plot of a [3H]ibogaine saturation binding to ts2-active SERT (blue, squares) and in the presence of 15B8 (green, circles) in 100 mM NaCl. Symbols show the mean derived from n=3 technical replicates. Error bars show the s.e.m. Experiment was performed four times independently with the same results. Right panel, graph of [3H]ibogaine saturation binding to ts2-active SERT in 100 mM KCl (blue, squares), 100 mM NMDG-Cl (orange, triangles) and in presence of 15B8 in 100 mM KCl (green, circles), symbols show the mean derived from n=6 biological replicates. Error bars show the s.e.m. Experiment was performed four times independently with the same results. d, Ser277Cys was labeled for 10 min with 10 μM MTS-ACMA in the presence of 100 mM KCl or 100 mM NaCl. The bars show the means and points show the value for each technical replicate. Error bars show the s.e.m. *P < 0.05, One-sided student’s t-test.
Figure 2.
Figure 2.. Cryo-EM reconstructions of outward-open, occluded and inward-open conformations.
a, Outward-open maps of ts2-active SERT (4.1 Å resolution, contour level ~6.2) bound to 15B8 Fab/8B6 scFv. b, Occluded conformation of ΔN72,C13 SERT bound to 15B8 Fab, in 100 mM NaCl (4.2 Å resolution, contour level ~2.7). c, Inward-open conformation of the ΔN72,C13 SERT-15B8 complex, in the presence of 100 mM KCl (3.6 Å resolution, contour level ~6.7). SERT, 15B8 Fab and 8B6 scFv are in cyan, purple and green respectively; TM1 is orange and TM6 is red and a CHS molecule is in grey. Movements of TM6a and TM1a from outward-open (dotted lines) to occluded and inward-open conformations (filled lines) are indicated.
Figure 3.
Figure 3.. Ibogaine binding site and conformational changes upon isomerization from the outward-open to the occluded and inward-open states.
Poses of ibogaine (green) from molecular dynamics studies in the a, outward-open, b, occluded, and c, inward-open conformations. d, Comparison of ibogaine binding poses in outward-open (grey), occluded (orange) and inward-open (blue) conformations. e, The −logIC50 of each mutant for inhibition of uptake for ibogaine (blue) or noribogaine (red) is shown. The mean −logIC50 was determined using the curves in Extended Data Fig. 8a with the error of the fit (s.e.m.) shown. *P < 0.05; **P < 0.01, One-sided student’s t-test. f, [3H]-ibogaine saturation binding experiments of Asn177 mutants in 100 mM KCl, and the corresponding mean Kd values determined using the curves with the error of fit (s.e.m.): Asn177Val (blue circles, 70 ± 20 nM), Asn177Ala (red squares, 130 ± 40 nM), Asn177Thr (green triangles, 200 ± 20 nM), and Asn177Gln (olive inverted triangles, 140 ± 50 nM); binding of [3H]-ibogaine to ts2-active (dotted line) from Figure 1c is shown for comparison. Symbols show the mean derived from n=6 biological replicates. Error bars show the s.e.m. Experiment was performed five times independently with the same results. g, ‘Slab’ views of the extracellular and intracellular cavities in the outward-open (left panel), occluded (middle panel) and inward-open conformations (right panel). TM1 and TM6 are shown as cartoon representations and are orange and red, respectively. Residues defining the extracellular and intracellular gate are in sticks. The distance between extracellular (F335 and Y176) and intracellular gating residues (Y350 and W82) is shown. h, Comparison of the occluded and outward-open (grey) conformations. i, Superposition of inward-open and occluded (grey) conformations.
Figure 4.
Figure 4.. Mechanisms of transport and ibogaine action.
Cartoon depicts conformational differences among outward-open, occluded and inward-open conformations. Ibogaine inhibits SERT either by binding to the outward-open followed by stabilization of the occluded or inward-open conformations or by directly binding to the inward-open conformation. The scaffold domain and associated TMs (grey) and TM2, 7, 8, 10, and 12 are shown in light blue. TM1, TM5 and TM6 are highlighted with orange, red and green. TM 4 and 9 are omitted for clarity. Sodium and chloride are shown as red and green spheres.

Similar articles

Cited by

References

    1. Singh SK & Pal A Biophysical approaches to the study of LeuT, a prokaryotic homolog of neurotransmitter sodium symporters. Methods Enzymol 557, 167–198, (2015). - PMC - PubMed
    1. Kristensen AS et al. SLC6 neurotransmitter transporters: structure, function, and regulation. Pharmacol Rev 63, 585–640, (2011). - PubMed
    1. Gether U, Andersen PH, Larsson OM & Schousboe A Neurotransmitter transporters: molecular function of important drug targets. Trends Pharmacol Sci 27, 375–383, (2006). - PubMed
    1. Cipriani A et al. Comparative efficacy and acceptability of 21 antidepressant drugs for the acute treatment of adults with major depressive disorder: a systematic review and network meta-analysis. Lancet 391, 1357–1366, (2018). - PMC - PubMed
    1. Lin Z & Madras BK Human genetics and pharmacology of neurotransmitter transporters. Handb Exp Pharmacol, 327–371, (2006). - PubMed

Publication types

MeSH terms