. 2019 May;569(7755):289-292.
doi: 10.1038/s41586-019-1144-0. Epub 2019 Apr 24.

XFEL structures of the human MT2 melatonin receptor reveal the basis of subtype selectivity

Affiliations

XFEL structures of the human MT2 melatonin receptor reveal the basis of subtype selectivity

Linda C Johansson et al. Nature. 2019 May.

Abstract

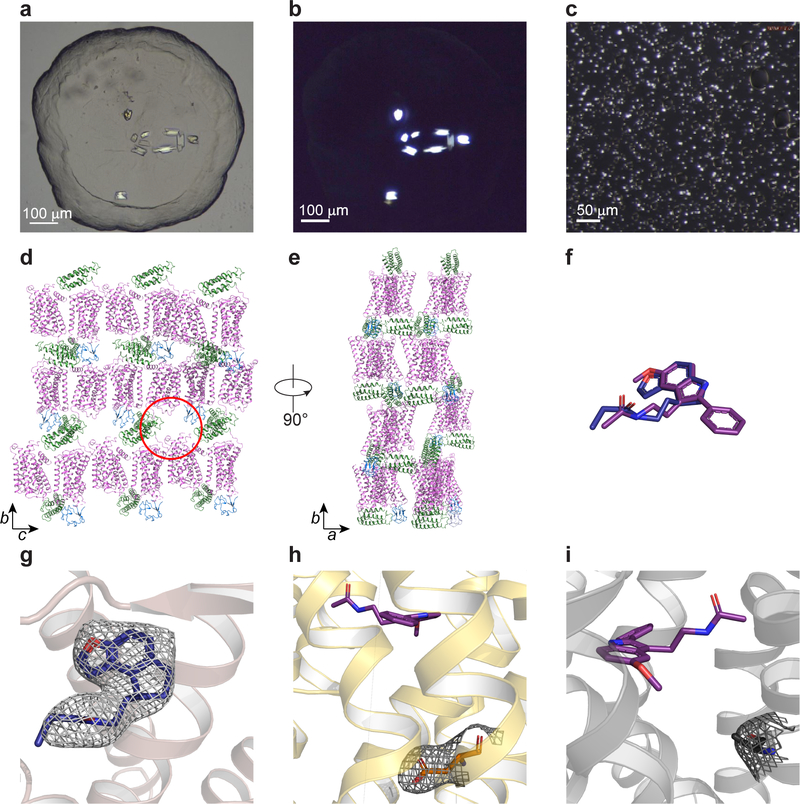
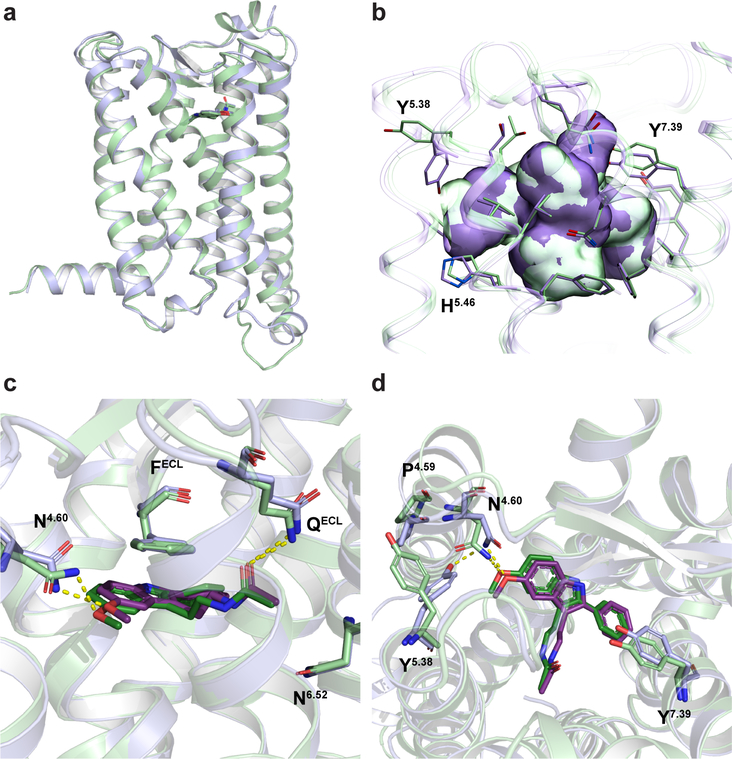
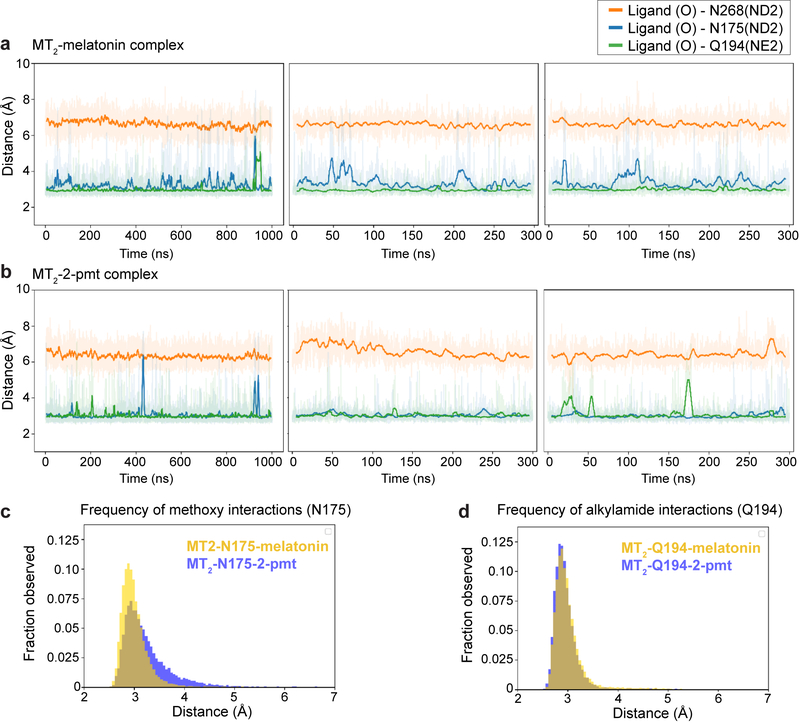
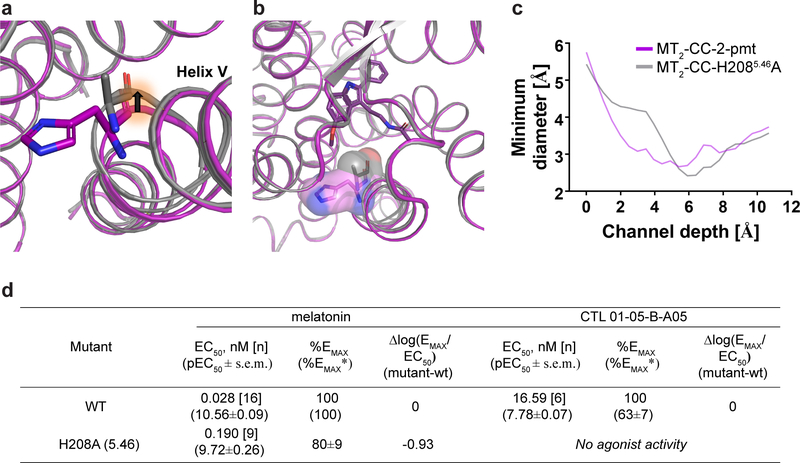
The human MT1 and MT2 melatonin receptors1,2 are G-protein-coupled receptors (GPCRs) that help to regulate circadian rhythm and sleep patterns3. Drug development efforts have targeted both receptors for the treatment of insomnia, circadian rhythm and mood disorders, and cancer3, and MT2 has also been implicated in type 2 diabetes4,5. Here we report X-ray free electron laser (XFEL) structures of the human MT2 receptor in complex with the agonists 2-phenylmelatonin (2-PMT) and ramelteon6 at resolutions of 2.8 Å and 3.3 Å, respectively, along with two structures of function-related mutants: H2085.46A (superscripts represent the Ballesteros-Weinstein residue numbering nomenclature7) and N862.50D, obtained in complex with 2-PMT. Comparison of the structures of MT2 with a published structure8 of MT1 reveals that, despite conservation of the orthosteric ligand-binding site residues, there are notable conformational variations as well as differences in [3H]melatonin dissociation kinetics that provide insights into the selectivity between melatonin receptor subtypes. A membrane-buried lateral ligand entry channel is observed in both MT1 and MT2, but in addition the MT2 structures reveal a narrow opening towards the solvent in the extracellular part of the receptor. We provide functional and kinetic data that support a prominent role for intramembrane ligand entry in both receptors, and suggest that there might also be an extracellular entry path in MT2. Our findings contribute to a molecular understanding of melatonin receptor subtype selectivity and ligand access modes, which are essential for the design of highly selective melatonin tool compounds and therapeutic agents.


Conflict of interest statement

The authors declare no competing interests.

Figures

Extended Data Fig. 1 |
Extended Data Fig. 1 |. Crystallisation of MT2: crystals, crystal packing, and electron density.
a, Bright field and b, cross-polarised images of representative MT2-2-pmt crystals optimized for synchrotron data collection (representing three independent crystallisation setups). c, cross-polarised image of representative MT2-N86D-2-pmt crystals used for XFEL data collection (representing three independent crystallisation setups). See Extended Data Table 2 for data collection statistics. d, e, Crystal packing (receptor - purple, BRIL – green, and rubredoxin - blue). Space for missing rubredoxin in molecule B of the asymmetric unit is indicated with a red circle. Lattice rotated 90° is shown in e. f, Overlay of 2-pmt (purple) and ramelteon (blue) ligands of MT2. g-e, 2mFo-DFc density (grey) contoured at 1 σ of ramelteon (g), N862.50D mutation (h), and H2085.46A mutation (i). 2-pmt is shown in purple.
Extended Data Fig. 2 |
Extended Data Fig. 2 |. Structural differences between MT1 and MT2.
a, Overlay between MT1-2-pmt (green) and MT2-2-pmt (violet) structures (Cα r.m.s.d = 0.6 Å). b, Comparison of MT1 (green) and MT2 (violet) binding pockets. Overall, the binding pocket is about 50 Å3 larger for MT2. c, Comparison of 2-pmt ligand conformations in MT1 (green) and MT2 (violet). Hydrogen bonds are shown as yellow dashed lines. d, Overlay of MT1 and MT2, showing residues that display different conformations in the vicinity of the binding pocket. N4.60 makes a hydrogen bond with Y5.38 in MT2 but not in MT1.
Extended Data Fig. 3 |
Extended Data Fig. 3 |. Molecular dynamics simulations.
a, b, Distance plots for interactions between residues in MT2 (N1754.60, atom type ND2 (Nδ); Q194ECL2, atom NE2 (Nε); N2686.52, atom ND2), and closest oxygen atoms of the ligand methoxy and acetyl groups, respectively, in complexes with melatonin (a) and 2-pmt (b) from three independent simulations runs. c, Distance histograms for interactions of methoxy with N1754.60 with melatonin (yellow) and 2-pmt (violet). d, Distance histograms for interactions of methoxy with and Q194ECL2 with ligand alkylamide tail with melatonin (yellow) and 2-pmt (violet).
Extended Data Fig. 4 |
Extended Data Fig. 4 |. Structural and functional differences between MT2-pmt and MT2-H208A5.46-2-pmt.
a, Overlay of the MT2-2-pmt (purple) structure with MT2-H2085.46A-2-pmt (grey) reveals an inward shift of helix V of ~0.9 Å due to the H2085.46A mutation (as shown by black arrow). b, Surface representation of the H2085.46 and H2085.46A residues. Rotation of helix V renders the binding pocket volume ~50 Å3 smaller for the H2085.46A structure (binding site volume for MT2-2-pmt: 766 Å3 compared to 716 Å3 for the MT2-H2085.46A structure). c, Comparison of the channel profiles (from the outside of the protein towards the ligand) for MT2-2-pmt (purple) and MT2-H2085.46A-2-pmt (grey) reveals a narrowing of the MT2-H2085.46A-2-pmt channel around 6 Å as a consequence of the mutation and subsequent inward rotation of helix V. d, Functional data for WT and the H2085.46A mutant expressed in HEK293T cells by using GloSensor to measure Gi/o-mediated cAMP inhibition. Data represent mean ± s.e.m. for n independent experiments as indicated in square brackets. %EMAX is relative to wild-type receptor (in columns), and (%EMAX*) is relative to melatonin activity (in rows). See Methods for further information and Supplementary Figure 6 for dose response curves.
Extended Data Fig. 5 |
Extended Data Fig. 5 |. Selectivity analysis of melatonergic compounds.
a, Binding affinities of ligands for MT1 (ChEMBL target identifier CHEMBL1945) and MT2 (CHEMBL1946) were retrieved from the ChEMBL database (v. 24) of experimental literature values. Of these ligands, 525 have affinities reported for both receptor subtypes. For ligands with multiple reported affinity values for a given receptor, pKi values were averaged. MT1-selective ligands are in the lower right quadrant; MT2-selective ligands are in the upper left quadrant. Data points are coloured by absolute pKi difference between subtypes, i.e. selectivity. b, Histogram of observed ligand selectivities. MT2 selective ligands are on the left of the panel, MT1 selective ligands are on the right. c, Plot of the docking score difference of select ligands that were docked between MT2 and MT1 versus their pKi difference (MT2-MT1). Dashed lines indicate pKi selectivity cutoff criteria (MT1: 1 and MT2: −4). Data points are colored by molecular weight (Da). See Supplementary Table 1 for details of docked ligands.
Fig. 1 |
Fig. 1 |. Overview of the MT2 structure.
a, Overview of MT2 (violet) shows the canonical 7TM topology, with the ligand 2-pmt (purple) in the binding pocket. A 90° view shows the receptor from the extracellular side. Approximate membrane boundaries are shown as grey lines. b, 2mFo-DFc density (grey mesh) of 2-pmt contoured at 1 σ. c, Binding pocket with key ligand interaction residues. d, Schematic diagram of ligand-interacting residues. Residues in the hydrophobic sub-pocket are coloured green. Hydrogen bonds are shown as dashed yellow lines in c and d.
Fig. 2 |
Fig. 2 |. Two possible ligand entries in MT2.
a, View of the membrane-buried channel in MT2. Insert shows the channel diameter profile across its length for MT1 and MT2. b, A 90° view of the channel in MT2, highlighting three residues discussed in the text. c, The same as in b view of MT1 (green) showing a different conformation of Y1875.38 that widens the channel compared to MT2. d, View of the ECL opening found in MT2 (violet) with 2-pmt (purple). Insert shows the ECL opening profile across the length. e, A 90° view through the ECL opening in MT2, highlighting three residues discussed in the text. f, The same as in e view of MT1 (green), showing a different conformation of Y2817.39 that seals the ECL opening. g, [3H]-melatonin dissociation kinetics for MT2 membrane channel mutants (top) and ECL opening mutants (bottom). h, same as in g for MT1. Residence time (1/koff) in g and h is given in minutes. Data are shown as mean±s.e.m. for n=3 independent experiments.
Fig. 3 |
Fig. 3 |. Selectivity determinants of ligands at MT1 and MT2.
a, Docking of selective ligands into MT1 (green), with 2-pmt (purple) from the crystal structure shown as reference. Ligands selective for MT1 (compounds 63, 64, 65a, and 65b) are shown in grey. Two representative ligands, 5-HEAT and CTL 01–05-B-A058 are coloured pale yellow, with their selectivity-conferring substituents (R1 position) shown in orange. b, Docking of ligands into MT2 (violet), with 2-pmt (purple) shown as reference. Non-selective (tasimelteon, TIK30122) and selective (UCM1014, K185, and 4P-PDOT) ligands are shown in grey. Two representative ligands, DH9717 and IIK717 are coloured pale yellow, with selectivity-conferring substituents (R2 and R3 positions) shown in cyan. Predicted hydrogen bonds are shown as dotted lines in a and b. c, Melatonin SAR, where R1 substituents confer MT1 selectivity (orange), and substituents in R2 and R3 positions confer MT2 selectivity (cyan). See Supplementary Table 1 for a list of all docked ligands.
Fig. 4 |
Fig. 4 |. MT2 mutations implicated in type 2 diabetes.
Mapping of residues implicated in T2D as described in Refs., on the MT2 crystal structure. Residues, mutations of which lead to defects in two or more pathways, are coloured gold, G protein-specific defects - cyan, β-arrestin 2-specific - blue, ERK-specific – magenta, mutations abolishing melatonin-binding are shown in green, and those similar to WT shown in grey. T2D mutations in residues, not observed in the crystal structure, are not shown.

Similar articles

Cited by

References

    1. Ebisawa T, Karne S, Lerner MR & Reppert SM Expression cloning of a high-affinity melatonin receptor from Xenopus dermal melanophores. Proc Natl Acad Sci USA 91, 6133–6137 (1994). - PMC - PubMed
    1. Reppert SM et al. Molecular characterization of a second melatonin receptor expressed in human retina and brain: the Mel1b melatonin receptor. Proc Natl Acad Sci USA 92, 8734–8738 (1995). - PMC - PubMed
    1. Liu J et al. MT1 and MT2 Melatonin Receptors: A Therapeutic Perspective. Annu Rev Pharmacol Toxicol 56, 361–383 (2016). - PMC - PubMed
    1. Bonnefond A et al. Rare MTNR1B variants impairing melatonin receptor 1B function contribute to type 2 diabetes. Nat Genet 44, 297–301 (2012). - PMC - PubMed
    1. Karamitri A et al. Type 2 diabetes-associated variants of the MT2 melatonin receptor affect distinct modes of signaling. Sci Signal 11, eaan6622 (2018). - PubMed

Publication types

MeSH terms