. 2019 May;569(7755):284-288.
doi: 10.1038/s41586-019-1141-3. Epub 2019 Apr 24.

Structural basis of ligand recognition at the human MT1 melatonin receptor

Affiliations

Structural basis of ligand recognition at the human MT1 melatonin receptor

Benjamin Stauch et al. Nature. 2019 May.

Erratum in

Abstract

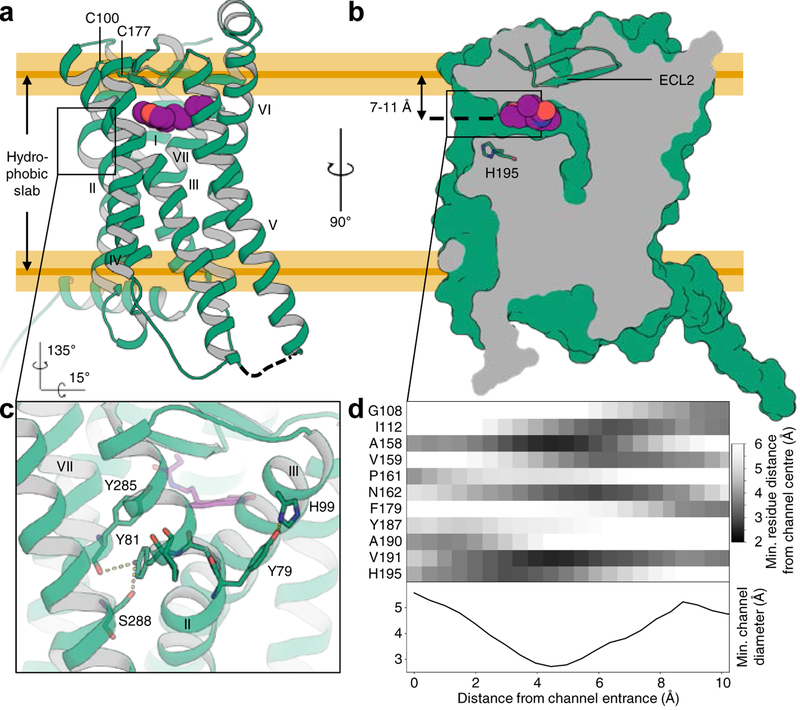
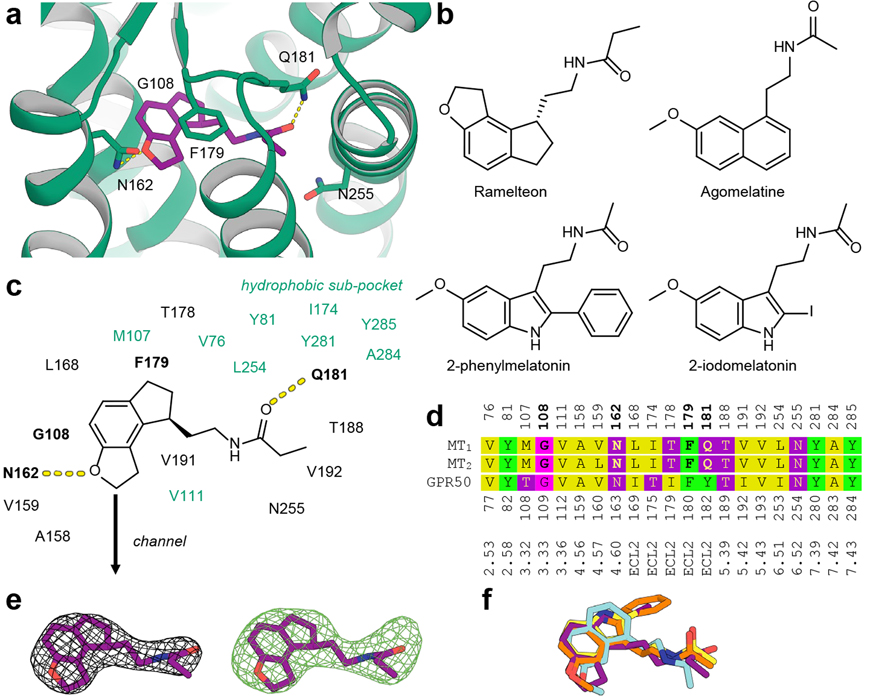
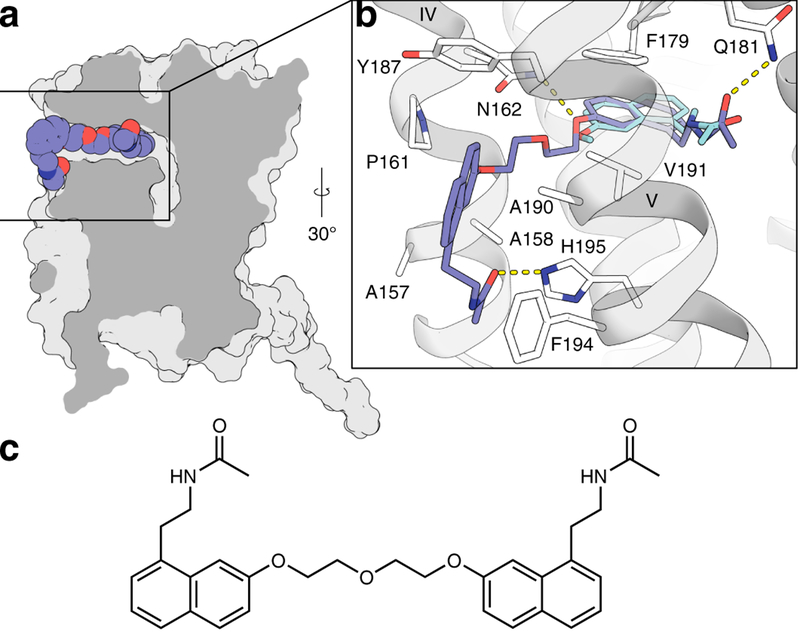
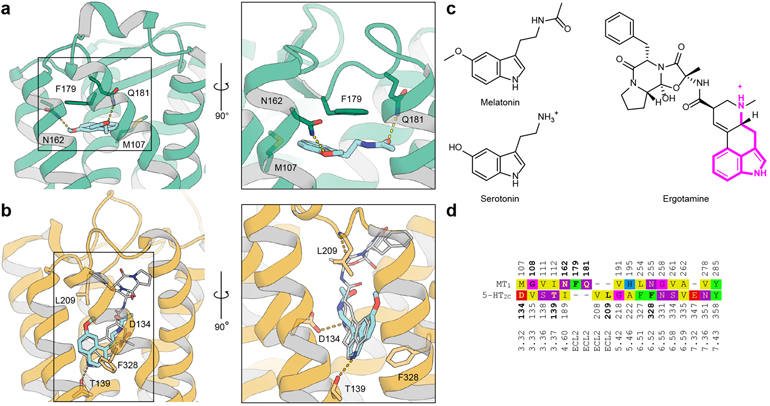
Melatonin (N-acetyl-5-methoxytryptamine) is a neurohormone that maintains circadian rhythms1 by synchronization to environmental cues and is involved in diverse physiological processes2 such as the regulation of blood pressure and core body temperature, oncogenesis, and immune function3. Melatonin is formed in the pineal gland in a light-regulated manner4 by enzymatic conversion from 5-hydroxytryptamine (5-HT or serotonin), and modulates sleep and wakefulness5 by activating two high-affinity G-protein-coupled receptors, type 1A (MT1) and type 1B (MT2)3,6. Shift work, travel, and ubiquitous artificial lighting can disrupt natural circadian rhythms; as a result, sleep disorders affect a substantial population in modern society and pose a considerable economic burden7. Over-the-counter melatonin is widely used to alleviate jet lag and as a safer alternative to benzodiazepines and other sleeping aids8,9, and is one of the most popular supplements in the United States10. Here, we present high-resolution room-temperature X-ray free electron laser (XFEL) structures of MT1 in complex with four agonists: the insomnia drug ramelteon11, two melatonin analogues, and the mixed melatonin-serotonin antidepressant agomelatine12,13. The structure of MT2 is described in an accompanying paper14. Although the MT1 and 5-HT receptors have similar endogenous ligands, and agomelatine acts on both receptors, the receptors differ markedly in the structure and composition of their ligand pockets; in MT1, access to the ligand pocket is tightly sealed from solvent by extracellular loop 2, leaving only a narrow channel between transmembrane helices IV and V that connects it to the lipid bilayer. The binding site is extremely compact, and ligands interact with MT1 mainly by strong aromatic stacking with Phe179 and auxiliary hydrogen bonds with Asn162 and Gln181. Our structures provide an unexpected example of atypical ligand entry for a non-lipid receptor, lay the molecular foundation of ligand recognition by melatonin receptors, and will facilitate the design of future tool compounds and therapeutic agents, while their comparison to 5-HT receptors yields insights into the evolution and polypharmacology of G-protein-coupled receptors.


Conflict of interest statement

The authors declare no competing interests.

Figures

Extended Data Fig. 1 |
Extended Data Fig. 1 |. Crystals, ligand electron density maps, and packing of MT1.
a, Bright field, and b, cross-polarised images of representative MT1-2-pmt crystals, optimised for synchrotron data collection (representing three independent crystallization setups). c, Cross-polarised image of representative MT1-ramelteon crystals used for XFEL data collection (representing two independent crystallization setups). d, 2mFoDFc ligand electron density maps of MT1 co-crystallised with 2-pmt (orange), 2-iodomelatonin (yellow), and agomelatine (cyan), contoured at 1.0 σ (grey mesh). e, 2mFoDFc (blue, contoured at 1.0 σ) and mFoDFc (green/red, +/−3.5 σ) electron density maps of MT1-ramelteon (ligand purple, protein yellow) illustrating the small, unassigned electron density close to N2556.52 that is tentatively attributed to the essential additive 2-propan-ol. The distance from this electron density to the closest ligand atom is approximately 4.8 Å. f, Packing of MT1-PGS crystallised in the P 4 21 2 space group. The receptor is shown in green and the PGS fusion protein is shown in purple. g, Simulated annealing mFoDFc omit maps (green mesh) of 2-pmt (orange sticks), 2-iodomelatonin (yellow), and agomelatine (cyan), contoured at 3.0 σ.
Extended Data Fig. 2 |
Extended Data Fig. 2 |. Molecular dynamics simulations.
a, b, Distance plots for interactions between residues in MT1 (N1624.60, atom type ND2 (Nδ); Q181ECL2, atom NE2 (Nε); N2556.52, atom ND2), and closest oxygen atoms of the methoxy and acetyl groups, respectively, in ligands melatonin (a) and 2-pmt (b) from three independent simulation runs. c, Distance histograms for interactions of methoxy with N162 (left), and Q181 with ligand acetyl tail (right), in melatonin and 2-pmt complexes. d, Hydration of residue N2556.52 over the course of a 1 μs simulation of the MT1-2-pmt complex from three independent simulations. e, Stability of ligand binding in simulations of MT1 complexes. Time dependence of RMSD for non-hydrogen atoms of melatonin shown for MT1-melatonin complex (left) and MT1-2-pmt complex (right). Three independent simulations of crystal construct (purple, blue, light blue) and crystal construct with N2556.52A mutation (orange, light orange, yellow) are shown, spanning 1.5 μs of cumulative time per system. Sampling rate was 10 frames per ns, and solid lines represent moving average values from 50 frames in all cases.
Fig. 1 |
Fig. 1 |. Structural features of MT1.
a, Overall architecture of MT1 (green; disulfide yellow, helices labeled with Roman numerals) bound to ramelteon (purple). ICL3 was replaced by a fusion protein and is shown as a dashed line. Approximate boundaries of the hydrophobic slab corresponding to the lipid tails are derived from MD simulation and indicated by orange lines (yellow shaded areas represent s.d.). ECL2 closes off the binding site to the extracellular space. b, Section through the receptor illustrating the lateral ligand access channel. c, Details of the unique YPYP motif in helix II that forms a bulge in proximity to the ligand. Residues are shown as green sticks, and hydrogen bonds as dashed lines. d, Proximity matrix of pore-lining residues, and minimum diameter profile across the length of the channel, calculated using spherical probes.
Fig. 2 |
Fig. 2 |. Ligand recognition at MT1.
a, Ramelteon (purple) forms specific interactions with side chains of N162 and Q181 of MT1 (green), and stacks with F179 (all side chains shown as green sticks). b, Chemical structures of melatonergic ligands that were co-crystallised with MT1 in this work. c, Binding site composition and interactions of ramelteon as a representative for all four complexes. The hydrophobic sub-pocket accommodating substituents at the 2 position of indole-like ligands is shown in green. d, Structure-guided sequence alignment of MT1 (residue numbering above), MT2, and GPR50 (residue numbering below) binding site residues. Ligand-interacting residues in MT1 and MT2 are highlighted in bold, and Ballesteros-Weinstein residue numbering is provided for reference. e, 2mFoDFc electron density map (grey mesh) in the binding site of the MT1-ramelteon complex, contoured at 1.0 σ, and simulated annealing mFoDFc omit map (green mesh), contoured at 3.0 σ. Electron density maps for other ligands are shown in Extended Data Fig. 1. f, Overlay of experimental ligand conformations of ramelteon (purple), 2-pmt (orange), 2-iodomelatonin (yellow), and agomelatine (cyan) after receptor superimposition. The conformations of receptor side chains in the binding site are very similar between the complexes and are omitted for clarity.
Fig. 3 |
Fig. 3 |. Docking model of bitopic ligand.
a, Section through MT1 (grey) showing the best docked pose of the bitopic ligand CTL 01–05-B-A05 (spheres with slate blue carbons). b, Details of receptor ligand interactions. Dashed lines represent hydrogen bonds between ligand moieties and receptor residues N1624.60, Q181ECL2, and H1955.46, respectively. c, Chemical structure of CTL 01–05-B-A05. The ligand protrudes from the lateral channel between helices IV and V. Its core shows minor displacement compared to the experimentally determined conformation of agomelatine (cyan sticks), and it forms favourable interactions with several residues (white sticks) in the periphery of the channel.
Fig. 4 |
Fig. 4 |. Comparison between MT1 and 5-HT2C.
a, Crystal structure of agomelatine (cyan sticks, pKi(MT1)=8.8) bound to MT1 (green cartoon). Important residues in the binding site are shown as sticks with green carbons. b, Crystal structure of ergotamine (grey sticks) bound to 5-HT2C (orange cartoon), and docking model of agomelatine (cyan sticks, pKi(5-HT2C)13=6.2). c, Chemical structures of melatonin, serotonin, and ergotamine with the substructure shared between serotonin and ergotamine highlighted (magenta). d, Structure-guided sequence alignment in the binding sites of MT1 and 5-HT2C receptors with reference sequence numbering (above / below), and Ballesteros-Weinstein numbering (bottom). Residues participating in tight ligand interactions in the respective structure are bold.

Similar articles

Cited by

References

    1. Pevet P Melatonin receptors as therapeutic targets in the suprachiasmatic nucleus. Expert Opin Ther Tar 20, 1209–1218 (2016). - PubMed
    1. Hardeland R, Pandi-Perumal SR & Cardinali DP Melatonin. Int J Biochem Cell Biol 38, 313–316 (2006). - PubMed
    1. Dubocovich ML & Markowska M Functional MT1 and MT2 melatonin receptors in mammals. Endocrine 27, 101–110 (2005). - PubMed
    1. Ganguly S, Coon SL & Klein DC Control of melatonin synthesis in the mammalian pineal gland: the critical role of serotonin acetylation. Cell Tissue Res 309, 127–137 (2002). - PubMed
    1. Tosini G, Owino S, Guillaume JL & Jockers R Understanding melatonin receptor pharmacology: latest insights from mouse models, and their relevance to human disease. Bioessays 36, 778–787 (2014). - PMC - PubMed

Publication types

MeSH terms