. 2019 May;569(7757):565-569.
doi: 10.1038/s41586-019-1140-4. Epub 2019 Apr 24.

SR-B1 drives endothelial cell LDL transcytosis via DOCK4 to promote atherosclerosis

Affiliations

SR-B1 drives endothelial cell LDL transcytosis via DOCK4 to promote atherosclerosis

Linzhang Huang et al. Nature. 2019 May.

Abstract

Atherosclerosis, which underlies life-threatening cardiovascular disorders such as myocardial infarction and stroke1, is initiated by passage of low-density lipoprotein (LDL) cholesterol into the artery wall and its engulfment by macrophages, which leads to foam cell formation and lesion development2,3. It is unclear how circulating LDL enters the artery wall to instigate atherosclerosis. Here we show in mice that scavenger receptor class B type 1 (SR-B1) in endothelial cells mediates the delivery of LDL into arteries and its accumulation by artery wall macrophages, thereby promoting atherosclerosis. LDL particles are colocalized with SR-B1 in endothelial cell intracellular vesicles in vivo, and transcytosis of LDL across endothelial monolayers requires its direct binding to SR-B1 and an eight-amino-acid cytoplasmic domain of the receptor that recruits the guanine nucleotide exchange factor dedicator of cytokinesis 4 (DOCK4)4. DOCK4 promotes internalization of SR-B1 and transport of LDL by coupling the binding of LDL to SR-B1 with activation of RAC1. The expression of SR-B1 and DOCK4 is increased in atherosclerosis-prone regions of the mouse aorta before lesion formation, and in human atherosclerotic arteries when compared with normal arteries. These findings challenge the long-held concept that atherogenesis involves passive movement of LDL across a compromised endothelial barrier. Interventions that inhibit the endothelial delivery of LDL into artery walls may represent a new therapeutic category in the battle against cardiovascular disease.


Conflict of interest statement

The authors have declared that no competing interests exist.

Figures

Extended Data Figure 1.
Extended Data Figure 1.. Establishment of mice lacking endothelial SR-B1 or PDZK1.
a,j, Schematics of the gene-targeting strategies to generate floxed alleles of Scarb1 (a) and PDZK1 (j) to create SR-B1fl/fl and PDZK1fl/fl mice. In SR-B1fl, exon 2 was floxed, and in PDZK1fl, exons 2 and 3 were floxed. The recombined alleles following Cre recombinase introduction are also shown. b,k, Using primers depicted in a and j, PCR-based genotyping was performed on aortas with versus without intact endothelial cells (EC). Aortas were obtained from floxed mice, and mice with Scarb1 or PDZK1 deleted selectively from EC (SR-B1ΔEC or PDZK1ΔEC). In genotyping evaluating Scarb1 excision (b), additional samples were obtained from SR-B1fl/fl mice expressing Cre recombinase globally (gCre). In genotyping evaluating PDZK1 excision (k), lung samples were also studied. c,l, Quantitative real-time PCR analysis of SR-B1 (c) or PDZK1 expression (l) in primary aortic EC (n=6) and bone marrow-derived myeloid lineage cells (n=5). d,e,f, SR-B1 protein abundance (d,e, n=4) and ALK1 transcript levels (f, n=4) were evaluated in aortic endothelial cells from SR-B1fl/fl and SR-B1ΔEC mice; summary data for SR-B1 protein are in e. The uncropped versions of all immunoblots shown are provided in Supplementary Figure 1. g,m, Immunoblotting of SR-B1 (g) or PDZK1 protein (m) abundance in liver. h,n, Plasma cholesterol levels. For SR-B1 studies, n=4,3,9 and 10 mice, respectively, for PDZK1 studies, n=4, 3, 6 and 6 mice, respectively. i,o, Representative lipoprotein profiles. Data are mean±SEM; in c, e, and I, P values by two-sided Student’s t test are shown, and in h and n, P values by ANOVA with Dunnett’s post hoc testing are shown.
Extended Data Figure 2.
Extended Data Figure 2.. Atherosclerosis is promoted by endothelial SR-B1 but not by endothelial PDZK1, and neither endothelial SR-B1 nor PDZK1 affect circulating lipids.
Findings are shown for SR-B1 in mixed background females (a-g) and in C57BL/6 males (h-n), and for PDZK1 in C57BL6 males (o-u). Representative in situ aortic arch images of atherosclerotic plaque (yellow arrows) are in a, h and o, representative images for lipid-stained lesions in en face aortas are in b, i and p, and representative images for lipid/hematoxylin-stained aortic root sections (lesions outlined by yellow dashed line, magnification 40X) are in d, k and r. Lesion area quantitation in en face aortas (percent total surface area) are in c (n=13 and 14, respectively), j (n=10 and 9, respectively) and q (n=14/group), and quantitation in aortic root sections are in e (n=9/group), l (n= 10 and 9, respectively) and s (n=10 and 11, respectively). Plasma total cholesterol (TC), triglyceride (TG), and HDL cholesterol (HDL-c) are in f (n=12/group for TC and TG, and 10/group for HDL-c), m (n=16 and 9, respectively for TC and TG, and n=10 and 9, respectively for HDL-c), and t (n=14/group for TC and TG, and 10/group for HDL-c); findings for SR-B1fl/fl, SR-B1ΔEC and PDZK1ΔEC are shown in blue, red and orange, respectively. Representative lipoprotein profiles are in g, n and u. Data are mean±SEM. In c, e, j and l, P values by two-sided Student’s t test are shown.
Extended Data Figure 3.
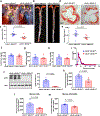
Extended Data Figure 3.. Endothelial SR-B1 promotes atherosclerosis in LDLR null mice by driving LDL entry into the artery wall.
a, Representative in situ aortic arch images of atherosclerotic plaque (yellow arrows) in male LDLR−/−;SR-B1fl/fl and LDLR−/−;SR-B1ΔEC mice. b, Representative lipid-stained en face images of aortas. c) Quantitation of lesion areas in en face aortas (percent of total surface area); n=10 and 8, respectively. d, Representative lipid/hematoxylin-stained aortic root sections (lesions outlined by yellow dashed line, magnification 40X). e, Quantitation of lesion areas in aortic root sections; n=10 and 8, respectively. f-h, Plasma total cholesterol (f), triglyceride (g), and HDL cholesterol (h), n=10 and 8, respectively. i, Representative lipoprotein profiles. j,k, Aorta dil-nLDL uptake. Human apolipoprotein B abundance (j) or Dil fluorescence intensity (k) was evaluated in aorta homogenates 4h following IV DiI-nLDL injection. Left panel in j displays a representative immunoblot with 3 samples per group, and in j and k, n= 5/group. l,m, Aorta dil-labeled mouse LDL (l) or mouse VLDL/IDL (m) uptake in LDLR−/−;SR-B1fl/fl and LDLR−/−;SR-B1ΔEC mice (n=4 and 5, respectively). Data are mean±SEM, P values by two-sided Student’s t test are shown.
Extended Data Figure 4.
Extended Data Figure 4.. Endothelial SR-B1 and hepatocyte SR-B1 have opposing impact on atherosclerosis.
Using AAV8-PCSK9, hypercholesterolemia was induced in male SR-B1fl/fl mice, and in SR-B1ΔEC or SR-B1ΔHEP mice lacking SR-B1 selectively in endothelial cells or hepatocytes, respectively. Findings in SR-B1fl/fl versus SR-B1ΔEC are in a-l, and findings in SR-B1fl/fl versus SR-B1ΔHEP are in m-v. a, Representative in situ aortic arch images of atherosclerotic plaque (yellow arrows) in SR-B1fl/fl and SR-B1ΔEC mice. b, Representative lipid-stained en face images of aortas. c) Quantitation of lesion areas in en face aortas (percent of total surface area); n=12 and 10, respectively. d, Representative lipid/hematoxylin-stained aortic root sections (lesions outlined by yellow dashed line, magnification 40X). e, Quantitation of lesion areas in aortic root sections; n=10 and 9, respectively. f-h, Plasma total cholesterol (f), triglyceride (g), and HDL cholesterol (h), n=12 and 11, respectively. i, Representative lipoprotein profiles. j,k, Aorta dil-nLDL uptake. Human apolipoprotein B abundance (j) or Dil fluorescence intensity (k) was evaluated in aorta homogenates 4h following IV injection (n=6 and 5, respectively). Left panel in j displays a representative immunoblot with 3 samples per group. l, LDLR abundance in livers of control mice and SR-B1fl/fl and SR-B1ΔEC mice administered AAV-PCSK9. Immunoblot depicts protein abundance for 2 samples per group. m, Survival curves for SR-B1fl/fl and SR-B1ΔHEP mice, n=5 and 4, respectively. n, Representative lipid-stained en face images of aortas. o, Quantitation of lesion areas in en face aortas. Aortas and plasma were only available from two SR-B1ΔHEP mice. p, Longitudinal sections of SR-B1fl/fl and SR-B1ΔHEP hearts stained with H&E or trichrome (healthy myocardium, red/brown; fibrotic tissue, blue; yellow asterisks and arrows indicate areas of severe fibrosis). Images shown mirror those obtained in all 3 hearts per group that underwent histological analysis. q. Coronary arteries of SR-B1fl/fl and SR-B1ΔHEP mice stained with H&E or trichrome, and coronary artery of SR-B1ΔHEP mouse stained with anti-CD68 to detect macrophages. r-t, Plasma total cholesterol (TC), triglyceride (TG), and HDL cholesterol (HCL-c). u, Representative lipoprotein profiles. v, Immunoblotting of SR-B1 abundance in liver, showing findings for 2 samples per group. Data are mean±SEM, P values by two-sided Student’s t test are shown.
Extended Data Figure 5.
Extended Data Figure 5.. Endothelial SR-B1 does not influence vascular inflammation.
a, Quantitative real-time PCR was performed to compare CD68 transcript levels in aortas from apoE−/−;SR-B1fl/fl and apoE−/−;SR-B1ΔEC male mice, n=8/group. b-i, mRNA abundance was also evaluated for the following genes, using HPRT1 as a housekeeping gene and normalizing expression to CD68 levels: E-selectin (b), P-selectin (c), VCAM-1 (d), ICAM-1 (e), TGFβ (f), TNFα (g), IL-6 (h), and IL-10 (i), with n=8/group. j, Representative still images of leukocyte-endothelial cell adhesion evaluated by intravital microscopy in the mesenteric microcirculation of apoE−/−;SR-B1fl/fl and apoE−/−;SR-B1ΔEC male mice administered vehicle (n=10 and 11, respectively) or TNFα (n=5 and 6, respectively). k, Summary data for leukocyte velocity in four study groups in j. l, Gating strategy for evaluation of CD45+, F4/80+ cell number and DiI-LDL uptake in the aorta. Following digestion of the aorta, all cells were first gated in FSC/SSC according to cell size and granularity. The resulting population was gated according to cell viability using DAPI. DAPI- live cells were gated for positivity for CD45, and CD45+ cells were then gated for positivity for F4/80 and the DiI label. Data are mean±SEM; in k, P values by ANOVA with Dunnett’s post-hoc test are shown.
Extended Data Figure 6.
Extended Data Figure 6.. Endothelial SR-B1 drives both nLDL and oxLDL delivery into the artery wall.
a, Three-dimensional depiction of Dil-oxLDL localization determined by confocal fluorescence microscopy of the luminal surface of the ascending aorta of apoE−/−;SR-B1fl/fl and apoE−/−;SR-B1ΔEC mice. Lumen is on the left. DiI is shown in red and Hoechst staining of nuclei is shown in blue. b, Representative cumulative images of the X-Y plane parallel to the luminal surface. c, Summation of dil-oxLDL signal in the superficial ascending aorta. Two areas encompassing at least 100 cells were counted per mouse in 3 mice per group for total n=6/genotype group. d,e, Aorta dil-oxLDL uptake. Human apolipoprotein B abundance (d) or Dil fluorescence intensity (e) was evaluated in aorta homogenates 4h following IV DiI-oxLDL injection; n=8/group. f,g, Using same approaches as in d and e, aorta dil-oxLDL uptake was evaluated in apoE−/− mice treated with control Ab or SR-B1 blocking antibody given IP prior to IV injection of diI-oxLDL (n=6 and 7, respectively). h, Quantification of CD45+, F4/80+ macrophages in the aorta (n=6/group). Results are expressed relative to abundance in apoE−/−;SR-B1fl/fl control mice. i, Dil-oxLDL distribution in CD45+, F4/80+ macrophages in the aorta, n=6/group. j,k, Aorta dil-nLDL uptake. Human apolipoprotein B abundance (j) or Dil fluorescence intensity (k) was evaluated in aorta homogenates 4h following IV DiI-nLDL injection; n=7 and 8, respectively. l,m, Using same approaches as in j and k, aorta dil-nLDL uptake was evaluated in apoE−/− mice treated with control Ab or SR-B1 blocking antibody given IP prior to IV injection of diI-nLDL (n=5/group). Left panel in d, f, j and l displays a representative immunoblot with 3 samples per group; Data are mean±SEM, P values by two-sided Student’s t test are shown. See also Videos 1,2.
Extended Data Figure 7.
Extended Data Figure 7.. Low-power electron micrograph images of LDL-gold and immunogold-labeled SR-B1 in aortic endothelial cells in vivo.
Following intravascular administration in wild-type mice, gold-labeled LDL particles and SR-B1 were localized in aortic endothelial cells by electron microscopy. a and b display images for two different endothelial cells, each bordered by the lumen and elastic lamina. Shown are the locations of the high-power fields provided in Figure 1n, with LDL-gold (large particles) highlighted by yellow arrows and immunogold-labeled SR-B1 (small particles) highlighted by red arrows.
Extended Data Figure 8.
Extended Data Figure 8.. SR-B1 governs endothelial cell LDL transcytosis independent of effects on caveolae function.
a, Dil-nLDL and diI-oxLDL uptake in endothelial cells after RNAi knockdown of SR-B1 or PDZK1. In left panel, diI-oxLDL visualization is shown in red, and DAPI-stained nuclei are in blue. N=6/group. b,c, Dil-nLDL and dil-oxLDL uptake (b) and transcytosis (c) in cells treated with control IgG or SR-B1 blocking antibody or BLT1. N=6/group. d, Dil-nLDL and diI-oxLDL transcytosis in endothelial cells after RNAi knockdown of SR-B1. N=3/group. e,f, NOS activation by VEGF (100ng/ml) or HDL (20ug/ml) with or without RNAi knockdown of SR-B1 (e, n=10/group) or caveolae disruption by methyl-β-cyclodextrin treatment (f, 10mM for 60min, n=8/group). g, Abundance of target protein following RNAi knockdown of SR-B1, PDZK1, LDLR or CD36 in HAEC. Findings for 3 samples per condition are shown. In all studies SR-B1, LDLR and CD36 expression were evaluated. h,i, DiI-nLDL and diI-oxLDL uptake in cells depleted of LDLR by RNAi (h, n=12 for nLDL and 13 for oxLDL) or treated with control versus LDLR blocking antibody (i, n=6/group). j, DiI-nLDL and diI-oxLDL transcytosis in cells treated with control versus LDLR blocking antibody. N=6 for nLDL and 3 for oxLDL. k,l, DiI-nLDL and diI-oxLDL uptake in cells depleted of CD36 by RNAi (k, n=6/group) or treated with control versus CD36 blocking antibody (l, n=9 and 12 for nLDL and 6 for oxLDL). m, DiI-nLDL and diI-oxLDL transcytosis in cells treated with control versus CD36 blocking antibody. N=6/group. Data are mean±SEM, P values by two-sided Student’s t test (a-c) or by ANOVA with Dunnett’s post-hoc test (d-f, h-I, k-l) are shown.
Extended Data Figure 9.
Extended Data Figure 9.. Roles of SR-B1, ALK1 and DOCK4 in endothelial cell LDL transcytosis.
a, Abundance of SR-B1, LDLR, and CD36 protein following RNAi knockdown of SR-B1, or following reconstitution of wild-type SR-B1 expression in cells depleted of endogenous receptor. Caveolin-1 (Cav1) expression was also evaluated. Findings for 2 samples per condition are shown. b, ALK1 transcript levels in cells manipulated as in a. N=4/group. c, Abundance of SR-B1, LDLR, and CD36 protein following RNAi knockdown of ALK1, SR-B1, or ALK1 and SR-B1. Findings for 2 samples per condition are shown. d, ALK1 transcript levels in cells manipulated as in c. N=4/group. e, SMAD1/5 phosphorylation in response to BMP9 (10ng/ml, for 0–120 min) following RNAi knockdown of SR-B1 or ALK1. Abundance of SMAD1/5 Ser463/465 phosphorylation and total SMAD1 were evaluated by immunoblotting. f, DiI-nLDL transcytosis following RNAi knockdown of ALK1, SR-B1, or ALK1 and SR-B1. N=9/group. g,h, nLDL uptake was evaluated using 125I-nLDL in the absence or presence of 50-fold excess unlabeled nLDL (g), and h, following RNAi knockdown of SR-B1 or DOCK4, or reconstitution of wild-type SR-B1 expression in cells depleted of endogenous receptor. N=8/group. i,j, nLDL transcytosis was evaluated using 125I-nLDL in the absence versus presence of 50-fold excess unlabeled nLDL (i), and j, following manipulation of SR-B1 or DOCK4 expression as in h. N=3/group. k,l, nLDL transcytosis was evaluated using total internal reflection fluorescence (TIRF) microscopy in cells treated with Dyngo4A (k, 30uM) and l, in cells following RNAi knockdown of SR-B1 or DOCK4. N=6/group. m, Rac1 activation in response to oxLDL was determined in cells expressing GFP control versus dominant-negative Rac1, and in untreated cells versus cells incubated with the Rac1 inhibitor NSC23766. Data are mean±SEM, P values by ANOVA with Dunnett’s posthoc test (d, f, h, j, l) or by two-sided Student’s t test (g, i, k) are shown.
Figure 10.
Figure 10.. Lentiviral reconstitution of wild-type and mutant SR-B1 expression in human endothelial cells.
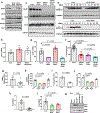
a-c, Studies of reconstituted wild-type SR-B1 (WT), extracellular point mutant SR-B1, or SR-B1-Q445A. The extracellular point mutants were: SR-B1-M159E, T165E, F171A, T175A, and E178A. Whole cell lysate abundance (a), cell surface abundance (b; except for Q445A, which was previously evaluated), and nLDL and oxLDL binding (c) were evaluated. d-f, Studies of reconstituted WT or C-terminal cytoplasmic tail deletion mutant SR-B1. The mutants were: SR-B1-ΔC15 (Δ495–509), ΔC23 (Δ487–509) and ΔC30 (Δ480–509). Whole cell lysate abundance (d), cell surface abundance (e), and nLDL and oxLDL binding (f) were evaluated. g, Upper Panel: Sequence alignment of amino acids in the C-terminal cytoplasmic tail of SR-B1 homologs (residues 487–494) from human (Homo sapien, Hs, Q8WTVO, Swiss-Prot), mouse (Mus musculus, Mm, Q61009, Swiss- Prot), rat (Rattus norvegius, Rr, P97943, Swiss-Prot), bovine (Bos Taurus, Bt, O18824, Swiss-Prot), pig (Sus scrofa, Ss, Q8SQC1, Swiss-Prot), and Chinese hamster (Cricetulus griseus, Cg, Q60417, Swiss-Prot). Fully conserved residues are shown in bold. Lower Panel: Comparison of human SR-B1 residues 487–494 and entire human CD36 C-terminal cytoplasmic tail. Residues of SR-B1 not shared with CD36 are shown in bold. h-j, Studies of reconstituted WT or C-terminal cytoplasmic tail substitution mutant SR-B1. The mutants were: SR-B1-IQAY, SESL, Y490A, Q488A, S491A, E492A, S493A, and L494A. Whole cell lysate abundance (h), cell surface abundance (i), and nLDL and oxLDL binding (j) were evaluated. k-m, nLDL binding (k), uptake (l) and transcytosis studies (m) were performed with the various mutants shown at an nLDL concentration of 100ug/ml. n, Whole cell lysate abundance of CD36 and LDLR was evaluated following reconstitution with the SR-B1 mutants tested in k-m. Data are mean±SEM. For cell surface abundance by flow cytometry, n=3 or 4. For LDL binding, n=4 or 8. For LDL transcytosis, n=3. In c, k-m, P values for comparison with WT by two-sided Student’s t test are shown.
Figure 1.
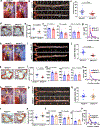
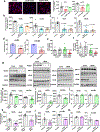
Figure 1.. Endothelial SR-B1 promotes atherosclerosis by driving LDL delivery into the artery wall and uptake by artery wall macrophages.
a, Representative in situ aortic arch images of atherosclerotic plaque (yellow arrows) in male apoE−/−;SR-B1fl/fl and apoE−/−;SR-B1ΔEC mice. b, Representative lipid-stained en face images of aortas. c, Quantitation of lesion areas in en face aortas (percent of total surface area); n=9 and 16, respectively. d, Representative lipid/hematoxylin-stained aortic root sections (lesions outlined by yellow dashed line, magnification 40X), e, Quantitation of lesion areas in aortic root sections; n=9 and 16, respectively. f-h, Plasma total cholesterol (f) and triglyceride (g, n=9 and 14, respectively), and HDL cholesterol (h, n=7 and 9, respectively). i, Representative lipoprotein profiles. j, Three-dimensional depiction of Dil-nLDL localization determined by confocal fluorescence microscopy of the luminal surface of the ascending aorta. Lumen is on the left. DiI is shown in red and Hoechst staining of nuclei is shown in blue. k, Representative cumulative images of the X-Y plane parallel to the luminal surface. l, Summation of dil-nLDL signal in the superficial ascending aorta. Four areas encompassing at least 100 cells were counted per mouse in 3 mice per group for total n=12/genotype group. m, Evaluation of aorta endothelial permeability by quantification of Evans blue dye incorporation (n=7 and 8, respectively). n, Gold-labeled LDL (large particles, yellow arrows) and immunogold-labeled SR-B1 (small particles, red arrows) are colocalized in endothelial cell intracellular vesicles in vivo. Representative images from two different endothelial cells are shown. o, Quantification of CD45+, F4/80+ macrophages in the aorta (n=4 and 5, respectively). Results are expressed relative to abundance in apoE−/−;SR-B1fl/fl control mice. p, Dil-nLDL distribution in CD45+, F4/80+ macrophages in the aorta; n=4 and 5, respectively. Data are mean±SEM, P values by two-sided Student’s t test are shown. See also Extended Data Figs. 1a–i, 2–4, 6 and 7.
Figure 2.
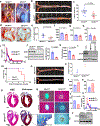
Figure 2.. SR-B1 mediation of endothelial cell LDL uptake and transcytosis requires LDL binding to SR-B1 and an 8 amino acid cytoplasmic domain.
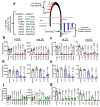
a, Schematic of mutant forms of SR-B1 studied by reconstitution in HAEC. b,c, nLDL and oxLDL uptake (b, n=8 for nLDL and 6 for oxLDL) and transcytosis (c, n=3) by wild-type (WT) SR-B1 versus LDL binding point mutants or SR-BI-Q445A. d,e, nLDL and oxLDL uptake (d, n=8 for nLDL and 6 for oxLDL) and transcytosis (e, n=3) by WT SR-B1 versus C-terminal cytoplasmic tail deletion mutants. f,g, nLDL and oxLDL uptake (f, n=6 or 8) and transcytosis (g, n=3) by WT SR-B1 versus C-terminal cytoplasmic tail substitution mutants. Data are mean±SEM, P values by ANOVA with Dunnett’s post-hoc testing are shown. See also Extended Data Fig. 10.
Figure 3.
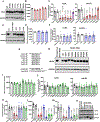
Figure 3.. SR-B1 dynamically interacts with DOCK4 in endothelial cells, and their expression is increased in atherosclerosis-prone regions of mouse aorta prior to lesion formation, and in human atherosclerotic versus normal arteries.
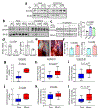
a, HAEC expressing His-tagged wild-type SR-B1 or SR-B1-ΔC23 were treated with vehicle or oxLDL, DOCK4 was immunoprecipitated (IP), and immunoblotting was done for DOCK4 and SR-B1. First IP lane shows IP done with unrelated IgG. b, Same experiment was performed in HAEC expressing His-tagged wild-type SR-B1, SR-B1-IQAY or SR-B1-SESL. c, HAEC reconstituted with His-tagged wild-type SR-B1 were treated with nLDL or oxLDL, DOCK4 was IP’d and immunoblotting was done for DOCK4 and SR-B1. Summary data are for n=4 per group; P values by ANOVA with Dunnett’s post-hoc testing are shown. d, SR-B1 and DOCK4 expression were evaluated in intact versus endothelium-denuded mouse aorta by Q-RT-PCR, n=3 arteries per group. e, Left panel: In situ image of aortic arch from a wild-type, atherosclerosis-free mouse, depicting regions of greater curvature (blue hashed line) and lesser curvature (red hashed line) sampled for experiment in f. Right panel: In situ image of aortic arch from apoE−/− mouse with atherosclerotic lesions absent in greater curvature and present in lesser curvature. f, SR-B1 and DOCK4 expression were evaluated in greater and lesser curvature samples by Q-RT-PCR, n=4 arteries per group. g-l, Employing three separate patient cohorts and independent strategies for analyses, SR-B1 (g-i) and DOCK4 expression (j-l) were compared in human atherosclerotic versus control arteries. Cohorts I, II and III contained n=4 and 207, 40 and 40, and 32 and 32, respectively. Data are mean±SEM; in d and f, P values by two-sided Student’s t test are shown; in g-l, data are presented as box-and-whisker plots, with the central lines denoting medians, edges of the box representing upper and lower quartiles, and whiskers showing minimum and maximum values after excluding outliers outside 1.5 times the interquartile range.
Figure 4.
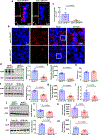
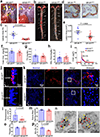
Figure 4.. DOCK4 mediates endothelial cell LDL uptake and transcytosis by internalizing SR-B1 and coupling the receptor to Rac1.
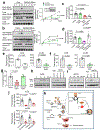
a,b, The internalization of biotinylated SR-B1 and transferrin receptor (TR) was evaluated following warming from 4°C to 37°C in nLDL- (a) or oxLDL-treated (b) endothelial cells with normal versus decreased DOCK4 expression. In a-b, n=3/condition and P values by two-sided Student’s t test are shown. c,d, DiI-nLDL binding to endothelial cells was evaluated in the presence versus absence of DOCK4 in cells expressing versus deficient in SR-B1 (c, n=6) or LDLR and CD36 (d, n=4). In c-d, P values by ANOVA with Dunnett’s post-hoc testing are shown. e,f, nLDL and oxLDL uptake (e, n=3 for nLDL and n=8 for oxLDL) and transcytosis (f, n=3) in cells with normal versus decreased DOCK4 expression. g, HDL transcytosis in cells with normal versus decreased expression of SR-B1 or DOCK4, n=3. h,i, Rac1 is activated by nLDL (h) or oxLDL (i) via SR-B1 and DOCK4 in endothelial cells. Left panel: Cells were treated with LDL for 0–60 min and Rac1 activity was determined. Right panel: Rac1 activation in response to LDL was evaluated in cells expressing or lacking SR-B1 or DOCK4. j, Rac1 activation is required for SR-B1-mediated nLDL or oxLDL uptake in endothelial cells. Cells were transfected with GFP control versus dominant-negative Rac1, or treated with vehicle versus the Rac1 inhibitor NSC23766; n=8. Data are mean±SEM, in e-g and j, P values by two-sided Student’s t test are shown. See also Extended Data Fig. 9g–m. k, Summary scheme: SR-B1 transports LDL across the endothelial cell monolayer and thereby governs the accumulation of LDL by arterial wall macrophages, which become foam cells and atherosclerotic lesion development ensues. The transcytosis of LDL across the endothelial cell monolayer requires an 8 amino acid cytoplasmic domain of SR-B1, which recruits DOCK4, and DOCK4 promotes SR-B1 internalization and LDL transport by coupling LDL binding to SR-B1 with Rac1 activation.

Comment in

Similar articles

Cited by

References

    1. Lozano R et al. Global and regional mortality from 235 causes of death for 20 age groups in 1990 and 2010: a systematic analysis for the Global Burden of Disease Study 2010. Lancet 380, 2095–2128 (2012). - PMC - PubMed
    1. Moore KJ, Sheedy FJ, & Fisher EA Macrophages in atherosclerosis: a dynamic balance. Nat. Rev. Immunol 13, 709–721 (2013). - PMC - PubMed
    1. Tabas I, Williams KJ, & Boren J Subendothelial lipoprotein retention as the initiating process in atherosclerosis: update and therapeutic implications. Circulation 116, 1832–1844 (2007). - PubMed
    1. Gadea G & Blangy A Dock-family exchange factors in cell migration and disease. Eur. J. Cell Biol 93, 466–477 (2014). - PubMed
    1. Rosenson RS et al. Cholesterol efflux and atheroprotection: advancing the concept of reverse cholesterol transport. Circulation 125, 1905–1919 (2012). - PMC - PubMed

Publication types

MeSH terms