. 2019 Apr;568(7753):493-498.
doi: 10.1038/s41586-019-1119-1. Epub 2019 Apr 24.

Speech synthesis from neural decoding of spoken sentences

Affiliations

Speech synthesis from neural decoding of spoken sentences

Gopala K Anumanchipalli et al. Nature. 2019 Apr.

Abstract

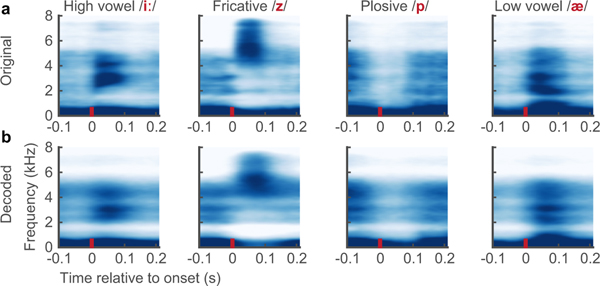
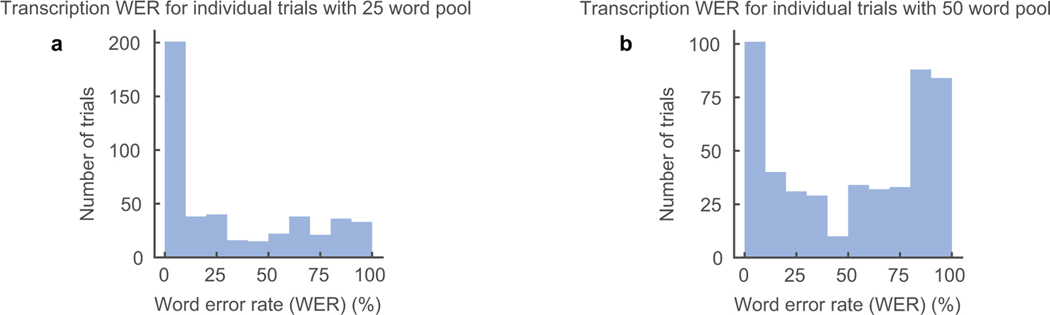
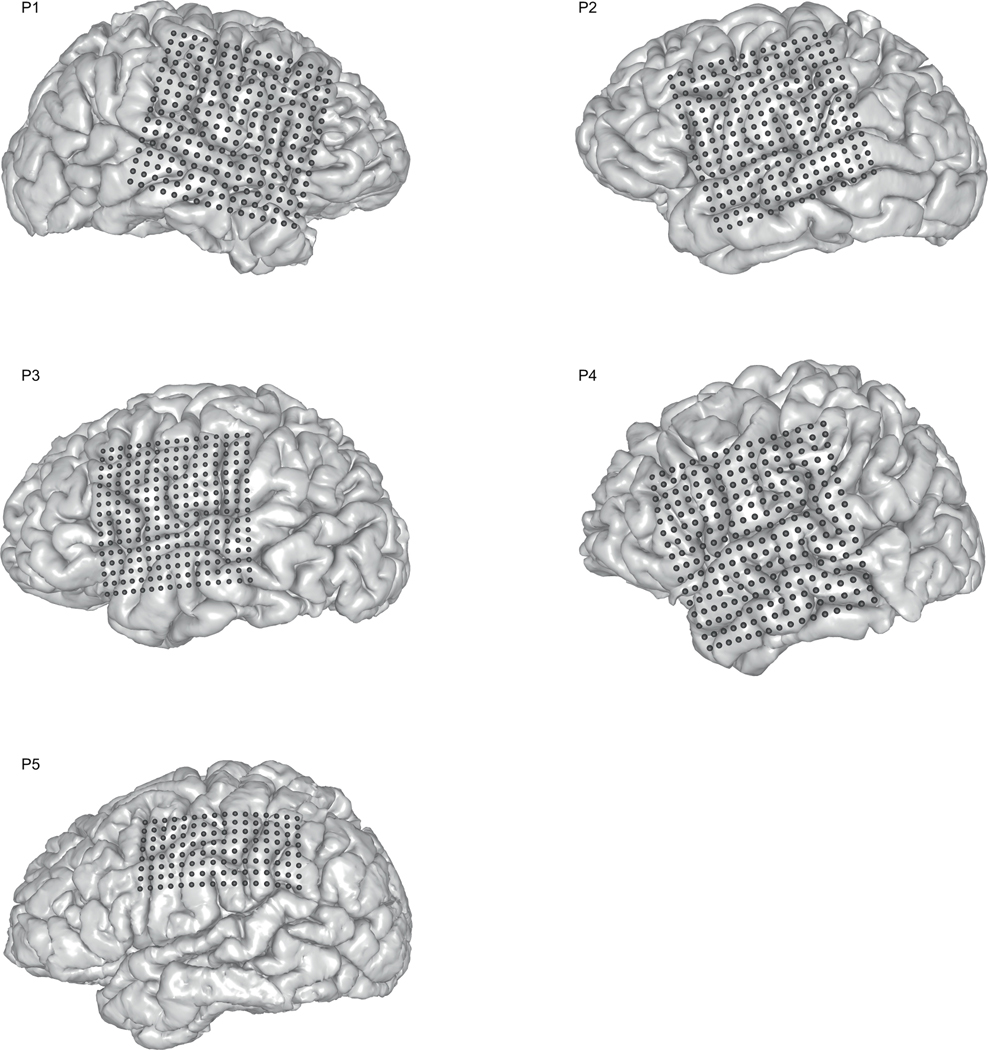
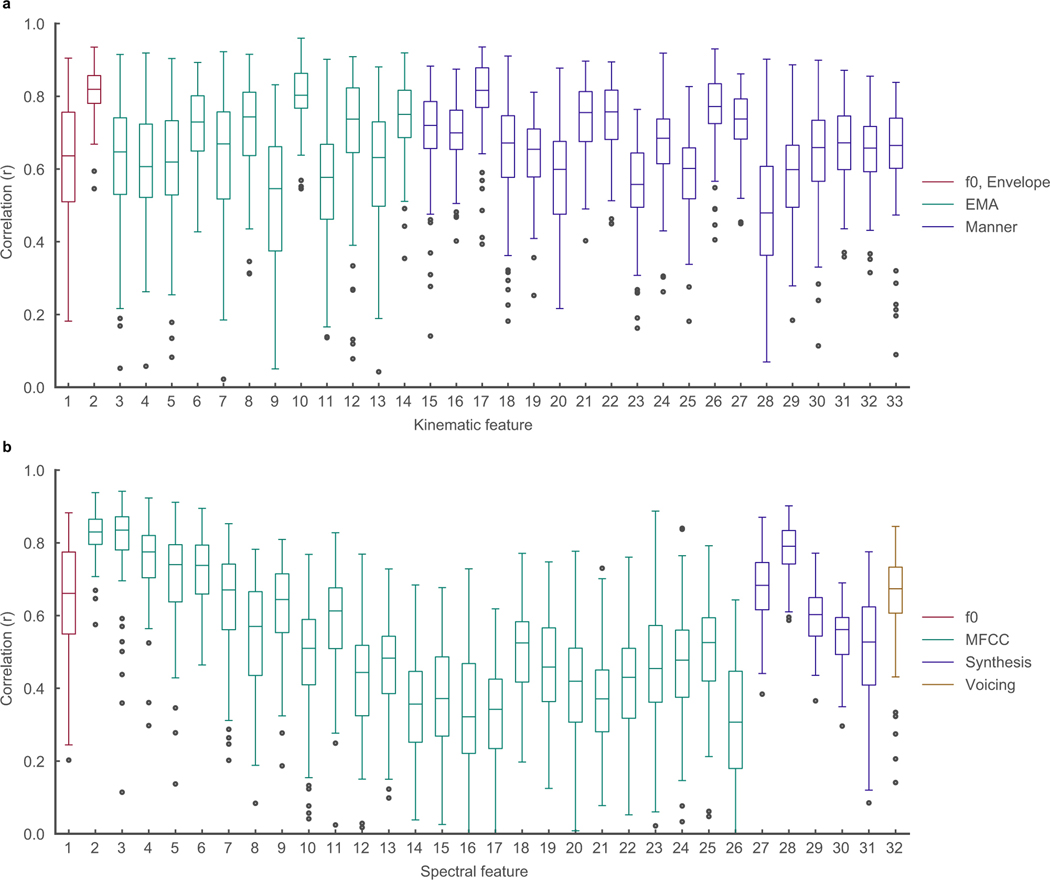
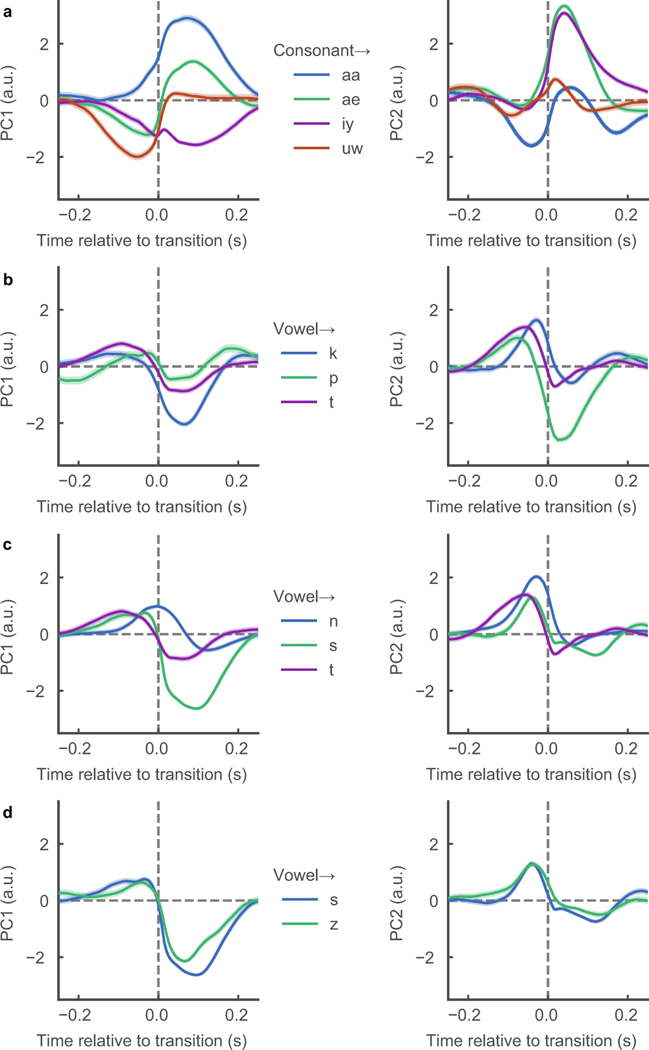
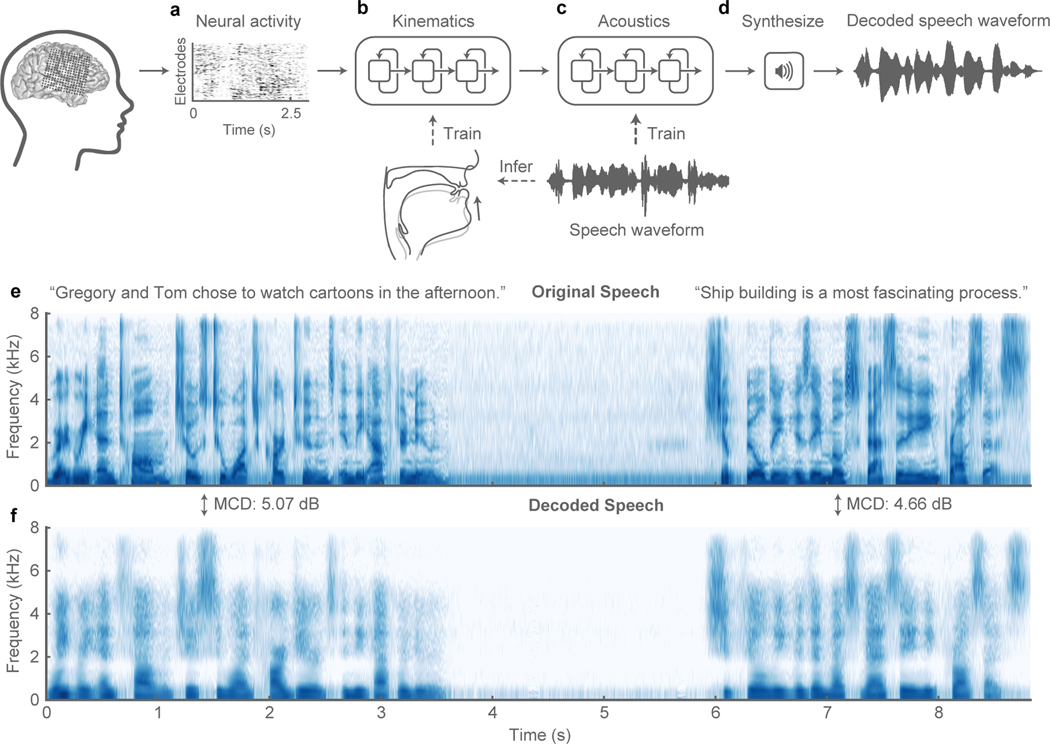
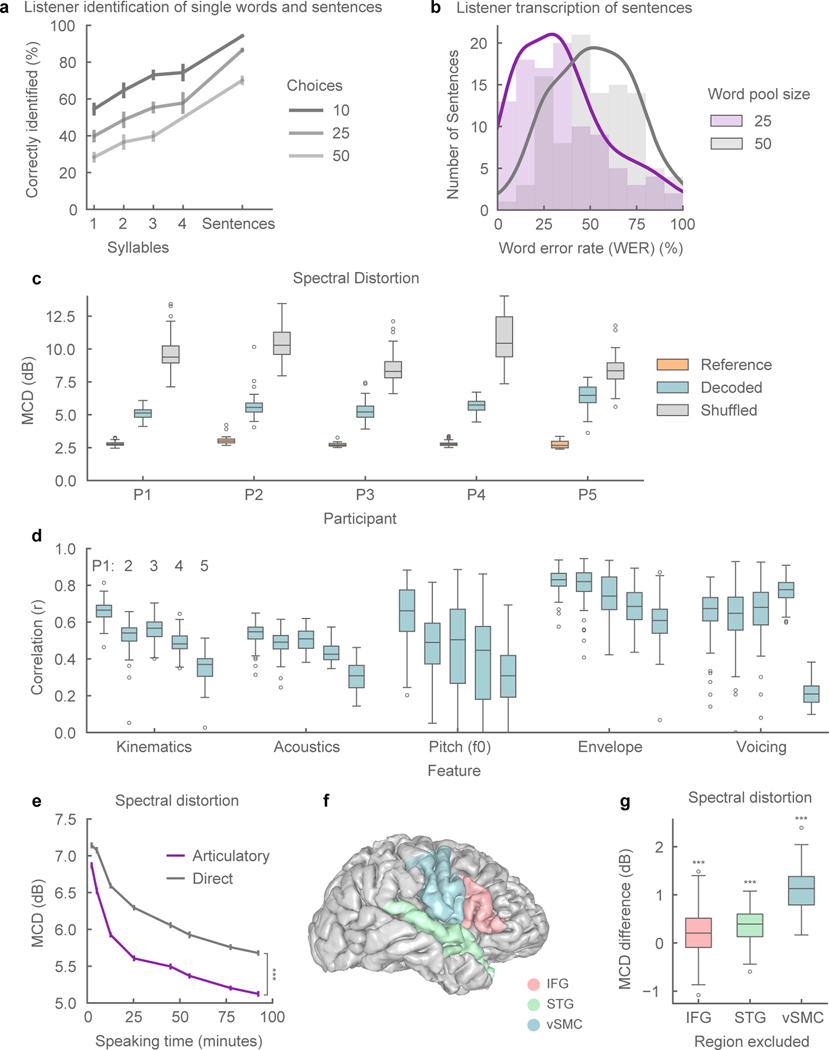
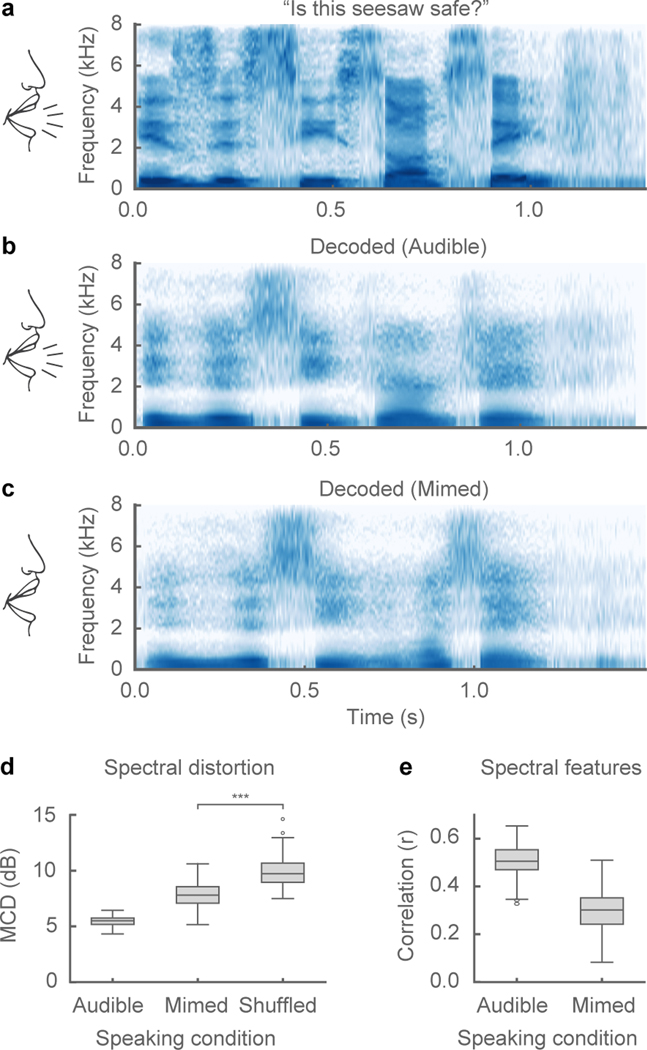
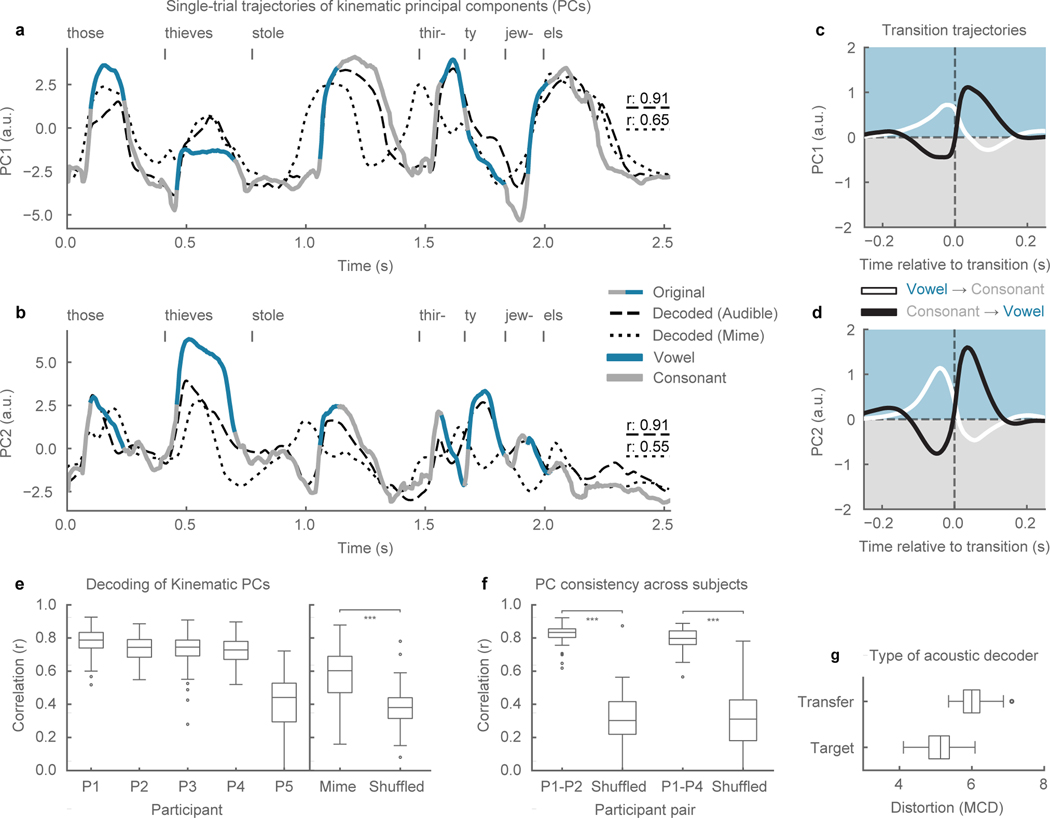
Technology that translates neural activity into speech would be transformative for people who are unable to communicate as a result of neurological impairments. Decoding speech from neural activity is challenging because speaking requires very precise and rapid multi-dimensional control of vocal tract articulators. Here we designed a neural decoder that explicitly leverages kinematic and sound representations encoded in human cortical activity to synthesize audible speech. Recurrent neural networks first decoded directly recorded cortical activity into representations of articulatory movement, and then transformed these representations into speech acoustics. In closed vocabulary tests, listeners could readily identify and transcribe speech synthesized from cortical activity. Intermediate articulatory dynamics enhanced performance even with limited data. Decoded articulatory representations were highly conserved across speakers, enabling a component of the decoder to be transferrable across participants. Furthermore, the decoder could synthesize speech when a participant silently mimed sentences. These findings advance the clinical viability of using speech neuroprosthetic technology to restore spoken communication.


Conflict of interest statement

The authors declare no competing interests.

Figures

Extended Data Figure 1:
a,b Median spectrograms, time-locked to the acoustic onset of phonemes from original (a) and decoded (b) audio (n: /i/ = 112, /z/ = 115, /p/ 69, /ae/ = 86). These phonemes represent the diversity of spectral features. Original and decoded median phoneme spectrograms were well correlated (Pearson’s r > 0.9 for all phonemes, p=1e-18)
Extended Data Figure 2:
Extended Data Figure 2:. Transcription word error rate for individual trials.
Word error rates (WER) for individually transcribed trials for 25 (a) and 50 (b) word pool size. Listeners transcribed synthesized sentences by selecting words from a defined pool of words. Word pools included correct words in synthesized sentence and random words from the test set. One trial is one listener transcription of one synthesized sentence.
Extended Data Figure 3:
Extended Data Figure 3:. Electrode array locations for participants.
MRI reconstructions of participants’ brains with overlay of electrocorticographic electrode (ECoG) array locations.
Extended Data Figure 4:
Extended Data Figure 4:. Decoding performance of kinematic and spectral features.
Data from P1. a, Correlations of all 33 decoded articulatory kinematic features with ground-truth (n=101 sentences). EMA features represent X and Y coordinate traces of articulators (lips, jaw, and three points of the tongue) along the midsagittal plane of the vocal tract. Manner features represent complementary kinematic features to EMA that further describe acoustically consequential movements. b, Correlations of all 32 decoded spectral features with ground-truth (n=101 sentences). MFCC features are 25 mel-frequency cepstral coefficients that describe power in perceptually relevant frequency bands. Synthesis features describe glottal excitation weights necessary for speech synthesis. Box plots as described in Figure 2.
Extended Data Figure 5:
Extended Data Figure 5:. Comparison of cumulative variance explained in kinematic and acoustic state-spaces.
For each representation of speech—kinematics and acoustics—principal components analysis (PCA) was computed and variance explained for each additional principal component was cumulatively summed. Kinematic and acoustic representations had 33 and 32 features, respectively.
Extended Data Figure 6:
Extended Data Figure 6:. Decoded phoneme acoustic similarity matrix.
Acoustic similarity matrix compares acoustic properties of decoded phonemes and originally spoken phonemes. Similarity is computed by first estimating a gaussian kernel density for each phoneme (both decoded and original) and then computing the Kullback-Leibler (KL) divergence between a pair of decoded and original phoneme distributions. Each row compares the acoustic properties of a decoded phoneme with originally spoken phonemes (columns). Hierarchical clustering was performed on the resulting similarity matrix. Data from P1.
Extended Data Figure 7:
Extended Data Figure 7:. Ground-truth acoustic similarity matrix.
Compares acoustic properties of ground-truth spoken phonemes with one another. Similarity is computed by first estimating a gaussian kernel density for each phoneme and then computing the Kullback-Leibler (KL) divergence between a pair of a phoneme distributions. Each row compares the acoustic properties of a two ground-truth spoken phonemes. Hierarchical clustering was performed on the resulting similarity matrix. Data from P1.
Extended Data Figure 8:
Extended Data Figure 8:. Comparison between decoding novel and repeated sentences.
Comparison metrics were spectral distortion (a) and correlation between decoded and original spectral features (b). Decoder performance for these two types of sentences was compared to find no difference (p=0.36, p=0.75, n=51 sentences, Wilcoxon signed-rank test). A novel sentence consists of words and/or a word sequence not present in the training data. A repeated sentence is a sentence that has at least one matching word sequence in the training data, although unique production. Comparison was performed on P1 and sentences evaluated were the same across both cases with two decoders trained on differing datasets to either exclude or include unique repeats of sentences in the test set. ns indicates p>0.05. Box plots as described in Figure 2.
Extended Data Figure 9:
Extended Data Figure 9:. Kinematic state-space trajectories for phoneme-specific vowel-consonant transitions.
Average trajectories of PC1 and PC2 for transitions from a either a consonant or vowel to a specific phonemes. Trajectories are 500 ms and centered at transition between phonemes. a, Consonant -> corner vowels (n=1387, 1964, 2259, 894, respectively). PC1 shows separation of all corner vowels and PC2 delineates between front vowels (iy, ae) and back vowels (uw, aa). b, vowel -> unvoiced plosives (n=2071, 4107, 1441, respectively). PC1 was more selective for velar constriction (k) and PC2 for bilabial constriction (p). c Vowel -> alveolars (n=3919, 3010, 4107, respectively). PC1 shows separation by manner of articulation (nasal, plosive, fricative) while PC2 is less discriminative. d, PC1 and PC2 show little, if at all, delineation between voiced and unvoiced alveolar fricatives (n=3010, 1855, respectively).
Figure 1:
Figure 1:. Speech synthesis from neurally decoded spoken sentences.
a, The neural decoding process begins by extracting relevant signal features from high-density cortical activity. b, A bi-directional long short-term memory (bLSTM) neural network decodes kinematic representations of articulation from ECoG signals. c, An additional bLSTM decodes acoustics from the previously decoded kinematics. Acoustics are spectral features (e.g. Mel-frequency cepstral coefficients (MFCCs)) extracted from the speech waveform. d, Decoded signals are synthesized into an acoustic waveform. e, Spectrogram shows the frequency content of two sentences spoken by a participant. f, Spectrogram of synthesized speech from brain signals recorded simultaneously with the speech in e(repeated 5 times with similar results). Mel-cepstral distortion (MCD) was computed for each sentence between the original and decoded audio. 5-fold cross-validation used to find consistent decoding.
Figure 2:
Figure 2:. Synthesized speech intelligibility and feature-specific performance.
a, Listening tests for identification of excerpted single words (n=325) and full sentences (n=101) for synthesized speech from participant P1. Points represent mean word identification rate. Words were grouped by syllable length (n=75, 158, 68, 24). Listeners identified speech by selecting from a set of choices (10, 25, 50). b, Listening tests for closed vocabulary transcription of synthesized sentences (n=101). Responses were constrained in word choice (25, 50), but not in sequence length. Outlines are kernel density estimates of the distributions. c, Spectral distortion, measured by Mel-Cepstral Distortion (MCD) (lower values are better), between original spoken sentences and neurally decoded sentences (n=101, 100, 93, 81, 44, respectively). Reference MCD refers to the synthesis of original (inferred) kinematics without neural decoding. d, Correlation of original and decoded kinematic and acoustic features (n=101, 100, 93, 81, 44 sentences, respectively). Kinematic and acoustic values represent mean correlation of 33 and 32 features, respectively. e, Mean MCD of sentences (n=101) decoded from models trained on varying amounts of training data. The neural decoder with an articulatory intermediate stage (purple) performed better than direct ECoG to acoustics decoder (grey) (all data sizes: p < 1e-5, n = 101 sentences; WSRT). f, Anatomical reconstruction of a single participant’s brain (P1) with the following regions used for neural decoding: ventral sensorimotor cortex (vSMC), superior temporal gyrus (STG), and inferior frontal gyrus (IFG). g, Difference in median MCD of sentences (n=101) between decoder trained on all regions and decoders trained on all-but-one region. Exclusion of any region resulted in decreased performance (p < 3e-4, n = 101 sentences; WSRT). All box plots depict median (horizontal line inside box), 25th and 75th percentiles (box), 25/75th percentiles ±1.5× interquartile range (whiskers), and outliers (circles). Distributions were compared with each as other as indicated or with chance-level distributions using two-tailed Wilcoxon signed-rank tests (WSRT). *** indicates p<0.001. All error bars are SEM.
Figure 3:
Figure 3:. Speech synthesis from neural decoding of silently mimed speech.
a-c, Spectrograms of original spoken sentence (a), neural decoding from audible production (b), and neural decoding from silently mimed production (c) (repeated 5 times with similar results). d, e, Median spectral distortion (MCD) (d) and correlation of original and decoded spectral features (e) for audibly and silently produced speech (n=58 sentences). Decoded sentences were significantly better than chance-level decoding for both speaking conditions (audible: p=3e-11, mimed: p=5e-11, n = 58; Wilcoxon signed-rank test). Box plots as described in Figure 2. *** indicates p<0.001.
Figure 4.
Figure 4.. Kinematic state-space representation of speech production.
a, b, A kinematic trajectory (grey-blue) from a single trial (P1) projected onto the first two principal components—PC1 (a) and PC2 (b)—of the kinematic state-space. Decoded audible (dashed) and mimed (dotted) kinematic trajectories also plotted (Pearson’s r, n=510 time samples). The trajectory for mimed speech was uniformly stretched to align with the audible speech trajectory for visualization as it occurred at a faster time scale. c, d, Average trajectories for PC1 (a) and PC2 (b) for transitions from a vowel to a consonant (black, n=22453) and from a consonant to a vowel (white, n=22453). Time courses are 500 ms. e, Distributions of correlations between original and decoded kinematic state-space trajectories (averaged across PC1 and PC2) (n=101, 100, 93, 81, 44 sentences, respectively).. Pearson’s correlations for mimed trajectories were calculated by dynamically time warping (DTW) to the audible production the same sentence and then compared to correlations to DTW of a randomly selected sentence trajectory (p=1e-5, n=58 sentences, Wilcoxon signed-rank test). f, Distributions of correlations for state-space trajectories of the same sentence across participants. Alignment between participants done via DTW and compared to correlations from DTW on unmatched sentence pairs (p=1e-16, n=92; p=1e-8, n=44, respectively, WSRT). g, Comparison between acoustic decoders (Stage 2) (n=101 sentences). “Target” refers to an acoustic decoder trained on data from the same participant that kinematic decoder (stage 1) is trained on (P1). “Transfer” refers to acoustic decoder trained on kinematics and acoustics from a different participant (P2). Box plots as described in Figure 2. *** indicates p<0.001.

Comment in

References

    1. Fager SK, Fried-Oken M, Jakobs T, & Beukelman DR (2019). New and emerging access technologies for adults with complex communication needs and severe motor impairments: State of the science, Augmentative and Alternative Communication, DOI: 10.1080/07434618.2018.1556730 - DOI - PMC - PubMed
    1. Brumberg JS, Pitt KM, Mantie-Kozlowski A, & Burnison JD (2018). Brain–computer interfaces for augmentative and alternative communication: A tutorial. American Journal of Speech-Language Pathology, 27, 1–12. doi:10.1044/2017_AJSLP-16-0244 - DOI - PMC - PubMed
    1. Pandarinath C, Nuyujukian P, Blabe CH, Sorice BL, Saab J, Willett FR, … Henderson JM (2017). High performance communication by people with paralysis using an intracortical brain-computer interface. ELife, 6, 1–27. doi:10.7554/eLife.18554 - DOI - PMC - PubMed
    1. Guenther FH, Brumberg JS, Joseph Wright E, Nieto-Castanon A, Tourville JA, Panko M, … Kennedy PR (2009). A wireless brain-machine interface for real-time speech synthesis. PLoS ONE, 4(12). 10.1371/journal.pone.0008218 - DOI - PMC - PubMed
    1. Bocquelet F, Hueber T, Girin L, Savariaux C, & Yvert B. (2016). Real-time control of an articulatory-based speech synthesizer for brain computer interfaces. PLoS computational biology, 12(11), e1005119. - PMC - PubMed