. 2019 Apr 4:10:615.
doi: 10.3389/fimmu.2019.00615. eCollection 2019.

Necroptotic Cell Death Promotes Adaptive Immunity Against Colonizing Pneumococci

Affiliations

Necroptotic Cell Death Promotes Adaptive Immunity Against Colonizing Pneumococci

Ashleigh Nichole Riegler et al. Front Immunol. .

Abstract

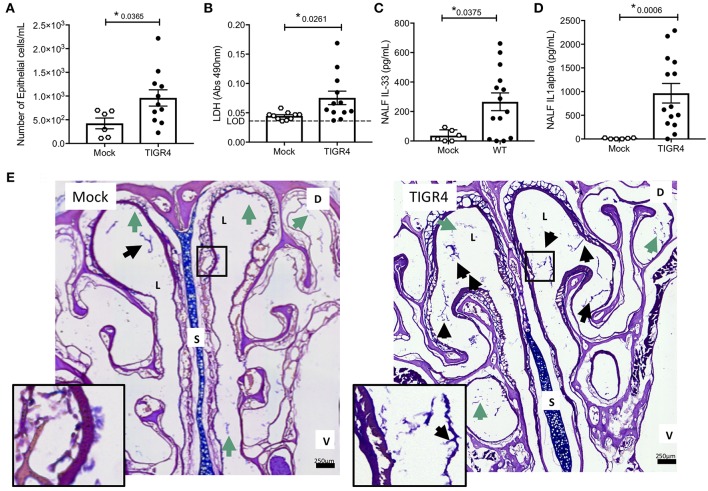
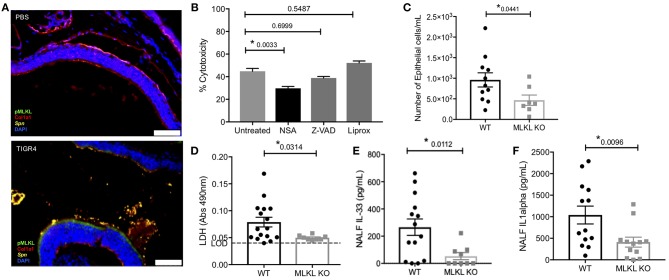
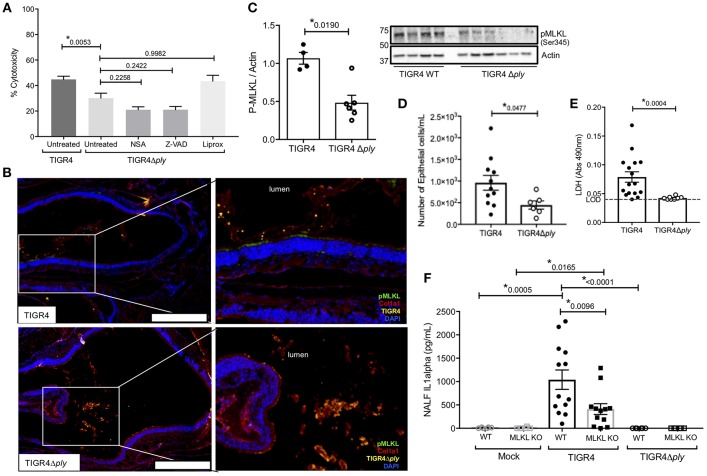
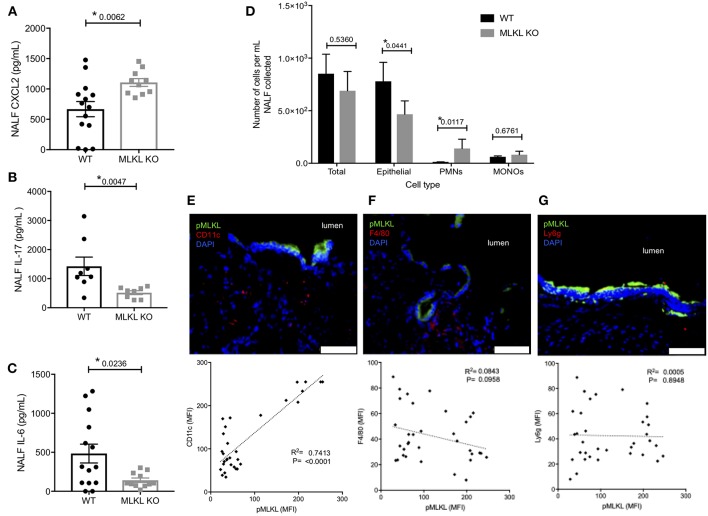
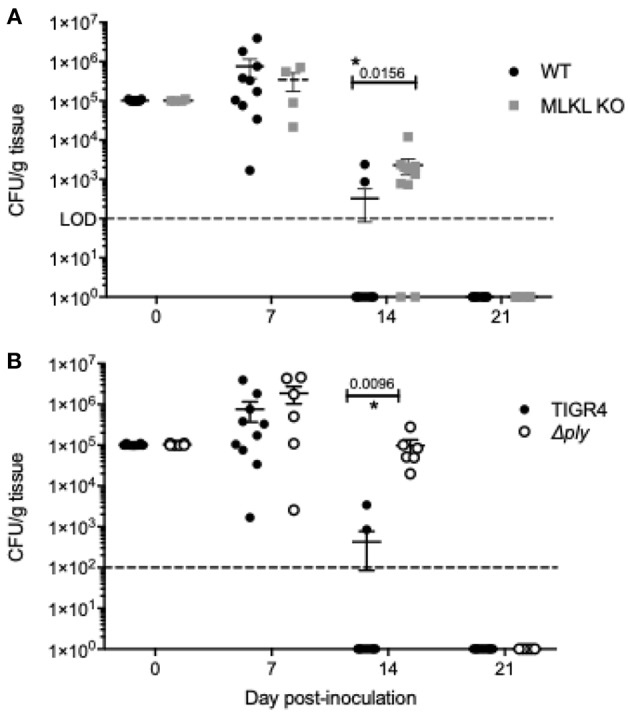
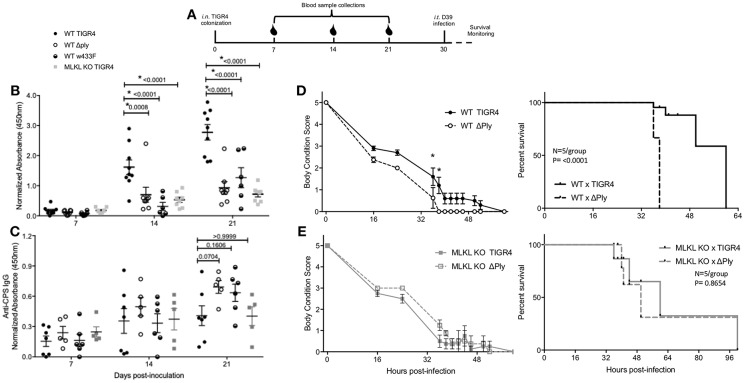
Pore-forming toxin (PFT) induced necroptosis exacerbates pulmonary injury during bacterial pneumonia. However, its role during asymptomatic nasopharyngeal colonization and toward the development of protective immunity was unknown. Using a mouse model of Streptococcus pneumoniae (Spn) asymptomatic colonization, we determined that nasopharyngeal epithelial cells (nEC) died of pneumolysin (Ply)-dependent necroptosis. Mice deficient in MLKL, the necroptosis effector, or challenged with Ply-deficient Spn showed less nEC sloughing, increased neutrophil infiltration, and altered IL-1α, IL-33, CXCL2, IL-17, and IL-6 levels in nasal lavage fluid (NALF). Activated MLKL correlated with increased presence of CD11c+ antigen presenting cells in Spn-associated submucosa. Colonized MLKL KO mice and wildtype mice colonized with Ply-deficient Spn produced less antibody against the bacterial surface protein PspA, were delayed in bacterial clearance, and were more susceptible to a lethal secondary Spn challenge. We conclude that PFT-induced necroptosis is instrumental in the natural development of protective immunity against opportunistic PFT-producing bacterial pathogens.

Keywords: Streptococcus pneumoniae; cell death; colonization; innate and adaptive immune response; necroptosis; necrosis; pneumolysin (PLY); pore-forming toxin (PFT).


Figures

Figure 1
Figure 1
Cell damage occurs during asymptomatic colonization by Spn. Nasal lavage collected from wildtype C57BL/6 (WT) mice at day 7 post-inoculation with TIGR4 or PBS (Mock) analyzed for (A) nEC sloughing, quantified from HEMA stained Cytospin samples, (B) lactate dehydrogenase (LDH), dashed line indicating limit of detection, (C) IL-33, and (D) IL-1α. Mean ± SEM. Mann-Whitney U-test used for comparisons (n = 10 – 14). P-values listed on graph; * indicates a value < 0.05. (E) Representative nasal section and zoomed inset from WT mouse either mock colonized or colonized with TIGR4, collected at day 7 post-inoculation and stained with Alcian/PAS. Lumen (L), septum (S), dorsal side (D), and ventral side (V) denoted. Arrows indicating luminal clusters of epithelial cells (black) and mucus (green). Inset source region denoted by black box outline. Images Tile Scan assembled at 10x magnification. (See also Table S2 for other cytokines tested but either unchanged or below limit of detection).
Figure 2
Figure 2
Colonizing Spn cause necroptosis of nEC. (A) Representative IF images of nasal turbinates from WT mice collected at day 7 post-inoculation with TIGR4 or PBS stained for pMLKL (green), collagen-1a (red), Spn (yellow), and DAPI (Blue). Imaged at 40X Tile Scan. Scale bars indicate 50 μm. (B) FaDu cell death (%cytotoxicity) as measured by LDH release from cells pre-treated with normal media or media containing 101 iM of either the MLKL inhibitor Necrosulfonamide (NSA), the general caspase inhibitor ZVAD, or the ferroptosis inhibitor Liproxstatin-1 (Liprox), for 1 h then challenged overnight (15 h ) with TIGR4 at an MOI of 10. One-way analysis of variance used for comparisons (Cytotoxicity F = 14.78, p < 0.0001, Treatment F = 34.38, p < 0.0001) (See also Figure S3A). (C–F) NALF from WT and MLKL KO mice colonized with TIGR4 analyzed for (C) nEC sloughing, (D) LDH, dashed line indicates limit of detection, (E) IL-33, and (F) IL-1α. LDH Absorbance at 490 nm LOD normalized to absorbance of uninfected control NALF. Mean ± SEM; Mann-Whitney U-test for comparisons (n = 10–14 animals per genotype). P-values listed on graph; * indicates a value < 0.05. (See also Figures S2,S3 and Table S2).
Figure 3
Figure 3
Necroptosis during Spn colonization is pneumolysin dependent. (A) FaDu pharyngeal cell death as measured by percent LDH release from cells pre-treated with normal media or media containing 10 μM of either the MLKL inhibitor Necrosulfonamide (NSA), the general caspase inhibitor ZVAD, or the ferroptosis inhibitor Liproxstatin-1 (Liprox), for 1 h then challenged overnight (15 h) with TIGR4 or TIGR4Δply at an MOI of 10. One-way analysis of variance (F = 11.86, p < 0.0001); P-values listed on graph; * indicates a value <0.05 (See also Figure S3B). (B) Representative immunofluorescent images of nasal turbinates from wildtype mice colonized with TIGR4 or TIGR4Δply, at day 7 post inoculation with 105 CFU. Turbinates fixed and stained for collagen-la (red), Spn (yellow), pMLKL (green), and DAPI (Blue). Imaged at 40X magnification and Tile Scan assembled. White scale bars indicate 250 μm. (C) Western blot and densitometry for pMLKL and actin in nasal homogenates from mice colonized with TIGR4 or TIGR4Δply. Nasal lavage at 7-days post intra-nasal inoculation with TIGR4 or TIGR4Δply analyzed for (D) nEC sloughing, (E) lactate dehydrogenase (LDH), and (F) IL-1α. LDH Absorbance at 490 nm LOD normalized to absorbance of uninfected control NALF. Mann-Whitney U-test used for two-way comparisons and Kruskal-Wallis test with Dunn's post-test for multiple comparisons (Two infection experiments; total n = 10–14 animals per genotype). P-values listed on graph; * indicates a value < 0.05. (See also Figures S2, S3 and Table S2).
Figure 4
Figure 4
Localized PFT-induced necroptosis affects the innate immune response to colonizing Spn. Nasal lavage at day 7 post intra-nasal inoculation with 105CFU TIGR4 analyzed for (A) CXCL2, (B) IL-17, and (C) IL-6. Mann-Whitney U-test used for comparisons. n = 10–14 animals per group; P-values listed on graph; * indicates value < 0.05. (D) Quantification of epithelial cells, polymorphonuclear cells (PMNs), and mononuclear cells (MONOs) in NALF at day 7 post intra-nasal inoculation with TIGR4 as quantified by HEMA stained Cytospins. One-way analysis of variance (F = 14.85, p = < 0.0001); P-values listed on graph; * indicates value < 0.05. (E,F) Representative immunofluorescently stained nasoturbinate section from wildtype mice colonized with TIGR4, at day 7 post inoculation, and correlation of pMLKL to cell-specific marker in stained sections. Sections stained for pMLKL (green), DAPI (blue), and (E) CD11c (n = 35, R2 = 0.7413, p < 0.0001), (F) F4/80 (n = 37, R2 = 0.08428, p = 0.0958), or (G) Ly6g (n = 35, R2 = 0.00056, p = 0.8948) in red. Imaged at 40X magnification and Tile Scan assembled. White scale bars indicate 50 μm (see also Table S2 for other cytokines tested but either unchanged or below limit of detection).
Figure 5
Figure 5
Inhibition of Ply-mediated necroptosis decreases the rate of Spn clearance. Number of Spn in nasal homogenates of (A) wildtype and MLKL KO mice colonized with TIGR4 and (B) wildtype mice colonized with TIGR4 or TIGR4Δply collected at days 0, 7, 14, and 21 post-inoculation. Mean ± SEM shown. n = 5 – 10 mice/group; two-way ANOVA with Sidak multiple comparisons, * = P < 0.05. Dashed line indicates limit of detection. Note that day 14 and 21 homogenates also plated in 100 μL spread plates to confirm clearance (limit of detection 100 CFU/g tissue).
Figure 6
Figure 6
Necroptosis initiates protective, adaptive immunity against colonizing Spn. (A) Representative diagram of challenge and sample collection from mice in secondary lethal infection model. Serum IgG against (B) PspA or (C) type 4 capsular polysaccharide from wildtype (WT) or MLKL KO mice colonized with TIGR4, TIGR4Δply, or TIGR4w433F. Two-Way repeated measures ANOVA with Sidak's multiple comparisons test (Interaction F = 9.21, p = 0.4380; Time F = 59.31, p < 0.0001). n = 5–8 mice/group. (D,E) WT and MLKL KO mice colonized with wildtype TIGR4 (solid) or TIGR4Aply (dashed) and re-challenged intra-tracheally at day 30 post colonization inoculation with a lethal infectious dose of D39 (106). Body condition score and survival of (D) WT and (E) MLKL KO mice after intratracheal challenge. Body condition scores analyzed by Two-Way ANOVA with repeated measures (WT: Interaction F = 1.169, p = 0.1,030; Time F = 88.67, p < 0.0001) (KO: Interaction F = 0.8801, p = 0.3386; Time F = 90.45, p < 0.0001). Comparisons of time points with p-value < 0.05 indicated by asterisk. Survival analyzed by Mantel-Cox Log-rank test (WT: Chi square = 15.34, p < 0.0001) (KO: Chi square = 0.2603, p = 0.6099). P-values listed on graphs * indicates value < 0.05. (See also Figure S5). Mean ± SEM plotted for all panels.

Similar articles

Cited by

References

    1. Opferman JT, Korsmeyer SJ. Apoptosis in the development and maintenance of the immune system. Nat Immunol. (2003) 4:410–5. 10.1038/ni0503-410 - DOI - PubMed
    1. Elmore S. Apoptosis: a review of programmed cell death. Toxicol Pathol. (2007) 35:495–516. 10.1080/01926230701320337 - DOI - PMC - PubMed
    1. Dorn GW, 2nd. Mechanisms of non-apoptotic programmed cell death in diabetes and heart failure. Cell Cycle. (2010) 9:3442–8. 10.4161/cc.9.17.12944 - DOI - PMC - PubMed
    1. Chavez-Valdez R, Martin LJ, Northington FJ. Programmed Necrosis: a prominent mechanism of cell death following neonatal brain injury. Neurol Res Int. (2012) 2012:257563. 10.1155/2012/257563 - DOI - PMC - PubMed
    1. Chan FK, Luz NF, Moriwaki K. Programmed necrosis in the cross talk of cell death and inflammation. Annu Rev Immunol. (2015) 33:79–106. 10.1146/annurev-immunol-032414-112248 - DOI - PMC - PubMed

Publication types

MeSH terms

Substances