. 2019 Sep;99(5):862-876.
doi: 10.1111/tpj.14366. Epub 2019 May 25.

Convergent evolution of hetero-oligomeric cellulose synthesis complexes in mosses and seed plants

Affiliations

Convergent evolution of hetero-oligomeric cellulose synthesis complexes in mosses and seed plants

Xingxing Li et al. Plant J. 2019 Sep.

Abstract

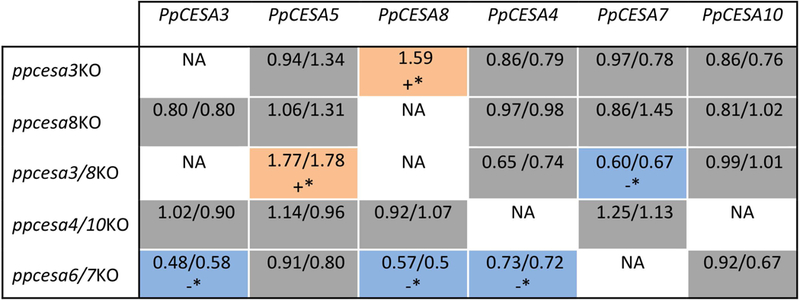
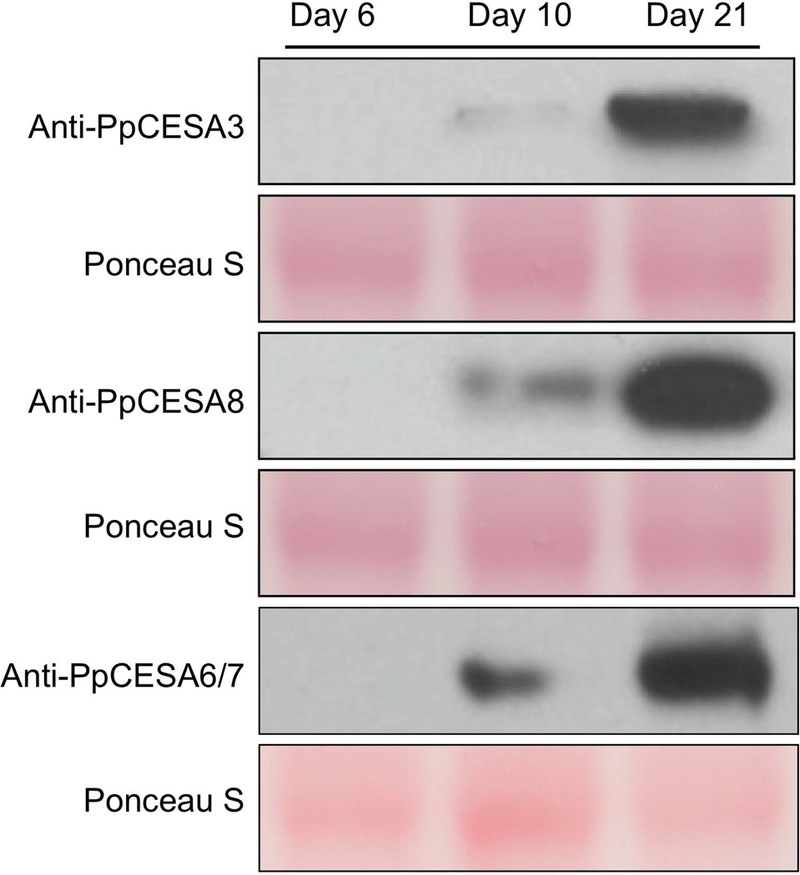
In seed plants, cellulose is synthesized by rosette-shaped cellulose synthesis complexes (CSCs) that are obligate hetero-oligomeric, comprising three non-interchangeable cellulose synthase (CESA) isoforms. The moss Physcomitrella patens has rosette CSCs and seven CESAs, but its common ancestor with seed plants had rosette CSCs and a single CESA gene. Therefore, if P. patens CSCs are hetero-oligomeric, then CSCs of this type evolved convergently in mosses and seed plants. Previous gene knockout and promoter swap experiments showed that PpCESAs from class A (PpCESA3 and PpCESA8) and class B (PpCESA6 and PpCESA7) have non-redundant functions in secondary cell wall cellulose deposition in leaf midribs, whereas the two members of each class are redundant. Based on these observations, we proposed the hypothesis that the secondary class A and class B PpCESAs associate to form hetero-oligomeric CSCs. Here we show that transcription of secondary class A PpCESAs is reduced when secondary class B PpCESAs are knocked out and vice versa, as expected for genes encoding isoforms that occupy distinct positions within the same CSC. The class A and class B isoforms co-accumulate in developing gametophores and co-immunoprecipitate, suggesting that they interact to form a complex in planta. Finally, secondary PpCESAs interact with each other, whereas three of four fail to self-interact when expressed in two different heterologous systems. These results are consistent with the hypothesis that obligate hetero-oligomeric CSCs evolved independently in mosses and seed plants and we propose the constructive neutral evolution hypothesis as a plausible explanation for convergent evolution of hetero-oligomeric CSCs.

Keywords: Physcomitrella patens; cell wall; cellulose; cellulose synthase; cellulose synthesis complex; convergent evolution.


Conflict of interest statement

Conflicts of Interest

The authors declare that there are no conflicts of interest.

Figures

Figure 1:
Figure 1:. RT-qPCR analysis PpCESA expression in ppcesaKO mutants.
CESA expression relative to PpACT and PpVHP reference genes was determined for RNA isolated from gametophores harvested from 21-day old cultures of wild type (3 independent isolations) and ppcesaKOs (3 independent lines per genotype). Fold changes in gene expression compared to wild type (2^-ΔΔCt, n=3) are reported for two independent RNA isolations separated by /. Colors/* indicate results of non-parametric statistical analysis comparing 2^-ΔCt values for ppcesaKO genotypes to wild type for the combined results of two independent RNA isolations (n=6): blue/-*=significant down-regulation, p<0.05; gray=no significant difference, p>0.05; orange/+*=significant up-regulation, p<0.05; white=no measurable expression). Results are shown graphically in Supplemental Figure 1.
Figure 2:
Figure 2:. Antibody specificity test.
Western blots of microsomal protein extracts from HA-tagged PpCESA overexpression lines (positive control), PpCESA knock out (KO) lines (negative control), and wild-type probed with (a) anti-PpCESA3, (b) anti-PpCESA6/7, (c) anti-PpCESA8, and (d) anti-PpCESA5. Molecular mass markers are given at left in kilodaltons. Black arrows indicate expected position of target bands (~120 kDa) detected by antibodies. Faint band in 8KO lane, but not 3/8KO line in c, indicates weak cross reactivity of anti-PpCESA8 with PpCESA3.
Figure 3:
Figure 3:. PpCESA protein expression in wild-type P. patens.
Western blots of microsomal proteins isolated from wild-type P. patens cultures and probed with anti-PpCESA3, anti-PpCESA8, and anti-PpCESA6/7. Explants from protonema cultured on solid medium overlaid with cellophane for 6 days were cultured on solid medium without cellophane and harvested after 6 days (protonema only), 10 days (protonema and young gametophores) and 21 days (gametophores). Equal loading of protein (9.6 μg per lane) was verified by Ponceau S Staining.
Figure 4.
Figure 4.. Quantitative proteomics analysis of PpCESA immunoprecipitated samples.
(a) A representative workflow schematic of PpCESA IP sample processing is shown. Solubilized membrane extracts from three independent non-transgenic Gd11 samples or the respective HA-PpCESA transgenic line were prepared and subjected to anti-HA affinity chromatography. Each sample was independently prepared for mass spectrometry and labeled with a unique TMT isobaric tag. The labeled samples were pooled and subjected to mass spectrometry. TMT isobaric tag signals for each identified peptide were used to quantify abundance ratios of proteins that were over-represented in anti-HA enriched samples compared to wild-type Gd11 controls. (b) The IP/ control abundance ratios for all proteins identified in PpCESA3 IP experiments are shown. Immunoprecipitated CESA proteins are shown in red (diamonds), abundant photosynthetic proteins are shown in green (triangles), and other abundant proteins are shown in blue (squares). Proteins that were not enriched greater than 4-fold are indicated as black points. Each point represents the average abundance fold change from all peptides originating from a particular protein.
Figure 5:
Figure 5:. Co-immunoprecipitation (Co-IP) of PpCESAs.
Western blots of total protein lysates from the indicated transgenic lines expressing HA-PpCESAs under control of their native promoters (a-c) and GD11 wild type (d) with unbound, wash and eluate from immunoprecipitation with anti-HA. Blots were probed with antibodies listed on the right of each panel. (e) Twelve IP fractions from a-c above, probed with Anti-CESA5. Positive control HA-CESA5 (+) was included because PpCESA5 is not detectable in total proteins extracts from wild-type gametophores. All 12 extracts and the positive control were run and probed together.
Figure 6.
Figure 6.. Interactions between PpCESAs measured by MbYTH assay.
Yeast expressing each of the PpCESAs as bait with the ALG5 protein fused to NubI as positive control (AI) and NubG as negative control (DL) and an empty prey vector as another negative control (Nx) and the same PpCESA proteins fused to NubG, as prey were tested. The percentage of colonies that show visible growth after 5 days at 30°C on selective medium is shown with errors bars representing standard deviation (n=3).
Figure 7.
Figure 7.. In vivo dimerization of PpCESAs measured by BiFC in N. benthamiana leaf epidermal cells.
Confocal images of epidermal cells co-transformed with C-YFP-PpCESAs (top) and N-YFP-CESAs (left). Scale bar = 20μm. Magnification is identical for all images.
Figure 8:
Figure 8:. Conceptual model of a secondary cell wall CSC from P. patens.
Gray and black represent class A (PpCESA3 or PpCESA8) vs. class B (PpCESA6 or PpCESA7) subunits. See text for further explanation.

References

    1. Arioli T, Peng L, Betzner AS, Burn J, Wittke W, Herth W, Camilleri C, Höfte H, Plazinski J, Birch R, Cork A, Glover J, Redmond J and Williamson RE (1998) Molecular analysis of cellulose biosynthesis in Arabidopsis. Science, 279, 717–720. - PubMed
    1. Atanassov II, Pittman JK and Turner SR (2009) Elucidating the mechanisms of assembly and subunit interaction of the cellulose synthase complex of Arabidopsis secondary cell walls. J Biol Chem, 284, 3833–3841. - PubMed
    1. Betancur L, Singh B, Rapp RA, Wendel JF, Marks MD, Roberts AW and Haigler CH (2011) Phylogenetically distinct cellulose synthase genes support secondary wall thickening in arabidopsis shoot trichomes and cotton fiber. J Integr Plant Biol, 52, 205–220. - PubMed
    1. Brown DM, Zeef LA, Ellis J, Goodacre R and Turner SR (2005) Identification of novel genes in Arabidopsis involved in secondary cell wall formation using expression profiling and reverse genetics. Plant Cell, 17, 2281–2295. - PMC - PubMed
    1. Burn JE, Hocart CH, Birch RJ, Cork AC and Williamson RE (2002) Functional analysis of the cellulose synthase genes CesA1, CesA2, and CesA3 in Arabidopsis. Plant Physiol, 129, 797–807. - PMC - PubMed

Publication types

Associated data

LinkOut - more resources