. 2019 Apr 25;5(11):e128765.
doi: 10.1172/jci.insight.128765.

Heterogeneity of the action potential duration is required for sustained atrial fibrillation

Affiliations

Heterogeneity of the action potential duration is required for sustained atrial fibrillation

Uma Mahesh R Avula et al. JCI Insight. .

Abstract

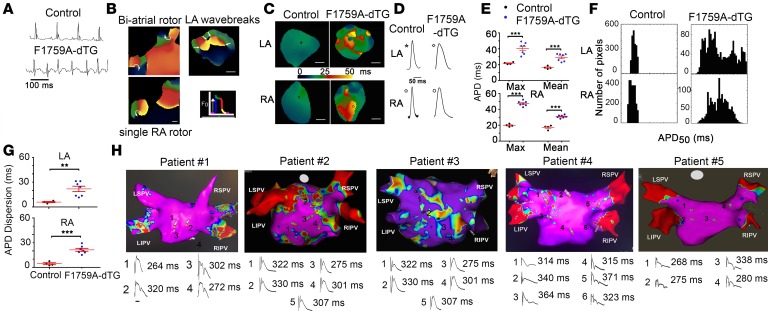
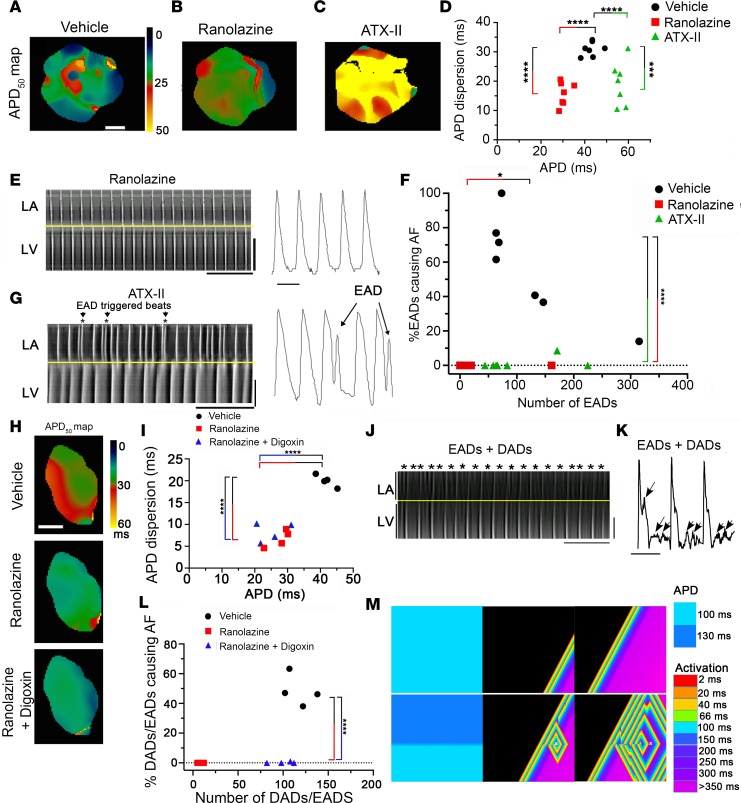
Atrial fibrillation (AF) is the most common cardiac arrhythmia and accounts for substantial morbidity and mortality. Recently, we created a mouse model with spontaneous and sustained AF caused by a mutation in the NaV1.5 channel (F1759A) that enhances persistent Na+ current, thereby enabling the investigation of molecular mechanisms that cause AF and the identification of novel treatment strategies. The mice have regional heterogeneity of action potential duration of the atria similar to observations in patients with AF. In these mice, we found that the initiation and persistence of the rotational reentrant AF arrhythmias, known as spiral waves or rotors, were dependent upon action potential duration heterogeneity. The centers of the rotors were localized to regions of greatest heterogeneity of the action potential duration. Pharmacologically attenuating the action potential duration heterogeneity reduced both spontaneous and pacing-induced AF. Computer-based simulations also demonstrated that the action potential duration heterogeneity is sufficient to generate rotors that manifest as AF. Taken together, these findings suggest that action potential duration heterogeneity in mice and humans is one mechanism by which AF is initiated and that reducing action potential duration heterogeneity can lessen the burden of AF.

Keywords: Arrhythmias; Cardiology; Cell Biology; Ion channels; Mouse models.


Conflict of interest statement

Conflict of interest: EYW previously received financial compensation for speaking at Abbott and Medtronic teaching symposia. ARM is the founding scientist and chair of the Scientific Advisory Board of ARMGO Pharma, Inc., which is targeting leaky ryanodine receptor channels for treatment of cardiovascular and skeletal muscle disorders, including atrial fibrillation. Both ARM and Columbia University own equity in ARMGO.

Figures

Figure 1
Figure 1. Inhomogeneity of APD in mice and humans with AF.
(A) Representative limb lead surface ECGs of isoflurane-anesthetized littermate control mouse in sinus rhythm (top row) and of F1759A-dTG mouse in AF (lower row). (B) Representative snapshots from phase movies of Langendorff-perfused F1759A-dTG hearts demonstrating simultaneous rotors in the right atrium (RA) and left atrium (LA), a predominant rotor in the RA, and wavebreaks and fibrillatory conduction in the LA. (C and D) Representative optical APD maps (C) and optical action potential tracings (D) from littermate control and F1759A-dTG mice. APD maps (pacing at 10 Hz) for F1759A-dTG mice were obtained after hyperkalemia-induced conversion to sinus rhythm. The circle marks the region corresponding to the optical action potential tracings in D. Scale bar: 1 mm. (E) Graph showing maximal (max) and mean APD50 in LA and RA of littermate control (n = 4) and F1759A-dTG mice (n = 7). Mean ± SEM. ***P < 0.001; 2-tailed Student’s t test. (F) Representative all-points histograms of APD. (G) Graphs of APD50 dispersion. Mean ± SEM for littermate control and F1759A-dTG mice. **P < 0.01; ***P < 0.01; 2-tailed Student’s t test. (H) Electro-anatomical voltage map (upper) and MAP recordings in sinus rhythm (lower) with APD90 measurement for the corresponding regions for 5 patients undergoing AF ablation. For the electro-anatomical voltage map, red color (0.2 mV) is indicative of low-voltage area consistent with scarred tissue, and purple (0.5–1.0 mV) is indicative of normal healthy tissue. LIPV, linferior pulmonary vein; RIPV, right inferior pulmonary vein; LSPV, eft superior pulmonary vein; and RSPV: right superior pulmonary vein.
Figure 2
Figure 2. Inhomogeneity of TG NaV1.5 expression and persistent Na+ current in F1759A-dTG mice.
(A) Representative immunofluorescent images of atrial cardiomyocytes isolated from littermate control mice and F1759A-dTG mice. Atrial cardiomyocytes were permeabilized and incubated with or without anti-FLAG antibody and with FITC-conjugated secondary antibody. Images were obtained with confocal microscopy at ×20 (left) and ×40 original magnification (right). Scale bars: 100 μm. (B) Graph quantifying immunofluorescent intensity using ImageJ (NIH). Mean ± SEM. **P < 0.01, 2-tailed Student’s t test; n = 3 mice for each group, control and F1759A-dTG. M1, mouse 1; M2, mouse 2; M3, mouse 3. (C) Exemplar whole-cell Na+ current (INa) traces of atrial cardiomyocytes isolated from F1759A-dTG mice. Whole-cell current traces were recorded with 5 mM Na+ in both extracellular and intracellular solutions, in the absence (black) and presence (red) of 3 mM lidocaine. (D) Fraction of lidocaine-resistant current for littermate control. Mean ± SEM; n = 3 mice for each group, control and F1759A-dTG. M1, mouse 1; M2, mouse 2; M3, mouse 3. (E) Exemplar whole-cell Na+ current traces designed to assess persistent INa using a 190-ms depolarization from a holding potential of –110 to –30 mV in the absence (black) and presence (blue) of 500 μM ranolazine; intracellular solution contained 5 mM Na+ and extracellular solution contained 100 mM Na+. n = 3 mice; n = 54 cardiomyocytes. (F) Graph of extent of persistent INa. Mean ± SEM. n = 3 mice for each group, control and F1759A-dTG, **P < 0.05; 2-tailed Student’s t test. M1, mouse 1; M2, mouse 2; M3, mouse 3.
Figure 3
Figure 3. Rotors are anchored in regions of high spatial APD inhomogeneity.
(A) Representative SPD maps and corresponding APD50 maps (middle) of single rotor (upper) and wavebreaks (lower) from F1759A-dTG mice. In the gradient APD50 map (right), differences in APD50 between adjacent segments are shown on the contoured gradient map (Δ in ms). Note alignment of high density of singularity points and dispersion of APD. Scale bar: 1 mm. (B) Representative 2-dimensional and 3-dimensional images of the APD50 within the LA of a F1759A-dTG mouse. The positions of the rotor core at different time points are overlaid on the APD50 maps. The trajectory of the rotor core is delimited within the regions of high spatial APD gradients. (C) Scatter plot depicting correlation between APD dispersion and SPD. Lines are best fit. Mouse 1: R2 = 0.92, P < 0.01; mouse 2: R2 = 0.75, P < 0.05; mouse 3: R2 = 0.56, P = 0.09; mouse 4: R2 = 0.81, P < 0.05; mouse 5: R2 = 0.91, P < 0.01; mouse 6: R2 = 0.90, P < 0.01; mouse 7: R2 = 0.72, P < 0.05; mouse 8: R2 = 0.81, P < 0.05; mouse 9: R2 = 0.85, P < 0.01; mouse 10: R2 = 0.95, P < 0.001; mouse 11: R2 = 0.54, P < 0.01. (D) Graph showing mean APD50 at the maximal SPD position in the left and right atria of F1759A-dTG mice. Mean ± SEM. ***P < 0.001 by 2-tailed Student’s t test. (E) Graph of APD50 dispersion at the maximal SPD position in the left and right atria of F1759A-dTG mice. Mean ± SEM. ***P < 0.001 by 2-tailed Student’s t test.
Figure 4
Figure 4. Triggered activity is required for initiation and perpetuation of AF in F1759A-dTG mice.
(A) Isochronal map of atrial-paced beat and first triggered beat. (B) Electrogram shows triggered beats after atrial pacing at 10 Hz. Scale bar: 1 mm. (C and D) Time-space plots of LA and left ventricle (LV) during 10-Hz atrial pacing. EADs are marked by asterisks. Horizontal scale bar: 500 ms. Vertical scale bar: 2.5 mm. Single-pixel electrograms (D) showing EADs and rotor. Scale bar: 100 ms. (E) APD50 map of Langendorff-perfused F1759A-dTG heart after conversion to sinus rhythm before (vehicle) and after 3 μM SEA-0400. Scale bar: 1 mm. (F) Graph depicting relationship between APD and APD dispersion before (vehicle) and after SEA-0400 perfusion. n = 3. P = 0.37 by 2-tailed Student’s t test. (G and H) Time-space plots of LA and LV during 10-Hz atrial pacing after SEA-0400. Horizontal scale bar: 500 ms. Vertical scale bar: 2.5 mm. Single-pixel electrograms (H) showing normal rhythm without EADs or rotors. (I) Graph depicting relationship between number of EADs/min and percentage of EADs causing AF before (vehicle) and after SEA-0400 perfusion. n = 3. P < 0.05 by 2-tailed Student’s t test for both EADs/min and percentage of EADs causing AF.
Figure 5
Figure 5. Inhomogeneity of the APD is required for AF in F1759A-dTG mice.
(AC) Representative APD50 maps in sinus rhythm before (vehicle), after 500 μM ranolazine, and after 20 nM ATX-II. Scale bar: 1 mm. (D) Graph depicting relationship between APD and APD dispersion before (vehicle) and after either 500 μM ranolazine or 20 nM ATX-II. ***P < 0.001; ****P < 0.0001 by 1-way ANOVA and Dunnett’s multiple-comparisons test. The color and direction of the brackets indicate the pair of comparisons. (E) Representative time-space plot of LA and LV during 10-Hz atrial pacing after 500 μM ranolazine. Scale bar: 500 ms. (F) Graph depicting relationship between number of EADs/min and percentage of EADs causing AF before (vehicle) and after either ranolazine or ATX-II. *P < 0.05 and ****P < 0.0001 by 1-way ANOVA and Dunnett’s multiple-comparisons test. The color and direction of the brackets indicate the pair of comparisons. (G) Representative time-space plot of LA and LV during 10-Hz atrial pacing after 20 nM ATX-II. EADs are marked by *. Horizontal scale bar: 500 ms. Vertical scale bar: 2.5 mm. Electrogram shows EADs. Scale bar: 100 ms. (H) Representative APD50 maps in sinus rhythm before (vehicle), after 500 μM ranolazine, and after ranolazine and 0.9 μM digoxin. (I) Graph depicting relationship between APD and APD dispersion before (vehicle) and after either 500 μM ranolazine or 500 μM ranolazine and 0.9 μM digoxin. ***P < 0.001; ****P < 0.0001 by 1-way ANOVA and Dunnett’s multiple-comparisons test. The color and direction of the brackets indicate the pair of comparisons. (J) Representative time-space plot of LA and LV during 10-Hz atrial pacing after ranolazine and digoxin. Afterdepolarizations are marked by asterisks. (K) Electrogram shows EADs and DADs. (L) Graph depicting relationship between number of afterdepolarizations/min and percentage of afterdepolarizations causing AF before (vehicle) and after either ranolazine or ranolazine and digoxin. The color and direction of the brackets indicate the pair of comparisons. (M) Automaton simulation of fibrillatory activity in atrial tissue. (Upper) A uniform APD gradient of 100 ms was imposed. (Lower) Two APDs were imposed: 100 ms and 130 ms. Electrical activation was initiated by an S1–S2 pulse with 84-ms coupling interval from the lower right-hand grid corner (node set to state 1 for each pulse; see Methods). No reentry was seen in a homogeneous uniform gradient. In the nonuniform simulation, activation by an S1–S2 pulse caused fibrillatory activity in the form of rotors at the boundary between the 2 APD gradients of 100 and 130 ms.

Similar articles

Cited by

References

    1. Moss AJ, Kass RS. Long QT syndrome: from channels to cardiac arrhythmias. J Clin Invest. 2005;115(8):2018–2024. doi: 10.1172/JCI25537. - DOI - PMC - PubMed
    1. Sossalla S, et al. Altered Na(+) currents in atrial fibrillation effects of ranolazine on arrhythmias and contractility in human atrial myocardium. J Am Coll Cardiol. 2010;55(21):2330–2342. doi: 10.1016/j.jacc.2009.12.055. - DOI - PubMed
    1. Toischer K, et al. Role of late sodium current as a potential arrhythmogenic mechanism in the progression of pressure-induced heart disease. J Mol Cell Cardiol. 2013;61:111–122. doi: 10.1016/j.yjmcc.2013.03.021. - DOI - PMC - PubMed
    1. Signore S, et al. Late Na(+) current and protracted electrical recovery are critical determinants of the aging myopathy. Nat Commun. 2015;6:8803. - PMC - PubMed
    1. Wan E, et al. Aberrant sodium influx causes cardiomyopathy and atrial fibrillation in mice. J Clin Invest. 2016;126(1):112–122. doi: 10.1172/JCI84669. - DOI - PMC - PubMed

Publication types

MeSH terms