. 2019 Aug;37(8):1030-1041.
doi: 10.1002/stem.3026. Epub 2019 May 17.

Insulin Stimulates PI3K/AKT and Cell Adhesion to Promote the Survival of Individualized Human Embryonic Stem Cells

Affiliations

Insulin Stimulates PI3K/AKT and Cell Adhesion to Promote the Survival of Individualized Human Embryonic Stem Cells

Carlos Godoy-Parejo et al. Stem Cells. 2019 Aug.

Abstract

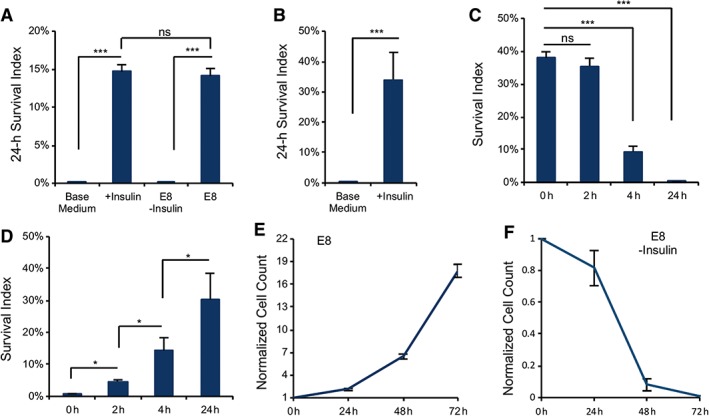
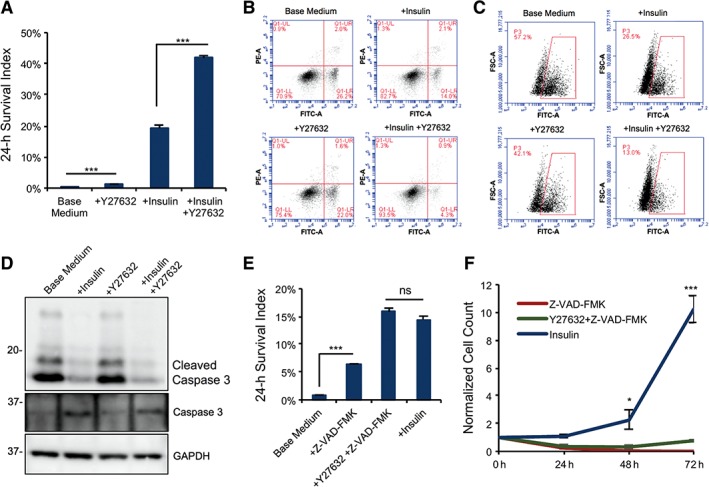
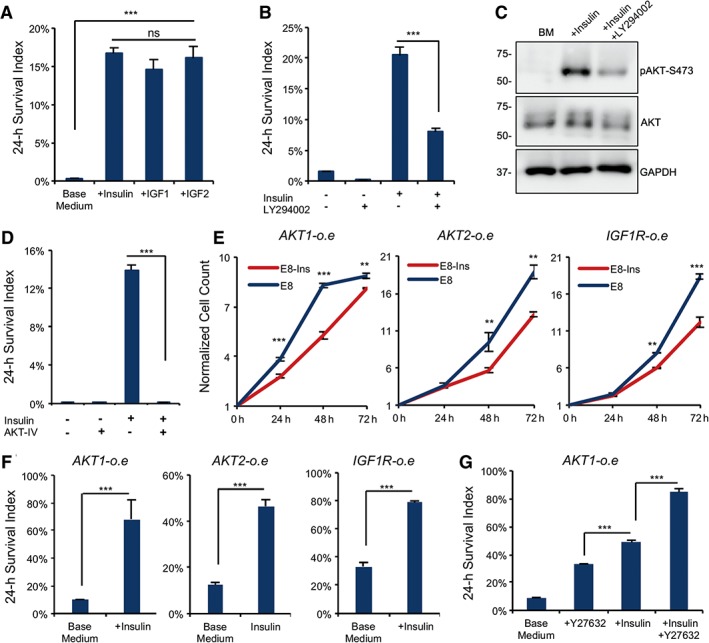
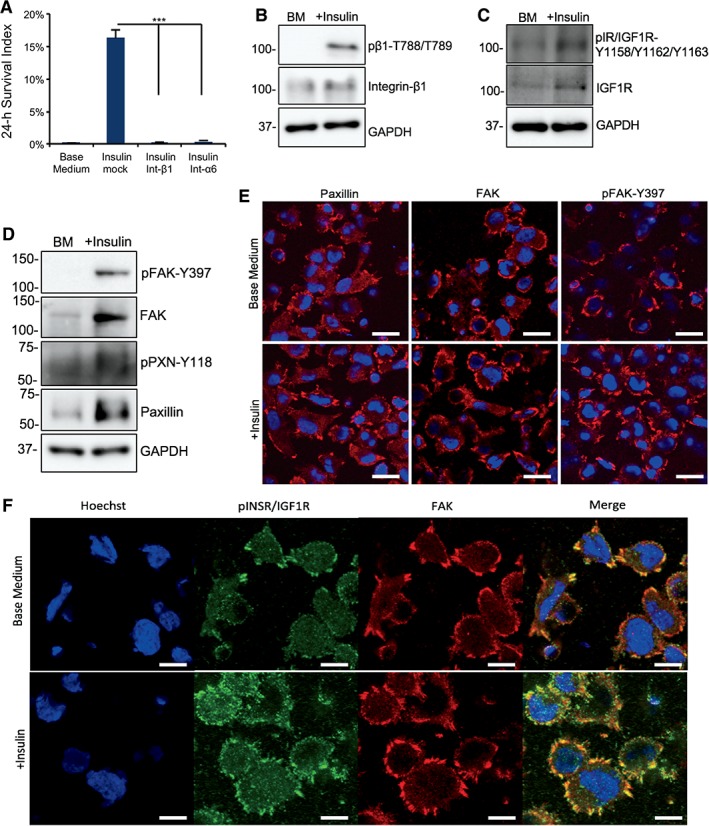
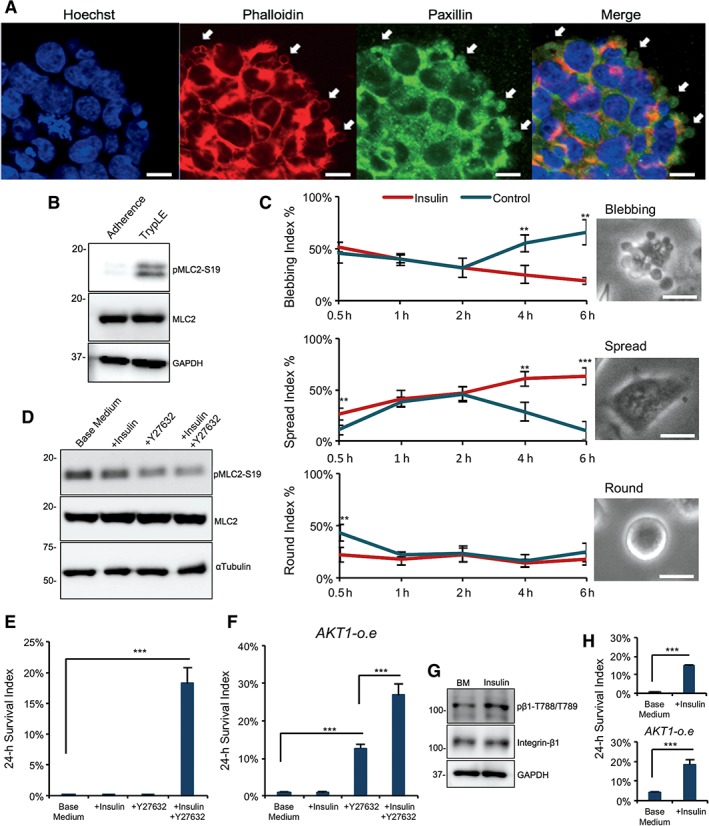
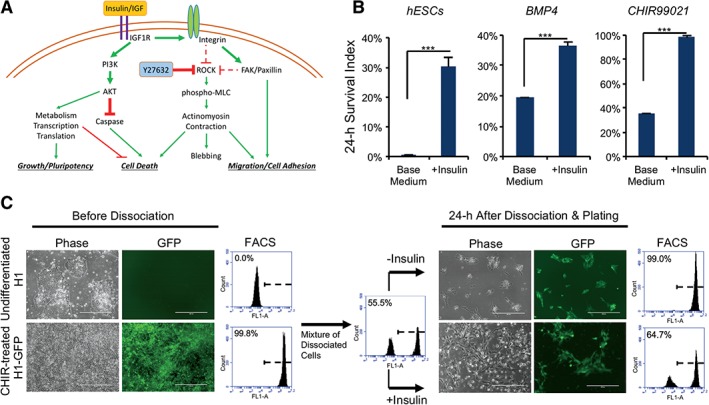
Insulin is present in most maintenance media for human embryonic stem cells (hESCs), but little is known about its essential role in the cell survival of individualized cells during passage. In this article, we show that insulin suppresses caspase cleavage and apoptosis after dissociation. Insulin activates insulin-like growth factor (IGF) receptor and PI3K/AKT cascade to promote cell survival and its function is independent of rho-associated protein kinase regulation. During niche reformation after passaging, insulin activates integrin that is essential for cell survival. IGF receptor colocalizes with focal adhesion complex and stimulates protein phosphorylation involved in focal adhesion formation. Insulin promotes cell spreading on matrigel-coated surfaces and suppresses myosin light chain phosphorylation. Further study showed that insulin is also required for the cell survival on E-cadherin coated surface and in suspension, indicating its essential role in cell-cell adhesion. This work highlights insulin's complex roles in signal transduction and niche re-establishment in hESCs. Stem Cells 2019;37:1030-1041.

Keywords: AKT; Caspase; Cell adhesion; Cell survival; Focal adhesion; IGF; Individualization; Insulin; Integrin; Niche; hESC.


Conflict of interest statement

The authors indicated no potential conflicts of interest.

Figures

Figure 1
Figure 1
Insulin is required for cell survival after dissociation. (A): Plots showing the survival of dissociated H1 embryonic stem (ES) cells 24 hours after plating on matrigel‐coated surface with or without insulin compared with E8 medium (***, p < .001, n = 3 biological repeats; data are normalized to the number of cells plated). Base medium, Dulbecco's modified Eagle's medium/F12. (B): Twenty‐four hour survival of dissociated cells on vitronectin‐coated surface with and without insulin (***, p < .001, n = 3). (C): Survival of individualized cells on matrigel when insulin was added at different time points after plating (***, p < .001, n = 3). (D): Plots showing the survival of dissociated ES cells after 24 hours on matrigel when insulin was removed at different time points after cell plating (*, p < .05, n = 3). (E, F): Cell proliferation on matrigel‐coated surface in E8 medium with or without insulin (n = 3 biological repeats for each time point; data are normalized to time zero cell count).
Figure 2
Figure 2
Insulin inhibits apoptosis during passaging. (A): Cell survival of dissociated cells 24 hours after plating on matrigel with or without insulin and rho‐associated protein kinase (ROCK) inhibitor (Y‐27632; ***, p < .001, n = 3). (B): Annexin V assay showing the percentage of apoptotic cells 4 hours after dissociation and plating on matrigel‐coated surface, with or without insulin or Y‐27632. (C): Flow cytometry analysis of Caspase 3/7 activity in dissociated embryonic stem (ES) cells 4 hours after plating on matrigel with or without insulin or Y‐27632 (Caspase 3/7, FITC‐A channel; FSC‐A, forward scattering). (D): Western blot showing the cleavage of Caspase 3 at Asp‐175 in cells cultured 4 hours on matrigel after dissociation with or without insulin and Y‐27632. Quantification is shown in Supporting Information Figure S2A. (E): Plots showing the cell survival 24 hours after plating on matrigel‐coated surface with or without the Caspase inhibitor Z‐VAD‐FMK, ROCK inhibitor Y27632, or insulin (***, p < .001, n = 3). (F): Cell proliferation of dissociated H1 ES cells during 72 hours after plating on matrigel‐coated surface comparing insulin effect to the Caspase inhibitor Z‐VAD‐FMK (*, p < .05; **, p < .01, n = 3; data are normalized to time zero cell count). Abbreviation: PI, propidium iodide (Annexin V, FITC‐A channel; PI, PE‐A channel).
Figure 3
Figure 3
Insulin activates insulin‐like growth factor (IGF) receptor to promote cell survival. (A): Plots comparing cell survival 24 hours after plating on matrigel in the presence or absence of insulin (10 μg/ml), IGF1 (50 ng/ml), and IGF2 (50 ng/ml; ***, p < .001, n = 3). (B): Plots showing 24‐hour survival of dissociated embryonic stem (ES) cells with or without the PI3K inhibitor LY294002 (10 μM) or insulin (***, p < .001, n = 3). (C): Western blot showing levels of AKT and phospho‐AKT‐S473 in the presence or absence of insulin and LY294002 on matrigel‐coated surface 2 hours after plating (n = 3 technical repeats). Quantification is shown in Supporting Information Figure S3B. (D): Plots showing 24‐hour survival of dissociated ES cells with or without AKT inhibitor IV (5 μM; ***, p < .001, n = 3). (E): Cell proliferation of AKT1, AKT2, and IGF1R overexpression cell lines during 72 hours after plating on matrigel‐coated surface in E8 media with and without insulin (***, p < .001; **, p < .01, n = 3; data are normalized to time zero cell count). (F): Plots showing 24‐hour survival of AKT1, AKT2, and IGF1R overexpression cells after plating on matrigel with or without insulin (***, p < .001, n = 3). (G): Plots showing 24‐hour survival of AKT1 overexpression cells after plating on matrigel comparing Y‐27632 and insulin (***, p < .001, n = 3).
Figure 4
Figure 4
Insulin promotes focal adhesion formation in dissociated cells. (A): Plots showing 24‐hour cell survival of insulin with integrin β1 and α6 blocking antibodies compared with Insulin+TNNT2 antibody (mock) on matrigel (***, p < .001, n = 3). (B): Western blot showing the level of integrin β1 and phosphorylated integrin β1‐788‐789 2 hours after plating on matrigel‐coated surface in base medium with or without insulin. Quantification is shown in Supporting Information Figure S4A. (C): Western blot showing the protein expression of IGF1R and phospho‐IGF1R 2 hours after plating on matrigel in base medium with or without insulin. Quantification is shown in Supporting Information Figure S4B. (D): Western blot showing the protein expression of focal adhesion kinase (FAK), phospho‐FAK‐Y397, Paxillin, and phospho‐Paxillin‐Y118 2 hours after plating on matrigel in base medium with or without insulin. Quantification is shown in Supporting Information Figure S4C. (E): Immunofluorescent image showing Paxillin, FAK, and phospho‐FAK‐Y397 expression in focal adhesions 2 hours after plating on matrigel‐coated surface with or without insulin. Scale bar = 20 μm. Quantification is shown in Supporting Information Figure S4E. (F): Immunostaining showing FAK (red) and phospho‐INSR/IGF1R‐Y1158‐Y1162‐Y1163 (green) expression in focal adhesions 2 hours after plating on matrigel‐coated surface with or without insulin. Nuclei were stained with Hoechst (blue). Scale bar = 10 μm.
Figure 5
Figure 5
Synergistic insulin and rho‐associated protein kinase (ROCK) inhibition suppresses MLC2 phosphorylation to improve cell survival. (A): Micrographs showing the expression of Paxillin (green) and Phalloidin (red) in undissociated H1 embryonic stem (ES) cells after 5 minutes of TrypLE treatment. Nuclei were stained with Hoechst (blue). Scale bar = 10 μm. (B): Western blot showing the protein expression of MLC2 and phospho‐MLC2‐S19 after dissociating the cells with TrypLE for 10 minutes. Quantification shown in Supporting Information Figure S5A. (C): Left, quantification of cells displaying each kind of phenotype 6 hours after dissociation and plating on matrigel‐coated surface with and without insulin (***, p < .001, n = 3; **, p < .01, n = 3). Right, phase contrast images showing blebbing phenotypes. Scale bar = 10 μm. (D): Western blot showing the protein expression of MLC2 and phospho‐MLC2‐S19 30 minutes after plating on matrigel‐coated surface in base medium with or without insulin or Y‐27632. Quantification is shown in Supporting Information Figure S5B. (E): Survival of H1 ES cells in suspension culture 24 hours after dissociation (***, p < .001, n = 3). (F): Twenty‐four‐hour survival of AKT1‐overexpression cells in suspension culture (***, p < .001, n = 3). (G): Western blot showing the protein expression of integrin β1 and phospho‐integrin β1‐788‐789 30 minutes after dissociation with or without insulin in suspension culture. Quantification is shown in Supporting Information Figure S5D. (H): Survival of H1 cells (top) and AKT1o‐e cells (bottom) 24 hours after plating on E‐cadherin‐coated surface (***, p < .001, n = 3).
Figure 6
Figure 6
Insulin effect working model and application. (A): Working model of insulin function in human embryonic stem cell survival after dissociation. (B): Plots showing the survival of dissociated H1 ES cells 24 hours after plating on matrigel‐coated surface with or without insulin, in comparison to survival of differentiated cells induced by 4 days of treatment with BMP4 (20 ng/ml) or CHIR99021 (5 μM; ***, p < .001, n = 3). (C): Enrichment of differentiated cell population by insulin‐free passaging. H1 cells and CHIR‐differentiated AAVS1‐GFP H1 cells (left panel) were individualized, mixed, and plated on matrigel‐coated plate. Twenty‐four‐hour survival of undifferentiated H1 (unlabeled) versus differentiated cells (green) was shown by micrographs and flow cytometry analysis (right panel). Scale bar = 200 μm (FL1 = green channel).

References

    1. Proud CG. Regulation of protein synthesis by insulin. Biochem Soc Trans 2006;34:213–216. - PubMed
    1. Seltzer HS, Allen EW, Herron AL et al. Insulin secretion in response to glycemic stimulus: Relation of delayed initial release to carbohydrate intolerance in mild diabetes mellitus. J Clin Invest 1967;46:323–335. - PMC - PubMed
    1. Wang L, Schulz TC, Sherrer ES et al. Self‐renewal of human embryonic stem cells requires insulin‐like growth factor‐1 receptor and ERBB2 receptor signaling. Blood 2007;110:4111–4120. - PMC - PubMed
    1. Nakashima Y, Omasa T. What kind of signaling maintains pluripotency and viability in human‐induced pluripotent stem cells cultured on laminin‐511 with serum‐free medium? Biores Open Access 2016;5:84–93. - PMC - PubMed
    1. Xu C, Rosler E, Jiang J et al. Basic fibroblast growth factor supports undifferentiated human embryonic stem cell growth without conditioned medium. Stem Cells 2005;23:315–323. - PubMed

Publication types

MeSH terms