. 2019 Jun 3;16(6):2557-2568.
doi: 10.1021/acs.molpharmaceut.9b00159. Epub 2019 May 7.

Electrospinning Optimization of Eudragit E PO with and without Chlorpheniramine Maleate Using a Design of Experiment Approach

Affiliations

Electrospinning Optimization of Eudragit E PO with and without Chlorpheniramine Maleate Using a Design of Experiment Approach

Hend E Abdelhakim et al. Mol Pharm. .

Abstract

Electrospinning is increasingly becoming a viable means of producing drug delivery vehicles for oral delivery, particularly as issues of manufacturing scalability are being addressed. In this study, electrospinning is explored as a taste-masking manufacturing technology for bitter drugs. The taste-masking polymer Eudragit E PO (E-EPO) was electrospun, guided by a quality by design approach. Using a design of experiment, factors influencing the production of smooth fibers were investigated. Polymer concentration, solvent composition, applied voltage, flow rate, and gap distance were the parameters examined. Of these, polymer concentration was shown to be the only statistically significant factor within the ranges studied ( p-value = 0.0042). As the concentration increased, smoother fibers were formed, coupled with an increase in fiber diameter. E-EPO (35% w/v) was identified as the optimum concentration for smooth fiber production. The optimized processing conditions identified were a gap distance of 175 mm, an applied voltage of between 15 and 20 kV, and a flow rate of 1 mL/h. Using this knowledge, the production optimization of electrospun E-EPO with chlorpheniramine maleate (CPM), a bitter antihistamine drug, was explored. The addition of CPM in drug loads of 1:6 up to 1:10 CPM/E-EPO yielded smooth fibers that were electrospun under conditions similar to placebo fibers. Solid-state characterization showed CPM to be molecularly dispersed in E-EPO. An electronic tasting system, or E-tongue, indicated good taste-masking performance as compared to the equivalent physical mixtures. This study therefore describes a means of producing, optimizing, and assessing the performance of electrospun taste-masked fibers as a novel approach to the formulation of CPM and potentially other bitter drug substances.

Keywords: DoE; E-tongue; Eudragit E PO; chlorpheniramine maleate; electrospinning; taste-masking.


Conflict of interest statement

The authors declare the following competing financial interest(s): This work was financially supported by the Medical Research Council, London, UK; iCASE Award No. 170156 and Pfizer Ltd, Sandwich, UK; Award No. 173803.

Figures

Figure 1
Figure 1
DoE design space, with CQAs in the inner circle and CPPs/CMAs in the peripheral circles.
Figure 2
Figure 2
Instantaneous viscosity at a shear stress of 5 Pa as a function of E-EPO concentration.
Figure 3
Figure 3
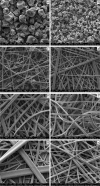
SEM images of electrospun E-EPO fibers: (a) 15, (b) 20, (c) 25, (d) 30, (e) 35, (f) 40, (g) 45, and (h) 50% w/v. All fibers were processed at applied voltages of 10–20 kV, a flow rate of 1 mL/h, a gap distance of 200 mm, a temperature of 26 °C, and a RH of 32%.
Figure 4
Figure 4
Mean fiber diameter vs concentration of E-EPO. The error bars represent the fiber diameter distribution at each concentration.
Figure 5
Figure 5
Pareto chart showing the statistical significance of the various parameters in producing bead-free fibers with a small diameter. The vertical dashed line represents the significance level of log p-value = 0.05.
Figure 6
Figure 6
Left: DoE sample 7, 35% w/v E-EPO, 10% v/v water in solvent; process parameters: 17.5 kV, 1.25 mL/h, and 200 mm. Right: DoE sample 11, 45% w/v E-EPO, 20% v/v water added in solvent; process parameters: an applied voltage of 10 kV, a flow rate of 0.5 mL/h, and a gap distance of 150 mm.
Figure 7
Figure 7
Summary of fit predicting the diameter and number of beads in electrospun E-EPO fibers. Block line represents the linear fit and dashed outer lines represent the confidence curve, while the horizontal dashed line represents the hypothesized predicted outcomes at optimum conditions.
Figure 8
Figure 8
Prediction tool showing the relationship between the input parameters and outcome. The x-axis represents input parameters and the y-axis represents the outcomes predicted and the desirability. The desirability column shows negative sloped lines, indicating the desire to minimize beading and fiber diameter. The dashed lines show the intersection between the values of the input and output parameters. The block lines show the relationship between input parameters and the outputs.
Figure 9
Figure 9
SEM image of electrospun 35% w/v E-EPO, DoE predicted parameters for bead-free fibers in the nanorange: an applied voltage of 25 kV, a flow rate of 0.5 mL/h, and a gap distance of 150 mm. A histogram showing fiber diameter distribution of n = 100.
Figure 10
Figure 10
SEM images and histograms showing diameter distribution of 35% w/v E-EPO electrospun fibers at an applied voltage of 15 kV, a flow rate of 1 mL/h, and a gap distance of 175 mm. Top—1:6 CPM/E-EPO. Middle—1:8 CPM/E-EPO. Bottom—1:10 CPM/E-EPO.
Figure 11
Figure 11
Pareto chart showing the statistical significance of the various parameters in producing drug-loaded E-EPO fibers with a small diameter. The vertical dashed line represents the significance level of log p-value = 0.05.
Figure 12
Figure 12
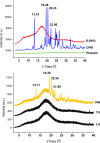
(a) XRD pattern of pure E-EPO, pure CPM, and placebo 35% w/v E-EPO fiber. (b) XRD pattern of E-EPO and CPM physical mixture, 35% w/v E-EPO + 1:6 CPM/E-EPO fibers and 35% w/v E-EPO + 1:8 CPM/E-EPO fibers.
Figure 13
Figure 13
FTIR spectra of unformulated pure CPM, E-EPO, their physical mixture, 35% w/v E-EPO placebo fiber, and 1:6 and 1:8 CPM/E-EPO drug-loaded fibers.
Figure 14
Figure 14
DSC thermogram of pure CPM, physical mixture, pure E-EPO, 35% E-EPO placebo fiber, 35% w/v E-EPO + 1:6 CPM fibers, and 35% w/v E-EPO + 1:8 CPM/E-EPO fibers. Exo up.
Figure 15
Figure 15
Analysis of sensor responses to various concentrations of CPM: AC0—basic bitterness; AN0—basic bitterness; C00—acidic bitterness; AE1—astringency.
Figure 16
Figure 16
PCA biplot of 1:6 and 1:8 drug-loaded fibers compared to their physical mixtures, placebo fiber, pure E-EPO, and pure CPM.

References

    1. Qi S.; Craig D. Recent Developments in Micro- and Nanofabrication Techniques for the Preparation of Amorphous Pharmaceutical Dosage Forms. Adv. Drug Deliv. Rev. 2015, 100, 67–84. 10.1016/j.addr.2016.01.003. - DOI - PubMed
    1. Brako F.; Raimi-Abraham B.; Mahalingam S.; Craig D. Q. M.; Edirisinghe M. Making Nanofibres of Mucoadhesive Polymer Blends for Vaginal Therapies. Eur. Polym. J. 2015, 70, 186–196. 10.1016/j.eurpolymj.2015.07.006. - DOI
    1. Illangakoon U. E.; Gill H.; Shearman G. C.; Parhizkar M.; Mahalingam S.; Chatterton N. P.; Williams G. R. Fast Dissolving Paracetamol/Caffeine Nanofibers Prepared by Electrospinning. Int. J. Pharm. 2014, 477, 369–379. 10.1016/j.ijpharm.2014.10.036. - DOI - PubMed
    1. Wu Y.-H.; Yu D.-G.; Li X.-Y.; Diao A.-H.; Illangakoon U. E.; Williams G. R. Fast-Dissolving Sweet Sedative Nanofiber Membranes. J. Mater. Sci. 2015, 50, 3604–3613. 10.1007/s10853-015-8921-4. - DOI
    1. Samprasit W.; Akkaramongkolporn P.; Ngawhirunpat T.; Rojanarata T.; Kaomongkolgit R.; Opanasopit P. Fast Releasing Oral Electrospun PVP/CD Nanofiber Mats of Taste-Masked Meloxicam. Int. J. Pharm. 2015, 487, 213–222. 10.1016/j.ijpharm.2015.04.044. - DOI - PubMed

Publication types

MeSH terms