. 2019 Jun;33(6):7694-7706.
doi: 10.1096/fj.201802580R. Epub 2019 Apr 25.

Pericyte transplantation improves skeletal muscle recovery following hindlimb immobilization

Affiliations

Pericyte transplantation improves skeletal muscle recovery following hindlimb immobilization

Michael Munroe et al. FASEB J. 2019 Jun.

Abstract

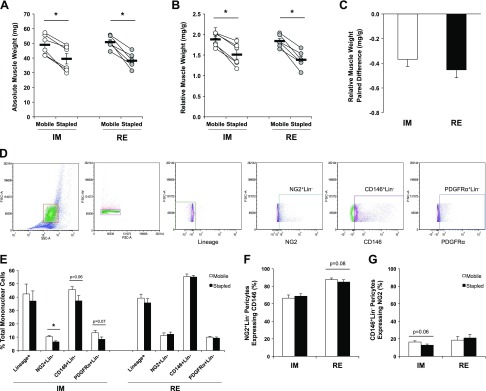
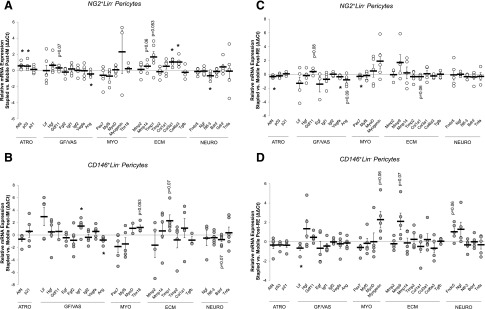
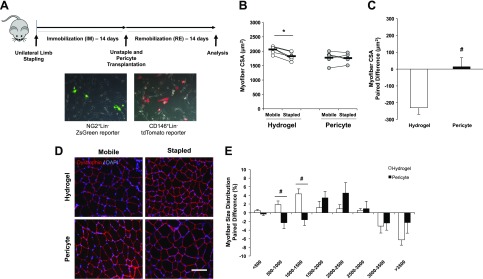
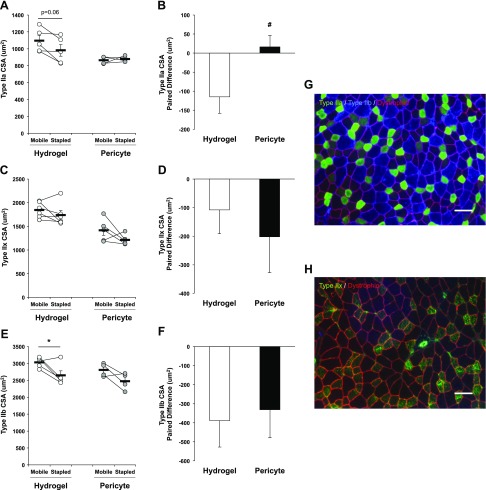
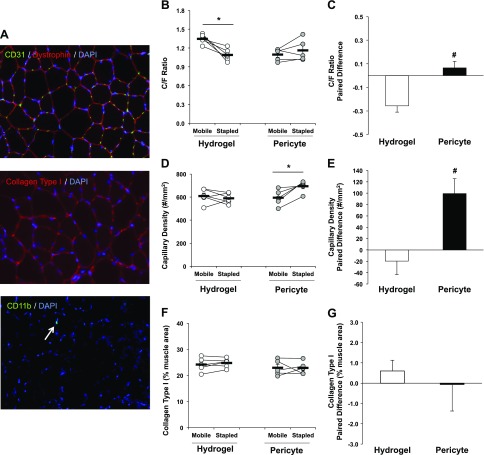
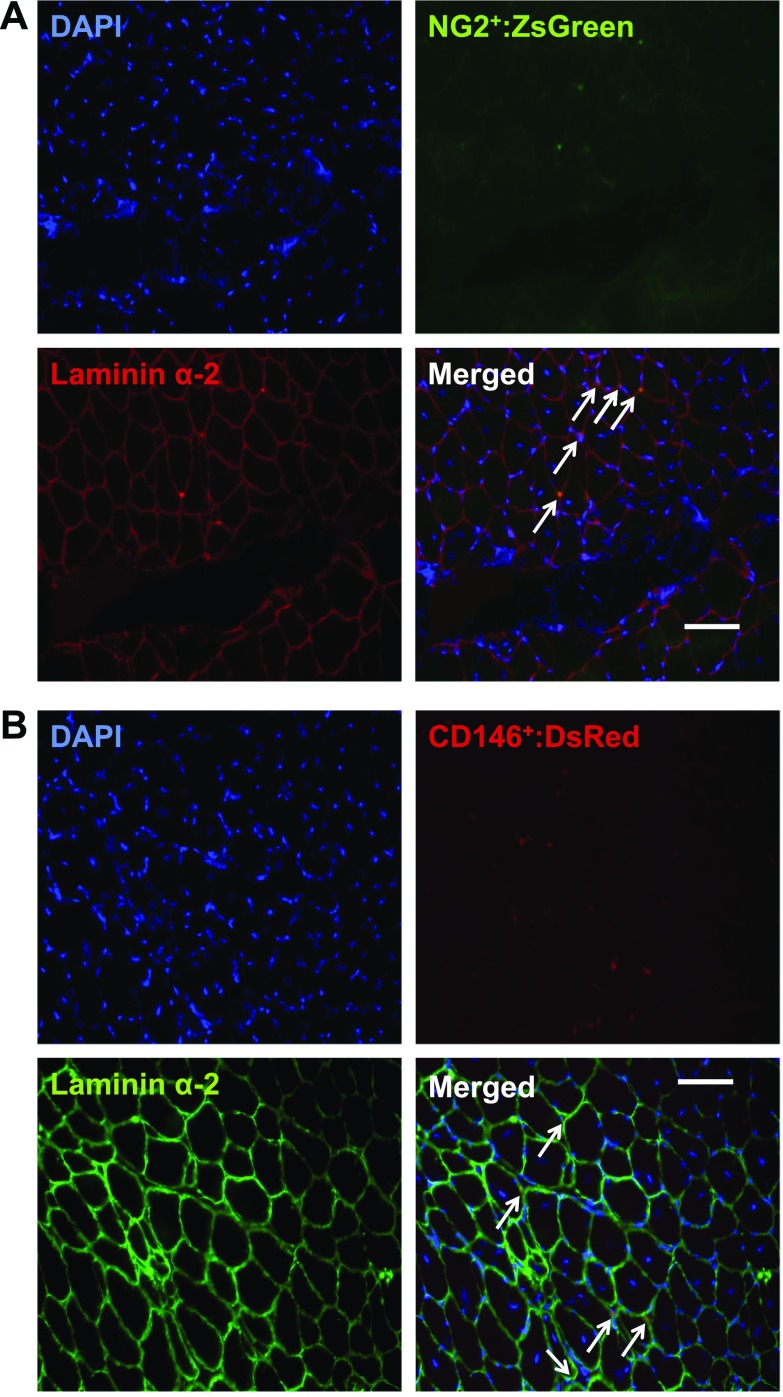
Conditions of extended bed rest and limb immobilization can initiate rapid and significant loss of skeletal muscle mass and function. Physical rehabilitation is standard practice following a period of disuse, yet mobility may be severely compromised, and recovery is commonly delayed or incomplete in special populations. Thus, a novel approach toward recovery of muscle mass is highly desired. Pericytes [neuron-glial antigen 2 (NG2)+CD31-CD45- (Lineage- [Lin-]) and CD146+Lin-] demonstrate capacity to facilitate muscle repair, yet the ability to enhance myofiber growth following disuse is unknown. In the current study, 3-4-mo-old mice were unilaterally immobilized for 14 d (IM) or immobilized for 14 d followed by 14 d of remobilization (RE). Flow cytometry and targeted gene expression analyses were completed to assess pericyte quantity and function following IM and RE. In addition, a transplantation study was conducted to assess the impact of pericytes on recovery. Results from targeted analyses suggest minimal impact of disuse on pericyte gene expression, yet NG2+Lin- pericyte quantity is reduced following IM (P < 0.05). Remarkably, pericyte transplantation recovered losses in myofiber cross-sectional area and the capillary-to-fiber ratio following RE, whereas deficits remained with vehicle alone (P = 0.01). These findings provide the first evidence that pericytes effectively rehabilitate skeletal muscle mass following disuse atrophy.-Munroe, M., Dvoretskiy, S., Lopez, A., Leong, J., Dyle, M. C., Kong, H., Adams, C. M., Boppart, M. D. Pericyte transplantation improves skeletal muscle recovery following hindlimb immobilization.

Keywords: capillary; disuse atrophy; muscle growth; rehabilitation; stem cells.


Conflict of interest statement

The authors thank Dr. Barbara Pilas and the Flow Cytometry Center at the Roy J. Carver Biotechnology Center (University of Illinois–Urbana-Champaign) for advice and assistance. Research reported in this publication was supported by National Institute of Arthritis and Musculoskeletal and Skin Diseases (NIAMS) of the U.S. National Institutes of Health (NIH) under award number R01AR072735 (to M.D.B.), National Heart, Lung, and Blood Institute (NHLBI) under award number R21HL131469 (to H.K. and M.D.B.), and a University of Illinois–Urbana-Champaign (UIUC) Research Board Grant (to M.D.B.). M.M. was supported by a UIUC Dissertation Completion Award. S.D. was supported by National Institute of Biomedical Imaging and Bioengineering (NIBIB) of the NIH under award number T32EB019944 and an American College of Sports Medicine National Aeronautics and Space Administration (NASA) Space Physiology Research Grant (18-00664). The content is solely the responsibility of the authors and does not necessarily represent the official views of the NIH. The authors declare no conflicts of interest.

Figures

Figure 1
Figure 1
Perivascular stem/stromal cell quantity is reduced following IM but restored upon RE. A, B) Absolute (A) and relative (B) TA muscle weights are significantly reduced in immobilized (Stapled) compared with contralateral control (Mobile) limbs after 14 d IM and 14 d RE. C) The paired difference between limbs (Stapled-Mobile) is not significantly different between IM and RE. D) Representative gating schematic for flow cytometry analysis. Gate 1 = mononuclear cell population as determined by forward scatter (FSC) and side scatter (SSC) size relationship; Gate 2 = selection of single cells from Gate 1 to exclude cell doublets or clumping; Gate 3 = exclusion (∼99%) of any CD31+/CD45+ expressing single cells (Lin population) using FMO gating; gating of cells from the Lin population expressing NG2+, CD146+, or PDGFRα+. E) Marker expression as a percentage of gated single cells extracted from Mobile and Stapled TAs after IM or RE excluding Lin+ population. F, G) Percentage of NG2+Lin pericytes coexpressing CD146 (F) and the percentage of CD146+Lin coexpressing NG2 (G) in both Mobile and Stapled TAs after IM or RE. A, B) Connected circles represent the immobilized and contralateral limbs from an individual sample. Data are means ± sem (n = 5–6). *P < 0.05, difference between Stapled and Mobile (with paired t test).
Figure 2
Figure 2
The pericyte gene expression profile is minimally impacted by IM and RE. Following both IM (A, B) and RE (C, D), the relative difference in mRNA expression of stress-related factors (STRs), growth and vascularization factors (GF/VASs), myogenic factors (MYOs), ECM remodeling factors (ECM), and neurotrophic factors (NEURO) between Stapled and Mobile TAs for both NG2+Lin (A, C) and CD146+Lin (B, D) pericytes. Each individual circle is the ΔΔCt value calculated for 1 mouse (ΔCt stapled − ΔCt mobile). Data are means ± sem (n = 3–6). *P < 0.05, difference between Stapled and Mobile (with paired t test). Atf4, activating transcription factor 4; p53, tumor protein 53; Lif, leukemia inhibitory factor; Hgf, hepatocyte growth factor, Gdf11, growth differentiation factor 11; Egf, epidermal growth factor; Fgf2, fibroblast growth factor 2; Igf1/2, insulin-like growth factor 1/2; Vegfa, vascular endothelial growth factor alpha; Ang, angiogenin; Pax7, paired box protein 7; Myf5, myogenic factor 5; MyoD, myogenic differentiation 1; Tbx18, T-box transcription factor 18; Mmp2/9/14, matrix metalloproteinase 2/9/14; Timp1/2, tissue inhibitor of metalloproteinase 1/2; Col1a1, collagen type 1 alpha-1; Col3a1, collagen type 3 alpha 1; Col6a3, collagen type 6 alpha 3; Tgfb, transforming growth factor beta; Fndc5, fibronectin type III domain containing protein-5; Ngf, nerve growth factor; Ntf-3, neurotrophin-3; Bdnf, brain-derived neurotrophic factor; Gdnf, glial cell-derived neurotrophic factor; Tnfa, tumor necrosis factor alpha.
Figure 3
Figure 3
Pericyte transplantation restores myofiber CSA following IM. A) Experimental outline of IM and transfection procedures for NG2+Lin and CD146+Lin i.m. transplantation using a low MW RGD-alginate hydrogel. Representative images of transfected pericytes are shown at original magnification value of ×10. NG2+Lin pericytes were transfected with a ZsGreen-N1 reporter plasmid and CD146+Lin pericytes were transfected with a tdTomato-N1 reporter plasmid separately for 24 h. B) Global myofiber CSA was significantly reduced in the stapled TA following IM in the hydrogel group that was recovered with pericyte transplantation. C) The paired difference in myofiber CSA was significantly different between control and treated groups. D) Representative cross section images of stapled and mobile TA muscle from both hydrogel control and pericyte-treated groups. Dystrophin (red) and DAPI (blue) merged images at ×20 magnification (scale bar, 20 μm) are illustrated. E) The paired difference between limbs for each group comparing the percentage change (stapled-mobile) at each size range. B) Connected circles represent the immobilized and contralateral limbs from an individual sample. *P < 0.05, difference between Stapled and Mobile (with paired t test). Data are means ± sem (n = 5–6). #P < 0.05, paired difference between Hydrogel and Pericyte (with independent samples t test).
Figure 4
Figure 4
Type IIa myofiber size is recovered with pericyte transplantation following IM. A) Type IIa myofiber CSA trends for a significant reduction in the stapled TA of the hydrogel control group but is maintained with pericyte transplantation. B) The paired limb difference between groups is significantly different for Type IIa myofibers. C) Type IIx fiber size is not significantly decreased with IM nor affected by transplantation. D) The magnitude of the paired limb difference is not different between groups. E) A significant reduction in Type IIb fiber size is observed between limbs of the hydrogel control group. F) No significant difference is present in the paired limb difference between groups. G) Representative cross section images of Type IIa (green), Type IIb (blue), and Dystrophin (red) myofibers. H) Representative cross section image of Type IIx (green) and dystrophin (red) myofibers. Images in G and H are presented at an original magnification value of ×20 (scale bars, 20 μm). *P < 0.05, difference between Stapled and Mobile (with paired t test). Data are means ± sem (n = 4–6). #P < 0.05, paired difference between Hydrogel and Pericyte (with independent samples t test).
Figure 5
Figure 5
Pericyte transplantation improves skeletal muscle capillarization following IM. A) Representative cross section images of capillaries (CD31), collagen type 1, and immune cells (CD11b+). Merged images at original magnification value of ×20. B) C/F ratio is significantly reduced in the stapled muscle of the hydrogel control group. Pericyte transplantation leads to a recovery of the C/F ratio. C) The paired limb difference between Hydrogel and Pericyte groups are significantly different. D) Capillary density is significantly increased in the immobilized TA with pericyte transplantation. E) The paired limb difference demonstrates a significant increase in capillary density in the pericyte group. F, G) Collagen type I content is not altered by RE or pericyte transplantation. B, D, F) Connected circles represent the immobilized and contralateral limbs from an individual sample. *P < 0.05, difference between Stapled and Mobile (with paired t test). Data are means ± sem (n = 5–6). #P < 0.05, paired difference between Hydrogel and Pericyte (with independent samples t test).
Figure 6
Figure 6
NG2+ and CD146+ pericyte localization in muscle is divergent following transplantation. A) Cross section image of DAPI (blue), ZsGreen (green), Laminin α-2 (red), and merged image illustrating localization of transplanted NG2+Lin pericytes following RE. B) Cross section image of DAPI (blue), DsRed (red), Laminin α-2 (green), and merged image illustrating localization of transplanted CD146+Lin pericytes following RE. A, B) Images at ×20 magnification value; scale bars, 20 μm.

References

    1. Bodine S. C. (2013) Disuse-induced muscle wasting. Int. J. Biochem. Cell Biol. 45, 2200–2208 - PMC - PubMed
    1. Brooks N. E., Myburgh K. H. (2014) Skeletal muscle wasting with disuse atrophy is multi-dimensional: the response and interaction of myonuclei, satellite cells and signaling pathways. Front. Physiol. 5, 99 - PMC - PubMed
    1. Dirks M. L., Wall B. T., Nilwik R., Weerts D. H., Verdijk L. B., van Loon L. J. (2014) Skeletal muscle disuse atrophy is not attenuated by dietary protein supplementation in healthy older men. J. Nutr. 144, 1196–1203 - PubMed
    1. Hvid L. G., Suetta C., Aagaard P., Kjaer M., Frandsen U., Ørtenblad N. (2013) Four days of muscle disuse impairs single fiber contractile function in young and old healthy men. Exp. Gerontol. 48, 154–161 - PubMed
    1. Wall B. T., Snijders T., Senden J. M., Ottenbros C. L., Gijsen A. P., Verdijk L. B., van Loon L. J. (2013) Disuse impairs the muscle protein synthetic response to protein ingestion in healthy men. J. Clin. Endocrinol. Metab. 98, 4872–4881 - PubMed

Publication types