

Latent Representation Learning for Alzheimer's Disease Diagnosis With Incomplete Multi-Modality Neuroimaging and Genetic Data
- PMID: 31021792
- PMCID: PMC8034601
- DOI: 10.1109/TMI.2019.2913158
Latent Representation Learning for Alzheimer's Disease Diagnosis With Incomplete Multi-Modality Neuroimaging and Genetic Data
Abstract
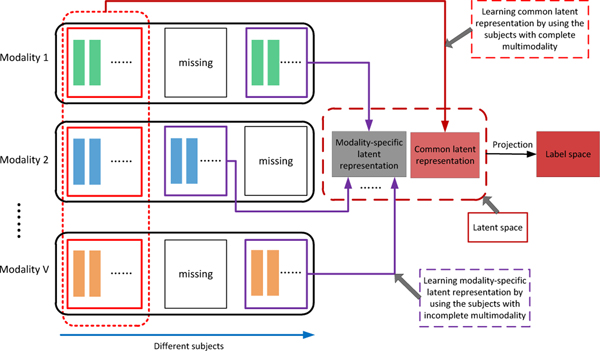
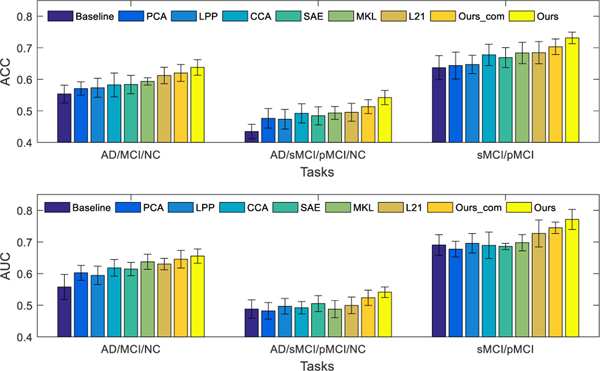
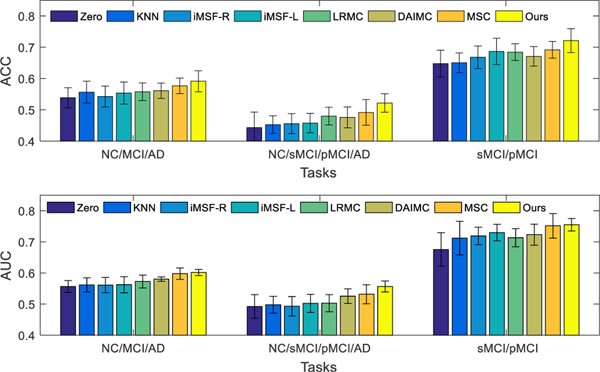
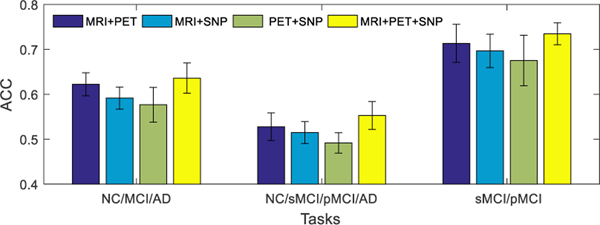
The fusion of complementary information contained in multi-modality data [e.g., magnetic resonance imaging (MRI), positron emission tomography (PET), and genetic data] has advanced the progress of automated Alzheimer's disease (AD) diagnosis. However, multi-modality based AD diagnostic models are often hindered by the missing data, i.e., not all the subjects have complete multi-modality data. One simple solution used by many previous studies is to discard samples with missing modalities. However, this significantly reduces the number of training samples, thus leading to a sub-optimal classification model. Furthermore, when building the classification model, most existing methods simply concatenate features from different modalities into a single feature vector without considering their underlying associations. As features from different modalities are often closely related (e.g., MRI and PET features are extracted from the same brain region), utilizing their inter-modality associations may improve the robustness of the diagnostic model. To this end, we propose a novel latent representation learning method for multi-modality based AD diagnosis. Specifically, we use all the available samples (including samples with incomplete modality data) to learn a latent representation space. Within this space, we not only use samples with complete multi-modality data to learn a common latent representation, but also use samples with incomplete multi-modality data to learn independent modality-specific latent representations. We then project the latent representations to the label space for AD diagnosis. We perform experiments using 737 subjects from the Alzheimer's Disease Neuroimaging Initiative (ADNI) database, and the experimental results verify the effectiveness of our proposed method.
Figures
Similar articles
-
Multi-modal latent space inducing ensemble SVM classifier for early dementia diagnosis with neuroimaging data.Med Image Anal. 2020 Feb;60:101630. doi: 10.1016/j.media.2019.101630. Epub 2019 Dec 28. Med Image Anal. 2020. PMID: 31927474 Free PMC article.
-
Label-aligned multi-task feature learning for multimodal classification of Alzheimer's disease and mild cognitive impairment.Brain Imaging Behav. 2016 Dec;10(4):1148-1159. doi: 10.1007/s11682-015-9480-7. Brain Imaging Behav. 2016. PMID: 26572145 Free PMC article.
-
Latent feature representation learning for Alzheimer's disease classification.Comput Biol Med. 2022 Nov;150:106116. doi: 10.1016/j.compbiomed.2022.106116. Epub 2022 Sep 21. Comput Biol Med. 2022. PMID: 36215848
-
Deep learning to detect Alzheimer's disease from neuroimaging: A systematic literature review.Comput Methods Programs Biomed. 2020 Apr;187:105242. doi: 10.1016/j.cmpb.2019.105242. Epub 2019 Nov 27. Comput Methods Programs Biomed. 2020. PMID: 31837630
-
Bi-level multi-source learning for heterogeneous block-wise missing data.Neuroimage. 2014 Nov 15;102 Pt 1:192-206. doi: 10.1016/j.neuroimage.2013.08.015. Epub 2013 Aug 27. Neuroimage. 2014. PMID: 23988272 Free PMC article. Review.
Cited by
-
[An MRI multi-sequence feature imputation and fusion mutual-aid model based on sequence deletion for differentiation of high-grade from low-grade glioma].Nan Fang Yi Ke Da Xue Xue Bao. 2024 Aug 20;44(8):1561-1570. doi: 10.12122/j.issn.1673-4254.2024.08.15. Nan Fang Yi Ke Da Xue Xue Bao. 2024. PMID: 39276052 Free PMC article. Chinese.
-
Multi-modal latent space inducing ensemble SVM classifier for early dementia diagnosis with neuroimaging data.Med Image Anal. 2020 Feb;60:101630. doi: 10.1016/j.media.2019.101630. Epub 2019 Dec 28. Med Image Anal. 2020. PMID: 31927474 Free PMC article.
-
Identifying subgroups of eating behavior traits unrelated to obesity using functional connectivity and feature representation learning.Hum Brain Mapp. 2024 Jan;45(1):e26581. doi: 10.1002/hbm.26581. Hum Brain Mapp. 2024. PMID: 38224537 Free PMC article.
-
Transfer learning for establishment of recognition of COVID-19 on CT imaging using small-sized training datasets.Knowl Based Syst. 2021 Apr 22;218:106849. doi: 10.1016/j.knosys.2021.106849. Epub 2021 Feb 6. Knowl Based Syst. 2021. PMID: 33584016 Free PMC article.
-
An FDG-PET-Based Machine Learning Framework to Support Neurologic Decision-Making in Alzheimer Disease and Related Disorders.Neurology. 2025 Jul 22;105(2):e213831. doi: 10.1212/WNL.0000000000213831. Epub 2025 Jun 27. Neurology. 2025. PMID: 40577677
References
-
- Alzheimer’s Association, “2013 Alzheimer’s disease facts and figures,” Alzheimer’s & dementia, vol. 9, no. 2, pp. 208–245, 2013. - PubMed
-
- Pennanen C, Kivipelto M, Tuomainen S, Hartikainen P, Ha nninen T¨, Laakso MP, Hallikainen M, Vanhanen M, Nissinen A, and Helkala E-L, “Hippocampus and entorhinal cortex in mild cognitive impairment and early AD,” Neurobiol. Aging, vol. 25, no. 3, pp. 303–310, 2004. - PubMed
Publication types
MeSH terms
Grants and funding
LinkOut - more resources
Full Text Sources
Other Literature Sources
Medical
Research Materials
