. 2019 Apr 25;17(4):e3000244.
doi: 10.1371/journal.pbio.3000244. eCollection 2019 Apr.

Genome-wide sexually antagonistic variants reveal long-standing constraints on sexual dimorphism in fruit flies

Affiliations

Genome-wide sexually antagonistic variants reveal long-standing constraints on sexual dimorphism in fruit flies

Filip Ruzicka et al. PLoS Biol. .

Abstract

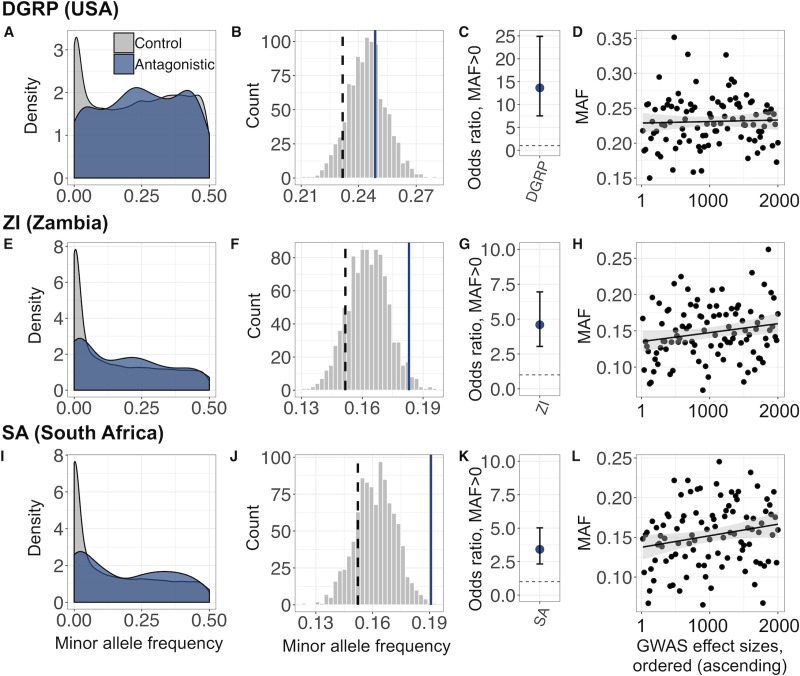
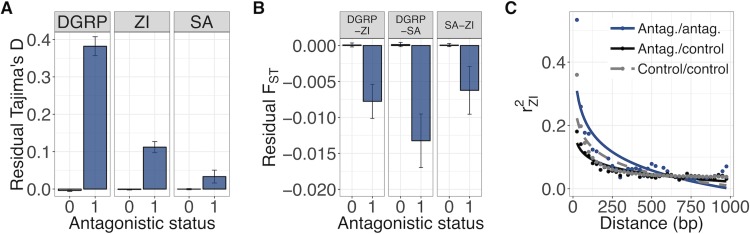
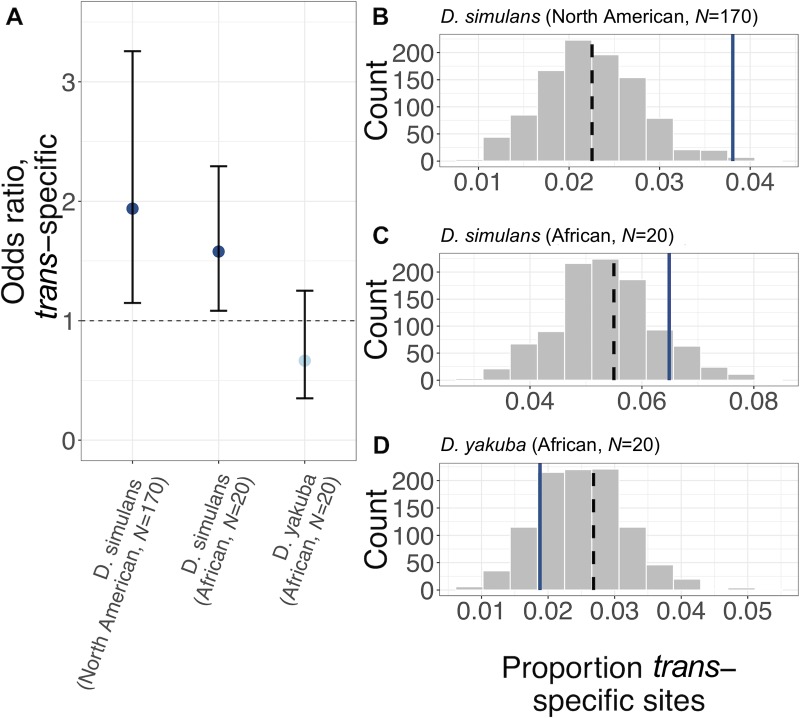
The evolution of sexual dimorphism is constrained by a shared genome, leading to 'sexual antagonism', in which different alleles at given loci are favoured by selection in males and females. Despite its wide taxonomic incidence, we know little about the identity, genomic location, and evolutionary dynamics of antagonistic genetic variants. To address these deficits, we use sex-specific fitness data from 202 fully sequenced hemiclonal Drosophila melanogaster fly lines to perform a genome-wide association study (GWAS) of sexual antagonism. We identify approximately 230 chromosomal clusters of candidate antagonistic single nucleotide polymorphisms (SNPs). In contradiction to classic theory, we find no clear evidence that the X chromosome is a hot spot for sexually antagonistic variation. Characterising antagonistic SNPs functionally, we find a large excess of missense variants but little enrichment in terms of gene function. We also assess the evolutionary persistence of antagonistic variants by examining extant polymorphism in wild D. melanogaster populations and closely related species. Remarkably, antagonistic variants are associated with multiple signatures of balancing selection across the D. melanogaster distribution range and in their sister species D. simulans, indicating widespread and evolutionarily persistent (about 1 million years) genomic constraints on the evolution of sexual dimorphism. Based on our results, we propose that antagonistic variation accumulates because of constraints on the resolution of sexual conflict over protein coding sequences, thus contributing to the long-term maintenance of heritable fitness variation.


Conflict of interest statement

The authors have declared that no competing interests exist.

Figures

Fig 1
Fig 1. Genome-wide association mapping of sexual antagonism.
(A) Relative male and female lifetime reproductive fitness estimates for 223 D. melanogaster hemiclonal lines. Fitness measures have been normalised, scaled, and centred (see Materials and methods). Colours denote each line’s antagonism index, i.e., their position along a spectrum (dashed arrow) ranging from male-beneficial, female-detrimental fitness effects (blue) to female-beneficial, male-detrimental effects (red). (B) Association of each SNP with the antagonism index along the five major D. melanogaster chromosome arms, presented as a Manhattan plot in which each point represents the −log10(P) value from a Wald χ2association test. Colours denote chromosome arms; the horizontal line represents the Q-value cutoff (0.3) used to define candidate antagonistic SNPs. Data and code underlying this figure can be found at https://doi.org/10.5281/zenodo.2623225. SNP, single nucleotide polymorphism.
Fig 2
Fig 2. Genomic distribution and functional characteristics of antagonistic variants.
(A) Relative contribution of different chromosomal compartments to total SNP heritability of the antagonistic index (i.e., hSNP2 estimated for a given compartment divided by total hSNP2 across all compartments). Dots represent estimated hSNP2 contributions (±95% CI), with expected hSNP2 contributions presented as black crosses. (B) Relative contribution of different functional categories to total antagonistic hSNP2 (i.e., hSNP2 estimated for a given functional category divided by total hSNP2 across all categories). Dots represent estimated hSNP2 contributions, with expected hSNP2 contributions presented as black crosses (±95% CI of the empirical null distribution computed through permutation; see Materials and methods). Colours indicate significant under- or overrepresentation (dark blue: P < 0.05; light blue: P > 0.05). Data and code underlying this figure can be found at https://doi.org/10.5281/zenodo.2623225. SNP, single nucleotide polymorphism; UTR, untranslated region.
Fig 3
Fig 3. Sex-biased gene expression among antagonistic genes.
(A) Distributions of the absolute degree of sex-biased expression for antagonistic (blue) and nonantagonistic (grey) genes. (B) Proportion of genes that are antagonistic across bins of expression sex bias (100 genes per bin). Points represent mean expression level in each bin. Blue curve (±SE) shows the best-fit quadratic model for the relationship between antagonism and expression sex bias. Data and code underlying this figure can be found at https://doi.org/10.5281/zenodo.2623225. F, female; M, male.
Fig 4
Fig 4. SNP-based signatures of balancing selection associated with antagonistic variants in three independent populations (DGRP, ZI, and SA).
(A,E,I) Spectra of raw MAF for LD-independent antagonistic (blue) and nonantagonistic (‘Control’, grey) SNPs. (B,F,J) Distribution of mean MAFs for 1,000 sets of LD-independent nonantagonistic SNPs that have been frequency matched and linked-selection matched to LHM antagonistic SNPs (‘Analysis A’; see Materials and methods). Blue line denotes mean MAF of antagonistic SNPs; black dashed line denotes mean MAF of nonantagonistic SNPs without matching for LHM MAF or linked selection. (C,G,K) Odds ratio (±95% CI) that a site is polymorphic (i.e., has the same alleles as in LHM and has MAF >0) as a function of its absolute GWAS effect size (regression coefficient), while controlling for LHM MAF and genome-wide linked selection (‘Analysis B’; see Materials and methods). An odds ratio >1 (dashed horizontal line) indicates that sites with higher absolute effect sizes are more likely to be polymorphic in a given population. Of the LD-independent sites considered, the number and percentage of sites with MAF > 0 were N = 31,092 (91.3%), N = 25,578 (77.3%), and N = 21,659 (68.7%) in the DGRP, ZI, and SA populations, respectively. (D,H,L) Mean MAF across 100 sets of LD-independent SNPs, presented in ascending order by absolute GWAS effect size (‘Analysis C’; see Materials and methods). Each set of LD-independent SNPs has been matched for LHM MAF and genome-wide estimates of linked selection. For visualisation purposes, a linear regression line (±95% CI) is shown. Data and code underlying this figure can be found at https://doi.org/10.5281/zenodo.2623225. DGRP, Drosophila Genetic Reference Panel; GWAS, genome-wide association study; LD, linkage disequilibrium; MAF, minor allele frequency; SA, South Africa; SNP, single nucleotide polymorphism; ZI, Zambia.
Fig 5
Fig 5. Regional and LD-based signatures of balancing selection associated with antagonistic variants in three independent populations (DGRP, ZI, and SA).
(A) Mean (±SE) residual Tajima’s D (i.e., the residuals of a regression of Tajima’s D on genome-wide estimates of linked selection) for antagonistic windows (blue; ‘antagonistic status = 1’) and nonantagonistic windows (grey; ‘antagonistic status = 0’). (B) Mean (±SE) residual FST (i.e., the residuals of a regression of FST on genome-wide estimates of linked selection) for antagonistic and nonantagonistic windows. Because these are residuals of a regression, residual FST does not vary between 0 and 1. (C) LD (r2) in the ZI population between pairs of antagonistic SNPs (blue, ‘Antag./antag.’), pairs of nonantagonistic SNPs (grey, ‘Control/control’), and mixed pairs (black, ‘Antag./control’). Points represent mean r2 across 25-bp bins; r2 is modelled as a declining exponential function of distance (fitted lines). Data and code underlying this figure can be found at https://doi.org/10.5281/zenodo.2623225. Antag., antagonistic; DGRP, Drosophila Genetic Reference Panel; LD, linkage disequilibrium; SA, South Africa; SNP, single nucleotide polymorphism; ZI, Zambia.
Fig 6
Fig 6. Signatures of balancing selection associated with antagonistic variants in two sister species, D. simulans and D. yakuba.
(A) Odds ratio (±95% CI) that a polymorphism’s trans-specific status varies with absolute GWAS effect size (regression coefficient), controlling for LHM MAF and genome-wide linked selection (see Materials and methods). An odds ratio >1 indicates that sites with higher effect sizes are more likely to be trans-specific. The relationship between trans-specific status and effect size is presented for three datasets: a panel of 170 North American D. simulans genomes (left), 20 African D. simulans genomes (middle), and 20 African D. yakuba genomes (right). Colours indicate significant under- or overrepresentation (dark blue: P < 0.05; light blue: P > 0.05). Of the LD-independent sites considered in each sample, the number and percentage of trans-specific sites were N = 3,608 (2.2%), N = 7,466 (5.5%) in the 170- and 20-genome D. simulans datasets, respectively, and N = 2,760 (2.7%) in the D. yakuba dataset. (B) Histogram of the proportion of trans-specific polymorphisms for 1,000 sets of LD-pruned nonantagonistic SNPs that have been frequency and linked-selection matched to antagonistic SNPs. Blue line denotes mean proportion of trans-specific antagonistic SNPs; black dashed line denotes mean proportion of trans-specific nonantagonistic SNPs without any correction for LHM MAF or linked selection. Trans-specific status was determined by considering polymorphism data from a panel of 170 North American D. simulans genomes. (C) Same as B, with trans-specific status derived from polymorphism data from a panel of 20 African D. simulans genomes. (D) Same as B., with trans-specific status derived from polymorphism data from a panel of 20 African D. yakuba genomes. Data and code underlying this figure can be found at https://doi.org/10.5281/zenodo.2623225. GWAS, genome-wide association study; LD, linkage disequilibrium; MAF, minor allele frequency; SNP, single nucleotide polymorphism.

References

    1. Bonduriansky R, Chenoweth SF. Intralocus sexual conflict. Trends Ecol Evol. 2009;24:280–8. 10.1016/j.tree.2008.12.005 - DOI - PubMed
    1. Van Doorn GS. Intralocus sexual conflict. Ann N Y Acad Sci. 2009;1168:52–71. 10.1111/j.1749-6632.2009.04573.x - DOI - PubMed
    1. Rice WR. Sex chromosomes and the evolution of sexual dimorphism. Evolution. 1984;38:735–742. 10.1111/j.1558-5646.1984.tb00346.x - DOI - PubMed
    1. Cox RM, Calsbeek R. Sexually antagonistic selection, sexual dimorphism, and the resolution of intralocus sexual conflict. Am Nat. 2009;173:176–87. 10.1086/595841 - DOI - PubMed
    1. Pennell TM, Morrow EH. Two sexes, one genome: The evolutionary dynamics of intralocus sexual conflict. Ecol Evol. 2013;3:1819–34. 10.1002/ece3.540 - DOI - PMC - PubMed

Publication types