. 2019 Apr 25;14(4):e0215277.
doi: 10.1371/journal.pone.0215277. eCollection 2019.

Necrosis, apoptosis, necroptosis, three modes of action of dopaminergic neuron neurotoxins

Affiliations

Necrosis, apoptosis, necroptosis, three modes of action of dopaminergic neuron neurotoxins

Noëlle Callizot et al. PLoS One. .

Abstract

Most of the Parkinson's disease (PD) cases are sporadic, although several genes are directly related to PD. Several pathways are central in PD pathogenesis: protein aggregation linked to proteasomal impairments, mitochondrial dysfunctions and impairment in dopamine (DA) release. Here we studied the close crossing of mitochondrial dysfunction and aggregation of α-synuclein (α-syn) and in the extension in the dopaminergic neuronal death. Here, using rat primary cultures of mesencephalic neurons, we induced the mitochondrial impairments using "DA-toxins" (MPP+, 6OHDA, rotenone). We showed that the DA-Toxins induced dopaminergic cell death through different pathways: caspase-dependent cell death for 6OHDA; MPP+ stimulated caspase-independent cell death, and rotenone activated both pathways. In addition, a decrease in energy production and/or a development of oxidative stress were observed and were linked to α-syn aggregation with generation of Lewy body-like inclusions (found inside and outside the dopaminergic neurons). We demonstrated that any of induced mitochondrial disturbances and processes of death led to α-syn protein aggregation and finally to cell death. Our study depicts the cell death mechanisms taking place in in vitro models of Parkinson's disease and how mitochondrial dysfunctions is at the cross road of the pathologies of this disease.


Conflict of interest statement

This study was funded by internal funds of Neuro-Sys SAS. NC, MC, and AH are emplyees of this funder. PP is a member of its scientific board. This does not alter the authors' adherence to PLOS ONE policies on sharing data and materials.

Figures

Fig 1
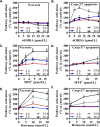
Fig 1. Effect of the different doses of DA-toxins on TH-expressing neurons and cell viability.
Survival of TH expressing neurons after application of 6OHDA (A), MPP+ (B) and Rotenone (C) was studied after 24 hours and 48 hours. 100% = 61.2 +/- 1. Cell viability in a total mesencephalic culture after application of 6OHDA (D), MPP+ (E) and rotenone (F). All values were expressed as mean +/- SEM; n = 6/group; *, p<0,05 with One-way ANOVA followed by Dunnett’s test.
Fig 2
Fig 2. Effect of the different doses of DA-toxins on necrosis and apoptosis.
Cell deaths in a total mesencephalic culture induced by 6OHDA (A, B), MPP+ (C, D) or rotenone (E, F) is shown. Value of 1 corresponds to the mean intensity of luminescence or fluorescence in the vehicle condition. All values were expressed as mean +/- SEM; n = 6/group; *, p<0,05 with One-way ANOVA followed by Dunnett’s test.
Fig 3
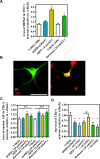
Fig 3. Caspase 3 and cytochrome C in dopaminergic neurons upon DA-toxins application.
(A) Quantification of mesencephalic neurons positive for TH and caspase 3 staining. (B) Representative pictures of TH neurons, negative (left panel) and positive (right panel) for cleaved caspase 3. (C) Quantification of mesencephalic neurons positive for TH and cytochrome C staining. (D) Representative pictures of TH neurons, negative (left panel) and positive (right panel) for cytochrome C. Value of 1 is equivalent to 8 +/- 0,4 neurons (A) or to 5 +/- 0,4 neurons (C). All values were expressed as mean +/- SEM; n = 6/group; *, p<0,05 with One-way ANOVA followed by Dunnett’s test.
Fig 4
Fig 4. Effect of the DA-toxins on necroptosis pathway.
(A and B) AIF staining in TH expressing neurons and representative pictures. (B). Survival of TH expressing neurons upon intoxication and treatment with AG14361 (1μmol/L), an inhibitor of PARP1. The value of 1 correspond to 9 +/- 0.6 neurons (AIF and TH neurons) or 15 +/- 0.6 neurons (TH neurons). All values were expressed as mean +/- SEM; n = 6/group; *, p<0,05 with One-way ANOVA followed by Dunnett’s test.
Fig 5
Fig 5. Mitochondrial pathology after DA-toxins application.
Level of ATP normalized by cell viability (A) and oxidative stress (B-C) were determined at different time points. Representative pictures are showing TH expressing neurons with low level of ROS (left panel) or high level of ROS (right panel). A value of 1 corresponds to the mean intensity of luminescence in the vehicle condition (ATP) or to 5 +/- 1 neurons (ROS). All values were expressed as mean +/- SEM; n = 6/group; *, p<0,05 with One-way ANOVA followed by Dunnett’s test.
Fig 6
Fig 6. Alpha-synucleinopathy in dopaminergic neurons after exposure to 6OHDA, MPP+ or rotenone.
(A). Upper panel: Representative picture of aggregated α-syn (in green) inside TH-expressing neurons (in red) (white arrows) after double-immunofluorescence microscopy, obtained with an antibody anti-aggregated α-syn (scale bar 100 μm). Lower panel: Representative picture of phase contrast microscopy reveals intracellular Lewy body-like structures (scale bar 100 μm). (B, C). Representative picture of α-syn, obtained with an antibody anti-α-syn and the area of α-syn staining overlapping with TH staining, corrected by the number of TH neurons, after an injury with 6OHDA (48 h), MPP+ (48 h) or rotenone (24 h). A value at 1 is equivalent to 7,1 +/- 0,38 neurons. (D). Representative pictures of LC3 staining (red) in TH expressing neurons (green) and the segmentation resulting from data processing (white). Arrow: TH neurons; star: non TH neuron showing LC3 staining. Data processing removed background signal to consider only dot structures in TH expressing neurons. (E). LC3 staining in dopaminergic neurons in presence of the toxins. A value at 1 is equivalent to 1.7 +/- 0,2 neurons. All values were expressed as mean +/- SEM; n = 6/group; *, p<0,05 with One-way ANOVA followed by Dunnett’s test.
Fig 7
Fig 7. Schematic representation of the pathological events induced by the DA-toxins.

References

    1. Martin I, Dawson VL, Dawson TM. The impact of genetic research on our understanding of Parkinson’s disease. Prog Brain Res. 2010;183: 21–41. 10.1016/S0079-6123(10)83002-X - DOI - PMC - PubMed
    1. Jankovic J. Parkinson’s disease: clinical features and diagnosis. J Neurol Neurosurg Psychiatry. 2008;79: 368–376. 10.1136/jnnp.2007.131045 - DOI - PubMed
    1. Gasser T. Genomic and proteomic biomarkers for Parkinson disease. Neurology. 2009;72: S27–31. 10.1212/WNL.0b013e318198e054 - DOI - PubMed
    1. Hardy J, Lewis P, Revesz T, Lees A, Paisan-Ruiz C. The genetics of Parkinson’s syndromes: a critical review. Curr Opin Genet Dev. 2009;19: 254–265. 10.1016/j.gde.2009.03.008 - DOI - PubMed
    1. Thomas B, Beal MF. Parkinson’s disease. Hum Mol Genet. 2007;16 Spec No. 2: R183–194. 10.1093/hmg/ddm159 - DOI - PubMed

Publication types

MeSH terms