. 2019 Apr 25;14(4):e0216094.
doi: 10.1371/journal.pone.0216094. eCollection 2019.

HMGB proteins are required for sexual development in Aspergillus nidulans

Affiliations

HMGB proteins are required for sexual development in Aspergillus nidulans

Eszter Bokor et al. PLoS One. .

Abstract

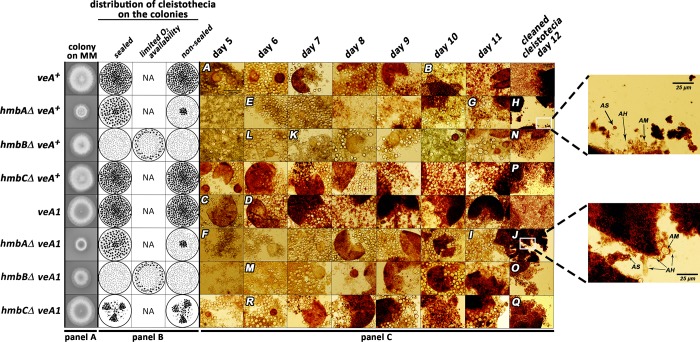
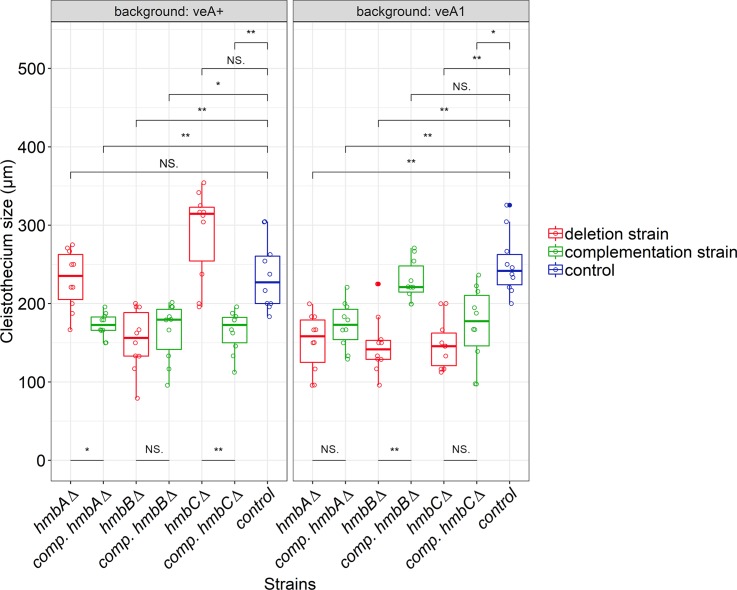
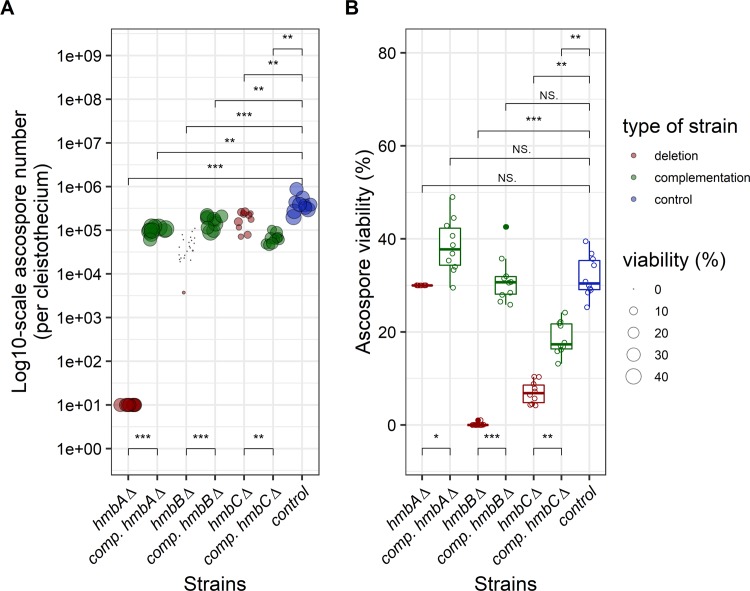
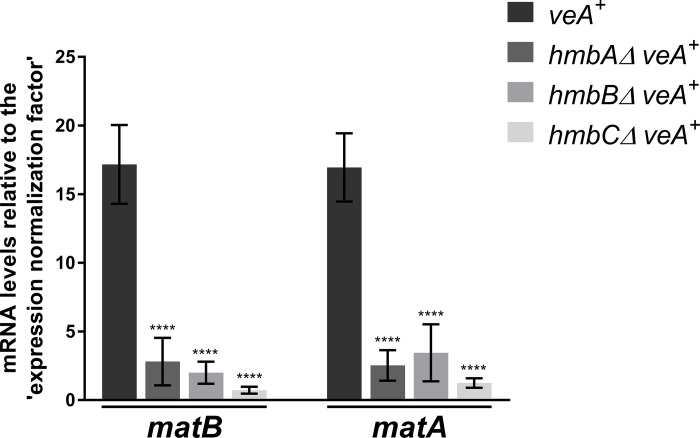
Aspergillus nidulans has three high mobility group box (HMGB) proteins, HmbA, HmbB and HmbC that are chromatin-associated architectural proteins involved in DNA-related functions. By creating and studying deletion strains in both veA+ and veA1 background, we have characterized the role of HmbA, HmbB and HmbC in sexual development. Expression of the mating-type MAT1-1 and MAT1-2 coding genes were found to be extremely down-regulated in all three mutants on day 4 of sexual development, which results in deficient ascospore production and/or ascospore viability in the mutants. In addition, we found that HmbA and HmbB play also a role in sensing of and response to environmental signals, while HmbC functionally interacts with VeA, a key regulator of the coordination of asexual and sexual development, as well as of secondary metabolism.


Conflict of interest statement

The authors have declared that no competing interests exist.

Figures

Fig 1
Fig 1. Documentation of sexual structures formed during the course of sexual development in control and hmbA, hmbB and hmbC deletion strains.
Panel A: Growth ability of veA+ and veA1 controls and the hmbAΔ, hmbBΔ and hmbCΔ strains in both veA+ and veA1 background. The strains were incubated on CM for 2 days at 37°C prior documentation. Strains used: veA+ control (HZS.450), veA1 control (HZS.145), hmbAΔ veA+ (HZS.521), hmbAΔ veA1 (HZS.239), hmbBΔ veA+ (HZS.495), hmbBΔ veA1 (HZS.280), hmbCΔ veA+ (HZS.531), hmbCΔ veA1 (HZS.338). The complete genotypes are listed in S2 Table. Panel B: Schematic representation of oxygen regulated distribution pattern of cleistothecia in control and hmbAΔ, hmbBΔ and hmbCΔ strains. “Sealed” and “non-sealed” refer to conditions where plates are sealed with scotch tape or kept without sealing, respectively. “Limited oxygen availability” refers to the non-sealed condition with the applied medium almost entirely filling up the Petri dish. Small-sized grey dots mark micro-sized cleistothecia, black dots indicate normal-sized cleistothecia. Panel C: Time course of sexual structure formation in control and hmbA, hmbB and hmbC deletion strains. Selfing was done on CM at 37°C in complete darkness. In the case of hmbBΔ strains (both veA+ and veA1) the plates remained non-sealed and the medium almost entirely filled up the Petri dish. The rest of the selfing plates were sealed by scotch tape. Samples from the areas showing sexual development were taken each day from day 5 until day 11, and were studied without purification by using microscope. Cleistothecia collected from day 12 were purified on a sterile agar plate prior to mounting. Letters A-R correspond to images with landmark structures discussed in the Results section. Images A, E, F, K, L, M and R show primordia, image C shows μ-cleistothecium, images B, D, G, H, I, J, N, O, P and Q show cleistothecia with mature ascospores. These sexual structures can also be observed in the non-marked images. Images were taken by an Olympus BX51 microscope. The 100 μm scale bar shown on image A refers to all images except those in the day 12 column and magnifications of selected area on images I and K. The strains used in the experiment are the same as those listed in Panel A.
Fig 2
Fig 2. Size of cleistothecia in hmbAΔ, hmbBΔ and hmbCΔ mutants in veA+ and veA1 genetic backgrounds.
The boxplot shows the size of cleistothecia across the hmbA, hmbB and hmbC mutant and control strains in both the veA+ (left panel) and the veA1 (right panel) genetic backgrounds. The strains are color-coded as follows: blue denotes control; red denotes deletion, green denotes complementation (comp.) strains originating from the corresponding deletion strains. Centre lines indicate the median of 10 independent cleistothecia measurements per strain. Mann-Whitney U-test was used to assess size differences between the mutant and control strains in the corresponding genetic background. */** indicates p < 0.01/0.001, NS indicates p = not significant. Cleistothecia sizes were estimated by measuring the diameter of cleistothecia with a ruler (for further details see S4 Fig). The strains used in the experiment are as follows: veA+ control (HZS.450), veA1 control (HZS.145), hmbAΔ veA+ (HZS.521), hmbAΔ veA1 (HZS.239), hmbAΔ veA+ with hmbA complementation (HZS.678), hmbAΔ veA1 with hmbA complementation (HZS.621), hmbBΔ veA+ (HZS.495), hmbBΔ veA1 (HZS.280), hmbBΔ veA+ with hmbB complementation (HZS.680), hmbBΔ veA1 with hmbB complementation (HZS.677), hmbCΔ veA+ (HZS.531), hmbCΔ veA1 (HZS.338), hmbCΔ veA+ with hmbC complementation (HZS.679), hmbCΔ veA1 with hmbC complementation (HZS.676).
Fig 3
Fig 3. Production and viability of ascospores produced by hmbAΔ, hmbBΔ and hmbCΔ mutants in veA+ genetic background.
Panel A: Graphical representation of the number of ascospores per cleistothecium. The figure shows the number of ascospores (on log10-scale) per cleistothecium across the hmbA, hmbB and hmbC mutant and control strains in a veA+ genetic background. The strains are color-coded as follows: blue denotes control; red denotes deletion, green denotes complementation (comp.) strains originating from the corresponding deletion strains. The bubbles mark the number of ascospores; the size of the bubbles is proportional to the viability of the corresponding ascospores. An estimated rate of germination was used as a proxy of viability in the case of hmbAΔ (explained in the main text). The number of ascospores were estimated based on 10 independent cleistothecia per strain. An estimated ascospore number was used in the case of hmbAΔ (explained in the main text). Mann-Whitney U-test was used to assess the differences between the numbers of ascospores of the mutant and the control strains. */**/*** indicates p < 0.01/0.001/0.0001. Panel B: Graphical representation of the viability of ascospores. The boxplot shows the viability of the ascospores across the hmbA, hmbB and hmbC mutant and control strains in a veA+ genetic background. Viability was calculated by counting the number of colony-forming ascospores on solid medium. An estimated rate of germination was used as a proxy of viability in the case of hmbAΔ (explained in the main text). The strains are color-coded as follows: blue denotes control; red denotes deletion, green denotes complementation (comp.) strains originating from the corresponding deletion strains. Centre lines indicate the median viability of ascospores collected from 10 independent cleistothecia per strain. Mann-Whitney U-test was used to assess size differences between the mutant strains and the control in the corresponding genetic background. */**/*** indicates p < 0.01/0.001/0.0001, ns indicates p = not significant. The strains used in the experiment are as follows: veA+ control (HZS.450), hmbAΔ veA+ (HZS.521), hmbAΔ veA+ with hmbA complementation (HZS.678), hmbBΔ veA+ (HZS.495), hmbBΔ veA+ with hmbB complementation (HZS.680), hmbCΔ veA+ (HZS.531), hmbCΔ veA+ with hmbC complementation (HZS.679).
Fig 4
Fig 4. mRNA levels measured by qRT-PCR for MAT1-1 coding matB and MAT1-2 coding matA genes in veA+ control and veA+ hmbAΔ, hmbBΔ and hmbCΔ strains 96 h after the induction of sexual development.
Results, obtained by calculations according to the standard curve method [47], were normalized to an ‘expression normalization factor’ calculated from two selected reference genes (tubC and gpdA) (detailed in S1 Materials and methods). Standard deviations of three technical replicates of three biological samples are shown. The stars above the columns indicate the significance of the differences compared to the veA+ control. Significant differences between the mutants and the control were determined by using a two-way ANOVA test. **** indicates p < 0.0001. The following strains were used in the experiment: veA+ (HZS.450), hmbAΔ veA+ (HZS.521), hmbBΔ veA+ (HZS.495) and hmbCΔ veA+ (HZS.531). The cultivation settings were as follows: approximately 106 conidiospores per strain were inoculated into liquid MM, and were grown for 24 hours at 37°C with 180 rpm shaking. Then the vegetatively grown mycelia were transferred onto solid MM covered with cellophane, sealed carefully with scotch tape and incubated for 96 hours at 37°C in complete darkness. After the incubation period, total RNA was extracted and processed.

Similar articles

Cited by

References

    1. Bustin M. Revised nomenclature for high mobility group (HMG) chromosomal proteins. Trends in biochemical sciences. 2001;26(3):152–3. Epub 2001/03/14. S0968-0004(00)01777-1 [pii]. . - PubMed
    1. Bustin M, Reeves R. High-mobility-group chromosomal proteins: architectural components that facilitate chromatin function. Prog Nucleic Acid Res Mol Biol. 1996;54:35–100. Epub 1996/01/01. . - PubMed
    1. Malarkey CS, Churchill ME. The high mobility group box: the ultimate utility player of a cell. Trends in biochemical sciences. 2012;37(12):553–62. 10.1016/j.tibs.2012.09.003 . - DOI - PMC - PubMed
    1. Thomas JO, Travers AA. HMG1 and 2, and related 'architectural' DNA-binding proteins. Trends in biochemical sciences. 2001;26(3):167–74. Epub 2001/03/14. S0968-0004(01)01801-1 [pii]. . - PubMed
    1. Bianchi ME, Agresti A. HMG proteins: dynamic players in gene regulation and differentiation. Current opinion in genetics & development. 2005;15(5):496–506. 10.1016/j.gde.2005.08.007 . - DOI - PubMed

Publication types

MeSH terms