

Assessing Spatial Concordance Between Theranostic Pairs Using Phantom and Patient-Specific Acceptance Criteria: Application to 99mTc-MAA SPECT/90Y-Microsphere PET
- PMID: 31022511
- PMCID: PMC8011284
- DOI: 10.1016/j.ijrobp.2019.04.012
Assessing Spatial Concordance Between Theranostic Pairs Using Phantom and Patient-Specific Acceptance Criteria: Application to 99mTc-MAA SPECT/90Y-Microsphere PET
Abstract
Purpose: Predictive 3-dimensional dosimetry requires spatial concordance between diagnostic and therapeutic activity distributions. We assess similarity between theranostic pairs (99mTc-macroaggregated albumin [MAA] single photon emission computed tomography [SPECT] and 90Y microsphere positron emission tomography [PET]) in patients using criteria that account for spatial resolution differences and misregistration.
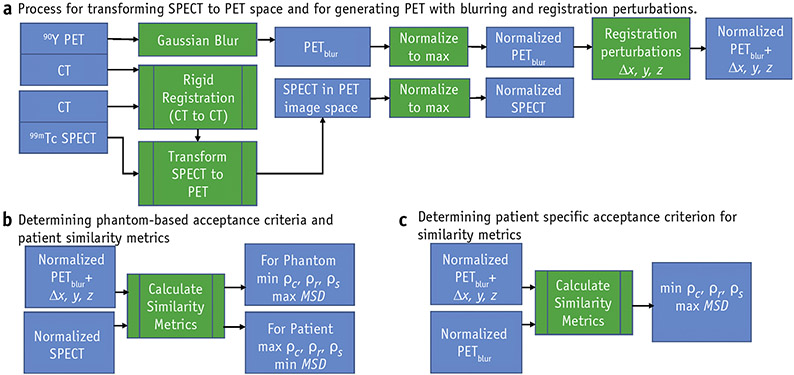
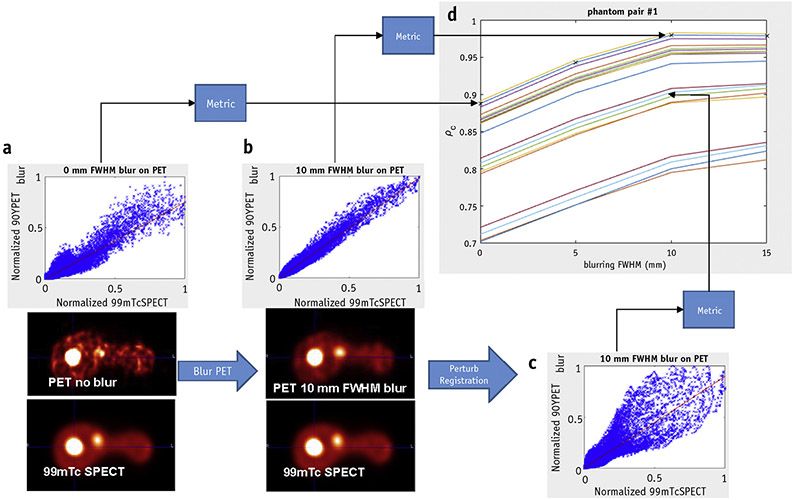
Methods and materials: Phantom-based acceptance criteria were determined using a liver phantom filled with 99mTc and 90YCl3 and scanned with SPECT/computed tomography [CT] and PET/CT, respectively. Gaussian blurring was applied to PET to match 99mTc phantom scan image quality. After rigid registration between SPECT/CT and PET/CT, perturbations up to ±3 voxels were applied to determine the similarity metric (SM) sensitivity. 99mTc-MAA SPECT/CT and 90Y microsphere PET/CT image pairs/patients (n = 23) were processed analogously. SMs calculated included the Pearson correlation coefficient (ρr), Lin's concordance correlation coefficient (ρc), Spearman's rank correlation coefficient (ρs), the mean squared difference, and the Dice similarity coefficient (DSC). Patient-specific acceptance criteria were determined by evaluating the SMs of the blurred PET compared with itself misregistered.
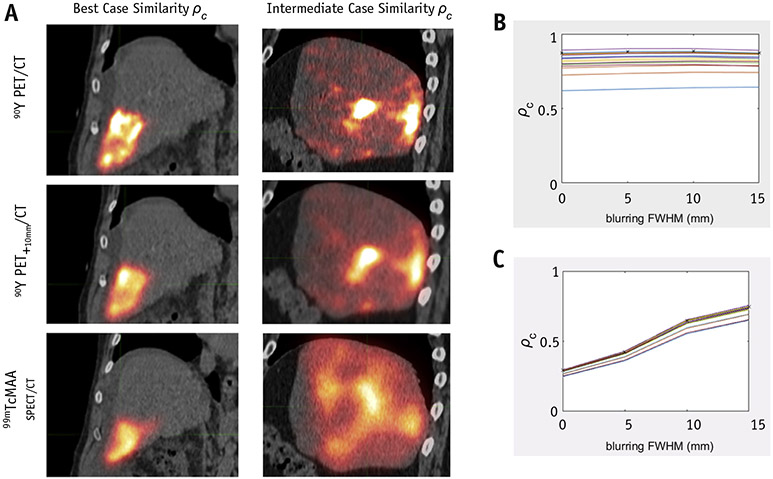
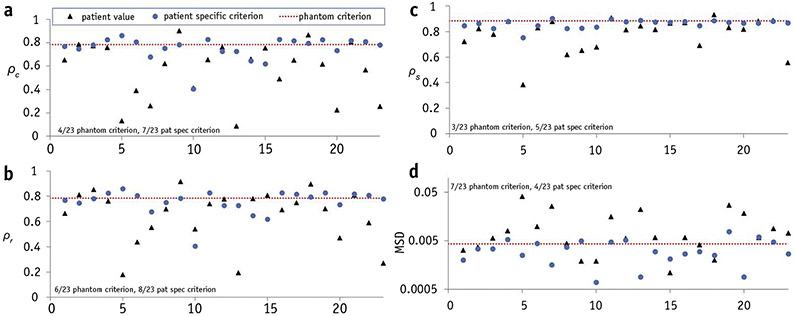
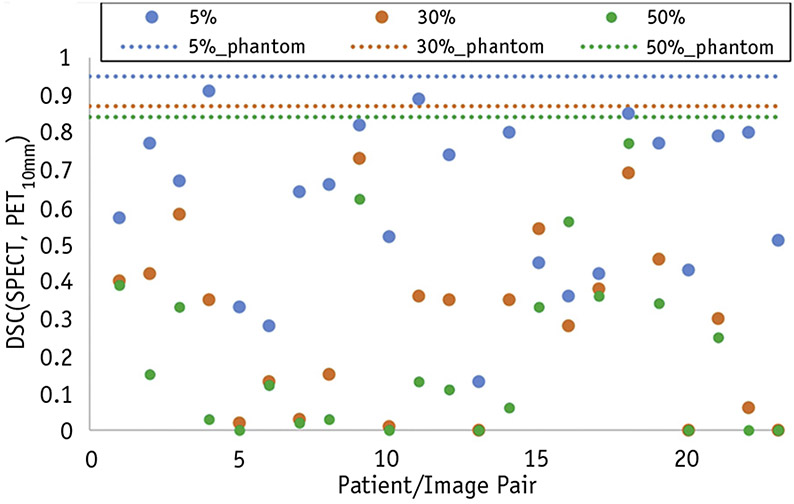
Results: After transforming PET to SPECT resolution, high similarity was found in phantom, with ρc, ρr, ρs > 0.98 ± 0.01, a mean squared difference of (4.1 ± 0.3) × 10-4 and DSC > 0.85 ± 0.01 for investigated thresholds (5%, 30%, and 50%). SMs for patients varied from poor to good. A small percentage (13%-30%) of patient scans were acceptable using phantom-based acceptance criteria. The percentage increased slightly (17%-35%) using patient-specific acceptance criteria. DSC for most patients were substantially lower (average 0.95 vs 0.61 for 5% threshold) than phantom values.
Conclusions: At best, 35% of patients had an SM within the acceptance criteria established to account for imaging-related effects impacting spatial concordance between 99mTc-MAA SPECT and 90Y PET. Additional clinical factors should be evaluated in the future. The procedure of accounting for image-related effects when assessing spatial concordance can be applied to other theranostic pairs.
Copyright © 2019. Published by Elsevier Inc.
Figures
Similar articles
-
99mTc-macroaggregated albumin SPECT/CT predictive dosimetry and dose-response relationship in uveal melanoma liver metastases treated with first-line selective internal radiation therapy.Sci Rep. 2023 Aug 12;13(1):13118. doi: 10.1038/s41598-023-39994-7. Sci Rep. 2023. PMID: 37573346 Free PMC article.
-
PET/CT-Based Dosimetry in 90Y-Microsphere Selective Internal Radiation Therapy: Single Cohort Comparison With Pretreatment Planning on (99m)Tc-MAA Imaging and Correlation With Treatment Efficacy.Medicine (Baltimore). 2015 Jun;94(23):e945. doi: 10.1097/MD.0000000000000945. Medicine (Baltimore). 2015. PMID: 26061323 Free PMC article.
-
Correlation of Technetium-99m Macroaggregated Albumin and Yttrium-90 Glass Microsphere Biodistribution in Hepatocellular Carcinoma: A Retrospective Review of Pretreatment Single Photon Emission CT and Posttreatment Positron Emission Tomography/CT.J Vasc Interv Radiol. 2017 May;28(5):722-730.e1. doi: 10.1016/j.jvir.2016.12.1221. Epub 2017 Feb 24. J Vasc Interv Radiol. 2017. PMID: 28238581
-
Clinical impact of (99m)Tc-MAA SPECT/CT-based dosimetry in the radioembolization of liver malignancies with (90)Y-loaded microspheres.Eur J Nucl Med Mol Imaging. 2016 Mar;43(3):559-75. doi: 10.1007/s00259-015-3157-8. Epub 2015 Sep 4. Eur J Nucl Med Mol Imaging. 2016. PMID: 26338177 Free PMC article. Review.
-
90Y-Loaded Microsphere SIRT of HCC Patients With Portal Vein Thrombosis: High Clinical Impact of 99mTc-MAA SPECT/CT-Based Dosimetry.Semin Nucl Med. 2019 May;49(3):218-226. doi: 10.1053/j.semnuclmed.2019.01.006. Epub 2019 Feb 7. Semin Nucl Med. 2019. PMID: 30954188 Review.
Cited by
-
Impact of contouring methods on pre-treatment and post-treatment dosimetry for the prediction of tumor control and survival in HCC patients treated with selective internal radiation therapy.EJNMMI Res. 2021 Mar 9;11(1):24. doi: 10.1186/s13550-021-00766-x. EJNMMI Res. 2021. PMID: 33687596 Free PMC article.
-
Prediction of Tumor Control in 90Y Radioembolization by Logit Models with PET/CT-Based Dose Metrics.J Nucl Med. 2020 Jan;61(1):104-111. doi: 10.2967/jnumed.119.226472. Epub 2019 May 30. J Nucl Med. 2020. PMID: 31147404 Free PMC article.
-
Stereotactic body radiation therapy (SBRT) following Yttrium-90 (90Y) selective internal radiation therapy (SIRT): a feasibility planning study using90Y delivered dose.Phys Med Biol. 2023 Mar 10;68(6):065003. doi: 10.1088/1361-6560/acbbb5. Phys Med Biol. 2023. PMID: 36780696 Free PMC article.
-
Comparison of 90Y SIRT predicted and delivered absorbed doses using a PSF conversion method.Phys Med. 2021 Sep;89:1-10. doi: 10.1016/j.ejmp.2021.07.026. Epub 2021 Jul 30. Phys Med. 2021. PMID: 34339928 Free PMC article.
References
-
- Salem R, Thurston KG. Radioembolization with yttrium-90 microspheres: A state-of-the-art brachytherapy treatment for primary and secondary liver malignancies: Part 3: Comprehensive literature review and future direction. J Vasc Interv Radiol 2006;17:1571–1593. - PubMed
-
- Chiesa C, Maccauro M, Romito R, et al. Need, feasibility and convenience of dosimetric treatment planning in liver selective internal radiation therapy with (90)Y microspheres: The experience of the National Tumor Institute of Milan. Q J Nucl Med Mol Imaging 2011; 55:168–197. - PubMed
-
- Chiesa C, Mira M, Maccauro M, et al. Radioembolization of hep-atocarcinoma with (90)Y glass microspheres: Development of an individualized treatment planning strategy based on dosimetry and radiobiology. Eur J Nucl Med Mol Imaging 2015;42:1–21. - PubMed
Publication types
MeSH terms
Substances
Grants and funding
LinkOut - more resources
Full Text Sources
