. 2019 Jun:24:101194.
doi: 10.1016/j.redox.2019.101194. Epub 2019 Apr 14.

Limitations to adaptive homeostasis in an hyperoxia-induced model of accelerated ageing

Affiliations

Limitations to adaptive homeostasis in an hyperoxia-induced model of accelerated ageing

Laura C D Pomatto et al. Redox Biol. 2019 Jun.

Abstract

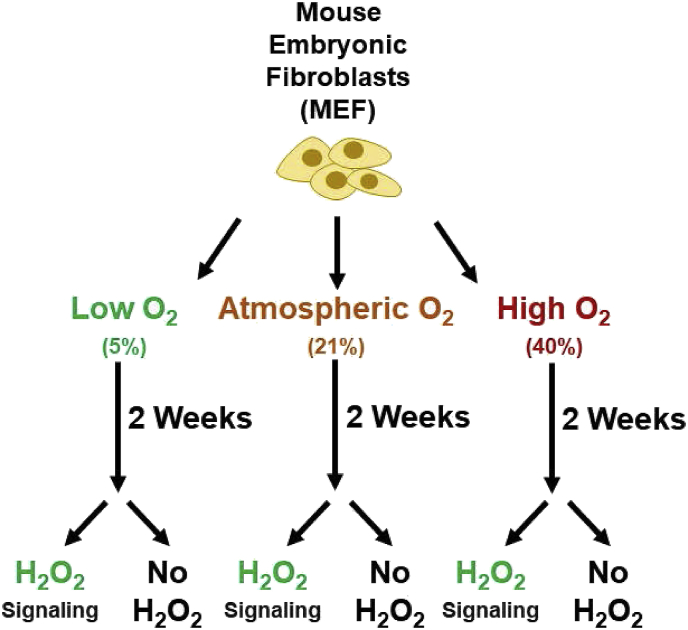
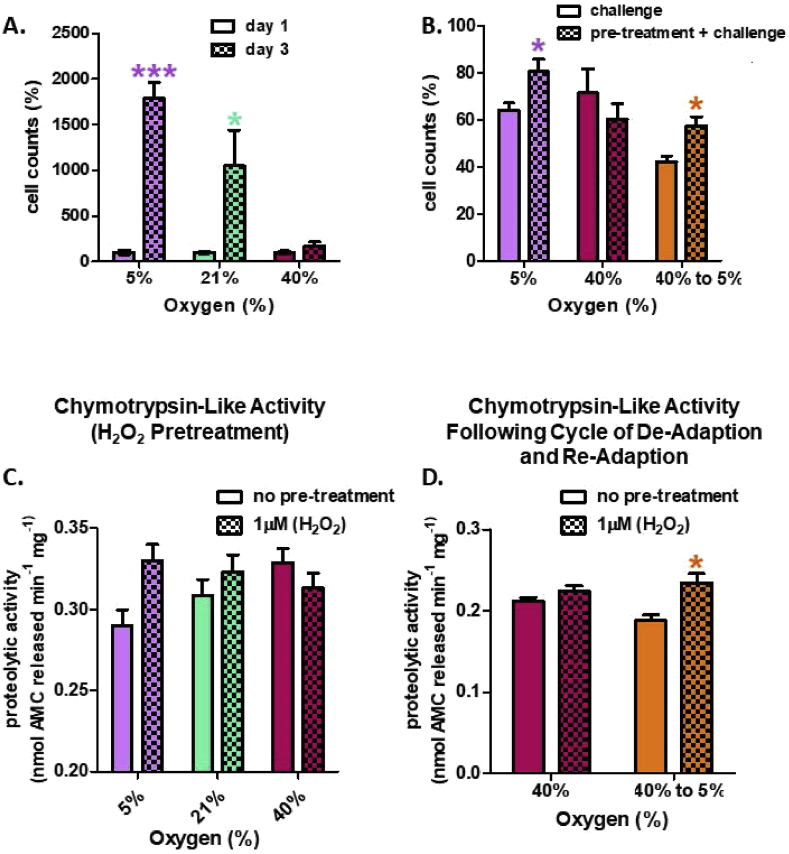
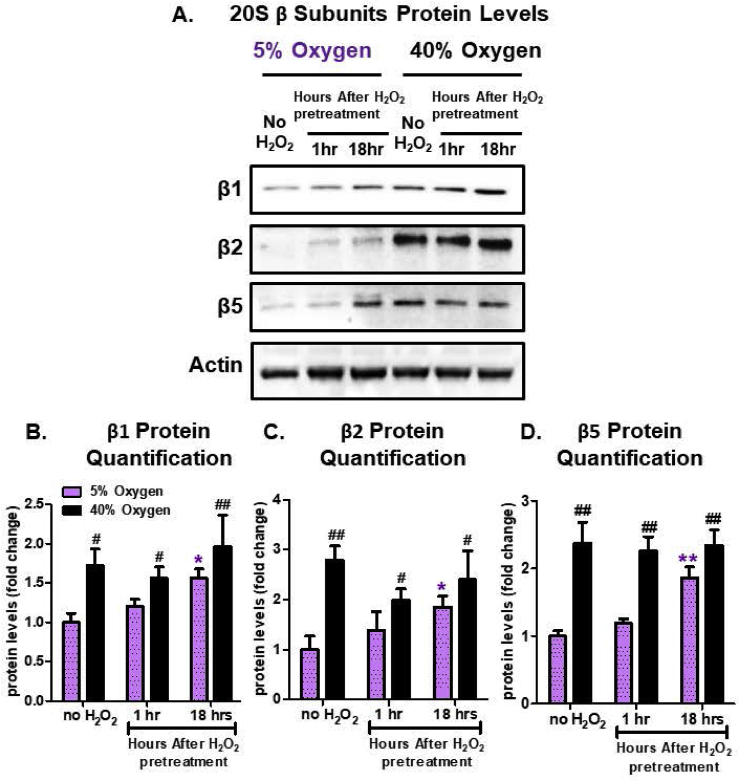
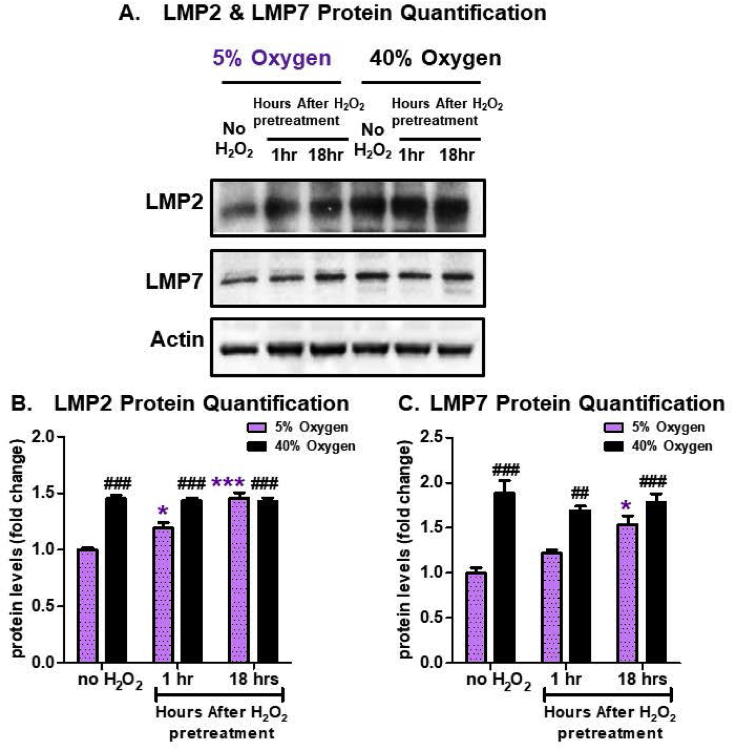
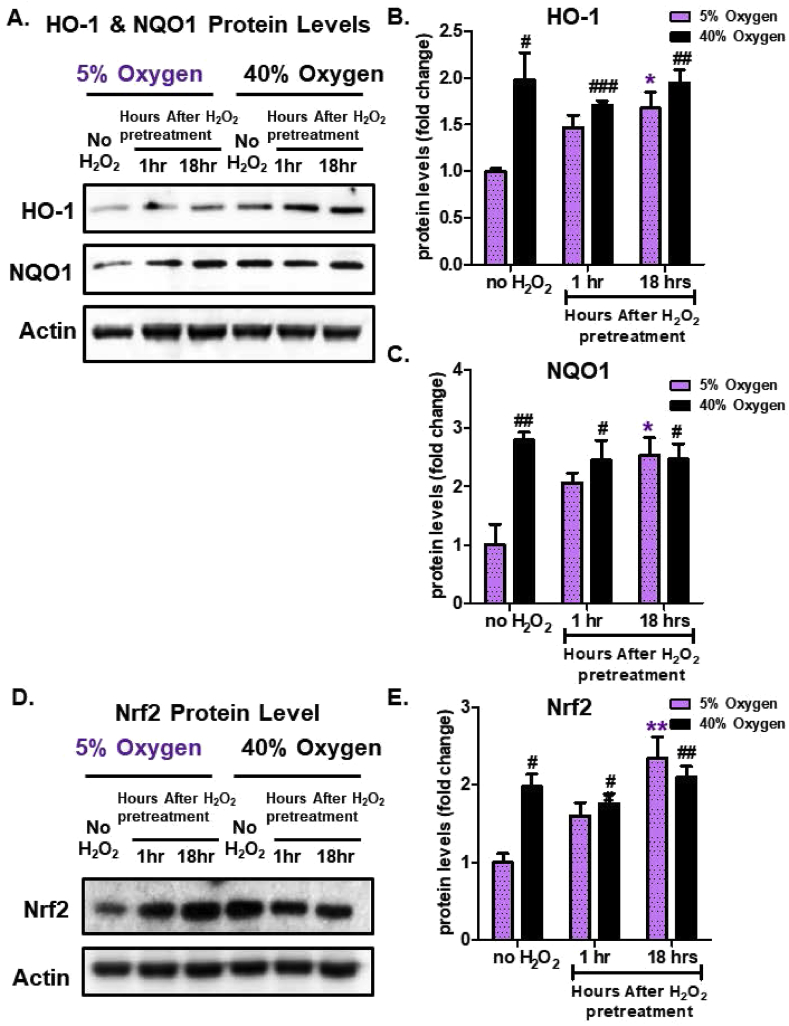
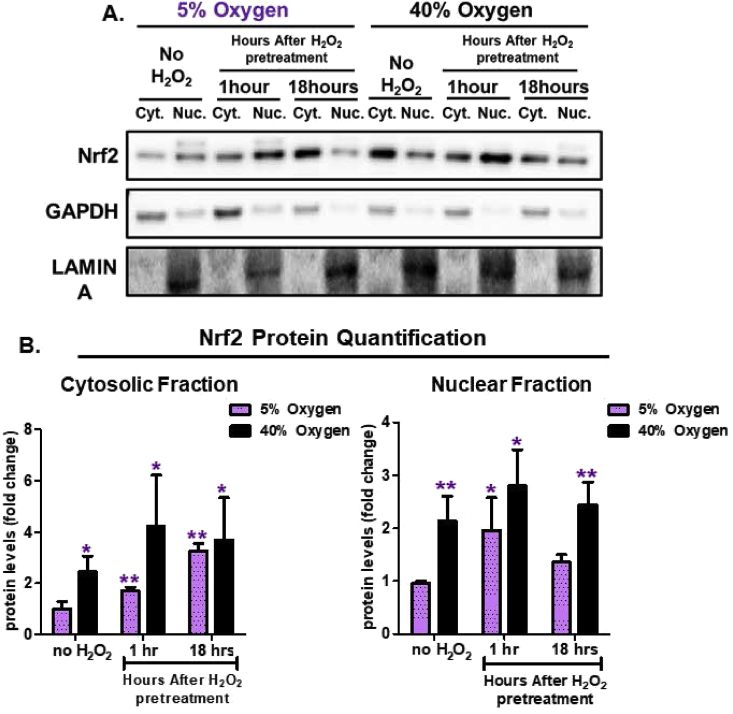
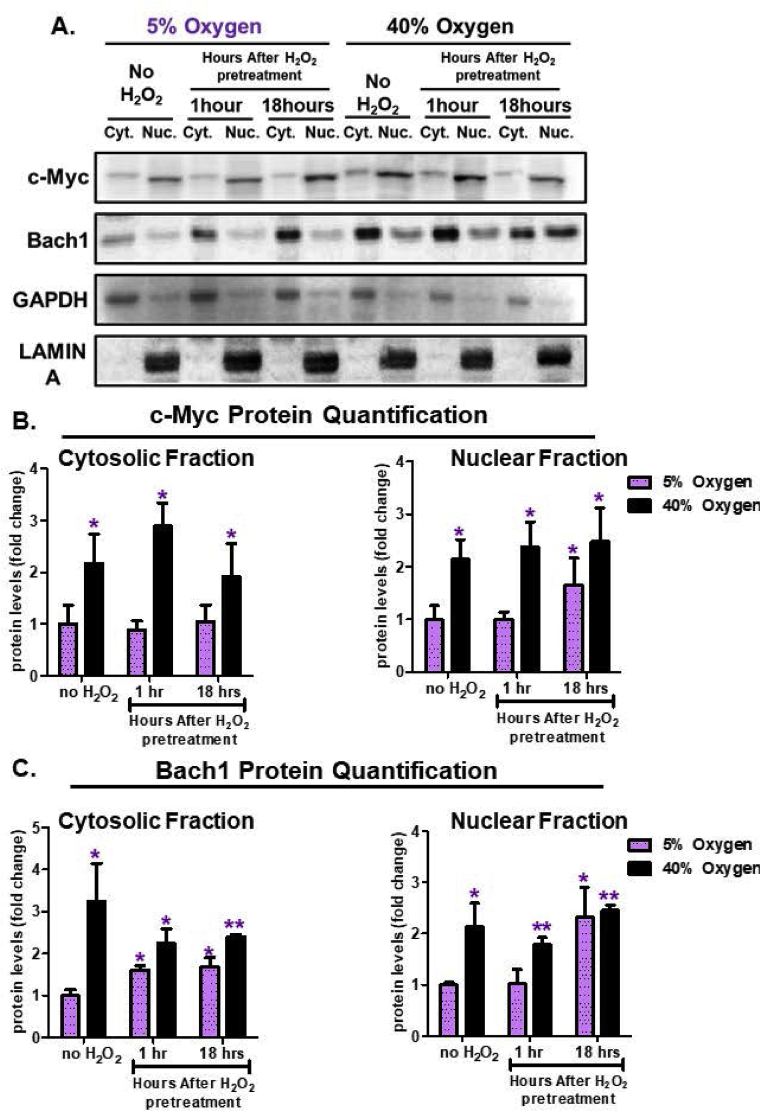
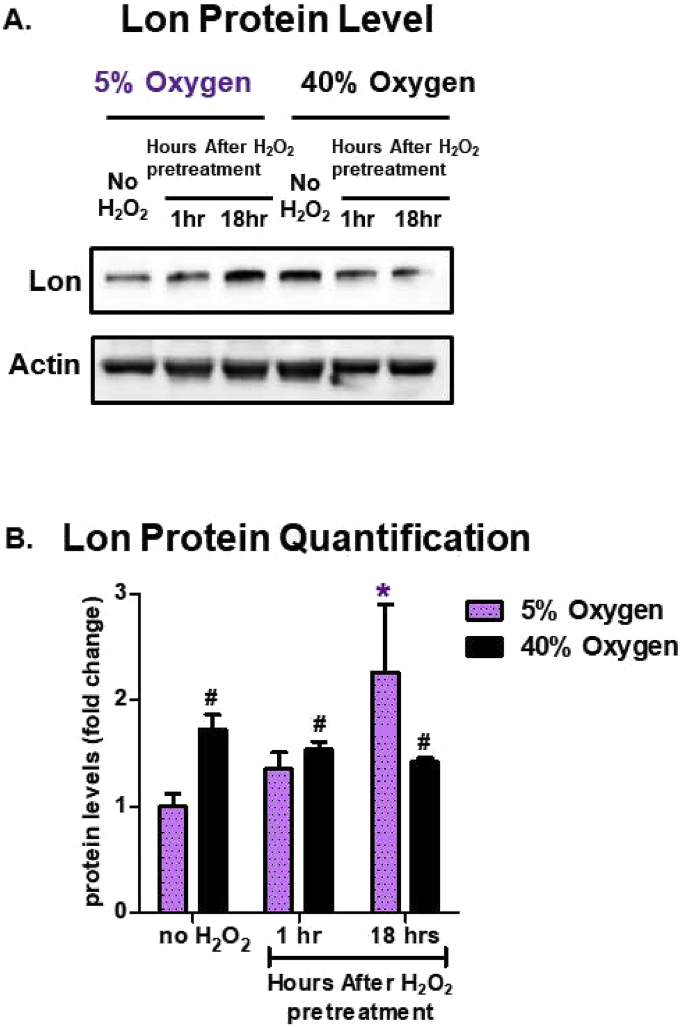
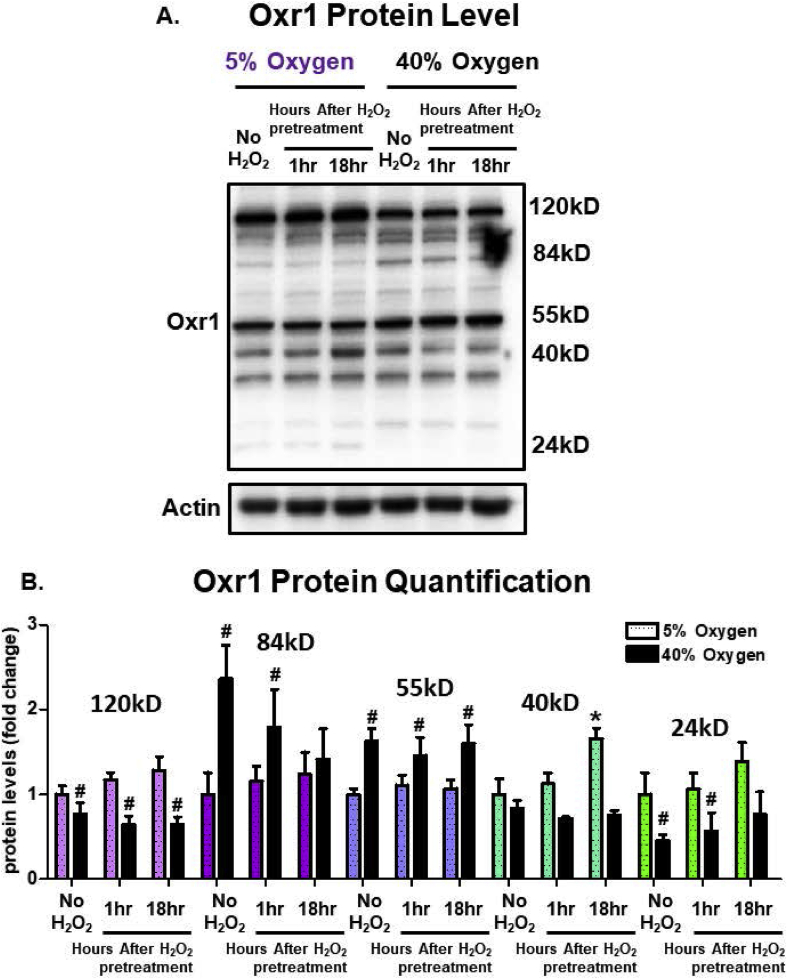
The Nrf2 signal transduction pathway plays a major role in adaptive responses to oxidative stress and in maintaining adaptive homeostasis, yet Nrf2 signaling undergoes a significant age-dependent decline that is still poorly understood. We used mouse embryonic fibroblasts (MEFs) cultured under hyperoxic conditions of 40% O2, as a model of accelerated ageing. Hyperoxia increased baseline levels of Nrf2 and multiple transcriptional targets (20S Proteasome, Immunoproteasome, Lon protease, NQO1, and HO-1), but resulted in loss of cellular ability to adapt to signaling levels (1.0 μM) of H2O2. In contrast, MEFs cultured at physiologically relevant conditions of 5% O2 exhibited a transient induction of Nrf2 Phase II target genes and stress-protective enzymes (the Lon protease and OXR1) following H2O2 treatment. Importantly, all of these effects have been seen in older cells and organisms. Levels of Two major Nrf2 inhibitors, Bach1 and c-Myc, were strongly elevated by hyperoxia and appeared to exert a ceiling on Nrf2 signaling. Bach1 and c-Myc also increase during ageing and may thus be the mechanism by which adaptive homeostasis is compromised with age.

Keywords: 20S proteasome; Adaptive homeostasis; Bach1; Hyperoxia; Immunoproteasome; Lon protease; NQO1; Nrf2; OXR1; c-Myc.


Figures

Fig. 1
Fig. 1
Experimental Design. Mouse embryonic fibroblasts (MEF) cells were cultured at 5% (physiological), 21% (atmospheric), or 40% (hyperoxic) oxygen for 2 weeks prior to either being pre-treated with a signaling dose of 1.0 μM hydrogen peroxide (H2O2), or used as controls.
Fig. 2
Fig. 2
Cell Growth and Proteasomal Chymotrypsin-like Activity. (A) Growth rate is attenuated with increasing O2 culturing concentration. Cells were seeded at 1 × 105 in 6-well plates at either 5%, 21%, or 40% O2, with 3 replicates (n = 3) per oxygen concentration. After 3 days of incubation, cells were washed twice with PBS, detached with trypsin, and counted with a hemocytometer. (B) Pretreatment with 1.0 μM H2O2 (per 500,000 cells) results in a protective effect against a subsequent challenge dose of 3.0 mM H2O2 per 500,000 cells, in MEFs cultured at 5% O2 but not in MEFs cultured at 40% O2. Cells were either cultured at control conditions of 5% oxygen (5%), 40% oxygen for 2 weeks (40%), or cultured at 40% oxygen and then transferred back to 5% for 2 weeks to de-adapt the cell lines before assays. Cells were pre-exposed to 1.0 μM H2O2 (per 500,000 cells) in a final volume of 2.0 ml in 6 well plates, for 1 h, or used as controls, and then allowed to recover for 18 h before the challenge dose. The challenge dose was administered for 1 h and cells were allowed to recover for 24 h before cell counts were taken. (C) A signaling treatment of 1.0 μM H2O2 (per 500,000 cells) increases proteolytic capacity in MEF's cultured at 5% O2 but fails to increase proteolytic capacity in MEFs cultured at higher O2 concentrations. An oxidative signaling dose of 1.0 μM H2O2 was administered for 1 h and cells were allowed to recover for 18 h. (D) De-adaptation to hyperoxia allows restoration of H2O2 adaptive responses. Cells cultured at 40% O2 for 28 days were transferred back to 5% O2 for 21 days. Cells were either cultured in standard media or media with 1 μM H2O2 (final concentration) for 1 h and then harvested 18 h after. Chymotrypsin-like activity was measured. Data are expressed as means ± standard errors and statistically significant differences are indicated as * (p < 0.05), ** (p < 0.01), *** (p < 0.001).
Fig. 3
Fig. 3
Hyperoxia Increases 20S Proteasome Subunit Levels but Abrogates their Adaptive Responses to H2O2. MEF cells were chronically cultured at 5% or 40% prior to pretreatment. Cells were either pretreated with a non-damaging amount (1.0 μM) of H2O2 in a final volume of 2.0 ml in 6 well plates, for 1 h (or used as controls) and then allowed to recover for either 1 h or 18 h post treatment. All treatments were done in replicates of 6 (n = 6). (A) Amounts of the three proteolytic subunits of the 20S proteasome (β1, β2, β5) were assessed by Western blot and normalized to the actin loading control. MEF cells propagated at 5% showed increased amounts of the three subunits, following H2O2 pretreatment, whereas the MEF cells propagated at 40% showed increased baseline levels, but no further adaptive increase following H2O2 pretreatment. (B) Quantification of the amount of 20S β1 subunit. (C) Quantification of the amount of 20S β2 subunit. (B) Quantification of the amount of 20S β5 subunit. All data are expressed as means ± standard errors. Statistically significant differences in 5% O2 cultured cell lines to the 5% O2 control were indicated by * (p < 0.05), ** (p < 0.01), *** (p < 0.001). Statistically significant differences in the 40% O2 cultured cell line to the 5% O2 control were indicated by # (p < 0.05), ## (p < 0.01), ### (p < 0.001).
Fig. 4
Fig. 4
Hyperoxia Increases Immunoproteasome Proteasome Subunit Levels but Abrogates their Adaptive Responses to H2O2. MEF cells were chronically cultured at 5% or 40% prior to pretreatment. Cells were either not pretreated with H2O2 or pretreated with a non-damaging signaling amount (1.0 μM H2O2 in a final volume of 2.0 ml in 6 well plates) for 1 h and then allowed to recover for either 1 h or 18 h post treatment. All treatments were done in replicates of 6 (n = 6). (A) The levels of the two proteolytic subunits of the immunoproteasome (LMP2 and LMP7) were assessed by Western blot and normalized to the actin loading control. MEF cells propagated at 5% showed increased amounts of both subunits, following H2O2 pretreatment, whereas the MEF cells propagated at 40% exhibited increased baseline levels, but no further adaptive increase following H2O2 pretreatment. (B) Quantification of the amount of the Immunoproteasome LMP2 subunit. (C) Quantification of the amount of the Immunoproteasome LMP7 subunit. (B) Quantification of the amount of the 20S β5 subunit. All data are expressed as means ± standard errors. Statistically significant differences in 5% cultured cell lines to the 5% O2 control were indicated by * (p < 0.05), ** (p < 0.01), *** (p < 0.001). Statistically significant differences in the 40% O2 cultured cell line to the 5% O2 control were indicated by # (p < 0.05), ## (p < 0.01), ### (p < 0.001).
Fig. 5
Fig. 5
Hyperoxia Increases Nrf2, HO1, and NQO1 Levels but Abrogates their Adaptive Responses to H2O2. MEF cells were chronically cultured at 5% or 40% O2 prior to pretreatment. Cells were either pretreated with a 1.0 μM non-damaging, signaling level of H2O2 for 1 h in a final volume of 2.0 ml in 6 well plates, and then allowed to recover for either 1 h or 18 h post treatment, or were used as controls. All treatments were done in replicates of 6 (n = 6). (A) Western blot of HO-1 and NQO1, normalized to an actin loading control. (B) Quantification of the amount of HO-1. (C) Quantification of the amount of NQO1. (D) western blot of Nrf2, normalized to an actin loading control. (E) Quantification of the amount of Nrf2, normalized to an actin loading control. MEF cells propagated at 5% exhibited increased amounts of Nrf2 and Nrf2-regulated enzymes (HO-1 and NQO1), following 1.0 μM H2O2 pretreatment, whereas MEF cells propagated at 40% O2 had increased baseline Nrf2 levels, but showed no further increase following H2O2 pretreatment. All data are expressed as means ± standard errors. Statistically significant differences in 5% cultured cell lines to the 5% O2 control were indicated by * (p < 0.05), ** (p < 0.01), *** (p < 0.001). Statistically significant differences in the 40% O2 cultured cell line to the 5% O2 control were indicated by # (p < 0.05), ## (p < 0.01), ### (p < 0.001).
Fig. 6
Fig. 6
Nrf2 Nuclear Translocation is Dysregulated by Chronic Hyperoxia. MEF cells were cultured either at 5% or 40% oxygen prior to pretreatment. Cells were either not pretreated with H2O2 or pretreated with a non-damaging, signaling amount (1.0 μM H2O2 in a final volume of 2.0 ml in 6 well plates) for 1 h and then allowed to recover for either 1 h or 18 h post treatment. Both cytosolic and nuclear cell fractions were isolated. All treatments were done in replicates of 6 (n = 6). (A) Western blot of Nrf2 levels in cytosolic versus nuclear cell fractions at 1-h and 18-h after initial H2O2 pretreatment and normalized either to GAPDH (cytosolic fraction) or LAMIN (nuclear fraction) loading controls. (B) Quantification of Nrf2 levels within cytosolic and nuclear fractions normalized to loading controls. MEF cells cultured at 5%, showed an increasing accumulation of Nrf2, within the cytosolic fraction, at 1-h and 18-h post-pretreatment. In the nuclear fraction, Nrf2 accumulated at 1 h and then decreased back to baseline levels by 18 h after pretreatment. In contrast, MEF cells cultured at 40% oxygen, showed no change in Nrf2 accumulation following H2O2 pretreatment. All data are expressed as means ± standard errors and statistically significant differences were indicated by * (p < 0.05), ** (p < 0.01), *** (p < 0.001).
Fig. 7
Fig. 7
Bach1 and c-Myc Nuclear Translocation is Dysregulated by Chronic Hyperoxia. MEF cells were cultured either at 5% or 40% oxygen prior to pretreatment. Cells were either not pretreated with H2O2 or pretreated with a non-damaging, signaling level (1.0 μM H2O2 in a final volume of 2.0 ml in 6 well plates) for 1 h and then allowed to recover for either 1 h or 18 h post treatment. Cytosolic and nuclear fractions were isolated. All treatments were done in replicates of 6 (n = 6). (A) The levels of c-Myc and Bach1 were assessed by Western blot in the cytosolic versus nuclear fractions 1-h and 18-h after initial H2O2 pretreatment and normalized either to GAPDH (cytosolic fraction) or LAMIN (nuclear fraction) loading controls. (B) Quantification of c-Myc levels within cytosolic and nuclear fractions. MEF cells cultured at 5% oxygen, showed an increasing accumulation of c-Myc within the nuclear fraction by 18 h post-pretreatment, with no change in the cytosolic fraction. MEF cells cultured at 40% oxygen, showed increased baseline amounts of c-Myc in both nuclear and cytosolic fraction, but no adaptive accumulation in either fraction post-pretreatment. (C) Quantification of Bach1 levels within the cytosolic and nuclear fractions. MEF cells cultured at 5% oxygen, showed an increasing amount of Bach1 at 1 h and 18 h in the cytosolic fraction, whereas, Bach1 accumulated after 18 h post-pretreatment in the nuclear fraction. In contrast, MEF cells propagated at 40% oxygen showed a baseline increase in Bach1 levels in the cytosolic and nuclear fractions, but no difference in cells either not pretreated or pretreated with hydrogen peroxide. All data are expressed as means ± standard errors and Statistically significant differences were indicated by * (p < 0.05), ** (p < 0.01), *** (p < 0.001).
Fig. 8
Fig. 8
Hyperoxia Increases the Level of the Lon Protease but Abrogates its Adaptive Responses to H2O2. MEF cells were chronically cultured at 5% or 40% prior to pretreatment. Cells were either not pretreated with H2O2 or pretreated with a non-damaging, signaling amount (1 μM H2O2 in a final volume of 2.0 ml in 6 well plates) for 1 h and then allowed to recover for either 1 h or 18 h post treatment. All treatments were done in replicates of 6 (n = 6). (A) The amount of Lon protease protein was assessed by Western blot and normalized to an actin loading control. (B) Quantification of the amount of Lon protein. MEF cells cultured at 5% oxygen showed an increased amount of Lon 18 h after initial pretreatment. All data are expressed as means ± standard errors. Statistically significant differences in 5% cultured cell lines to the 5% O2 control were indicated by * (p < 0.05), ** (p < 0.01), *** (p < 0.001). Statistically significant differences in the 40% O2 cultured cell line to the 5% O2 control were indicated by # (p < 0.05), ## (p < 0.01), ### (p < 0.001).
Fig. 9
Fig. 9
Cytoplasmic and Mitochondrial Oxr1 Isoforms are Differentially Sensitive to Chronic High Oxygen Exposure. Mouse embryonic fibroblasts (MEF) cells were cultured either at 5% (low) or 40% (high) oxygen for 2 weeks prior to exposing cells to either no pretreatment, or pretreating them with a 1.0 μM non-damaging, signaling amount of hydrogen peroxide in a final volume of 2.0 ml in 6 well plates. Cell lysates were Western blotted and probed with an Oxr1 antibody. All treatments were done in replicates of 6 (n = 6). Culturing at 40% recruited 84kD and 55kD cytoplasmic Oxr1 isoforms and result in a decrease in the 120kD cytoplasmic isoform. The mitochondrial 40kD Oxr1 isoform was the only isoform responsive to an oxidative H2O2 signal following growth at 5% O2, while the 24kD mitochondrial isoform was the only one that was responsive to an oxidative H2O2 signal following growth at 40% O2. All data are expressed as means ± standard errors. Statistically significant differences in 5% cultured cell lines to the 5% O2 control were indicated by * (p < 0.05), ** (p < 0.01), *** (p < 0.001). Statistically significant differences in the 40% O2 cultured cell line to the 5% O2 control were indicated by # (p < 0.05), ## (p < 0.01), ### (p < 0.001).

References

    1. Davies K.J. Adaptive homeostasis. Mol. Aspect. Med. 2016;49:1–7. - PMC - PubMed
    1. Davies J.M., Lowry C.V., Davies K.J. Transient adaptation to oxidative stress in yeast. Arch. Biochem. Biophys. 1995;317(1):1–6. - PubMed
    1. Grune T., Reinheckel T., Davies K. Degradation of oxidized proteins in mammalian cells. FASEB J. 1997;11(7):526–534. - PubMed
    1. Grune T., Reinheckel T., Davies K.J. Degradation of oxidized proteins in K562 human hematopoietic cells by proteasome. J. Biol. Chem. 1996;271(26):15504–15509. - PubMed
    1. Grune T. Proteolysis in cultured liver epithelial cells during oxidative stress Role of the multicatalytic proteinase complex, proteasome. J. Biol. Chem. 1995;270(5):2344–2351. - PubMed

Publication types