Comparative Study
. 2019 Aug;36(8):495-518.
doi: 10.1002/yea.3395. Epub 2019 Jun 27.

Quantitative analysis of the yeast pheromone pathway

Affiliations
Comparative Study

Quantitative analysis of the yeast pheromone pathway

James P Shellhammer et al. Yeast. 2019 Aug.

Abstract

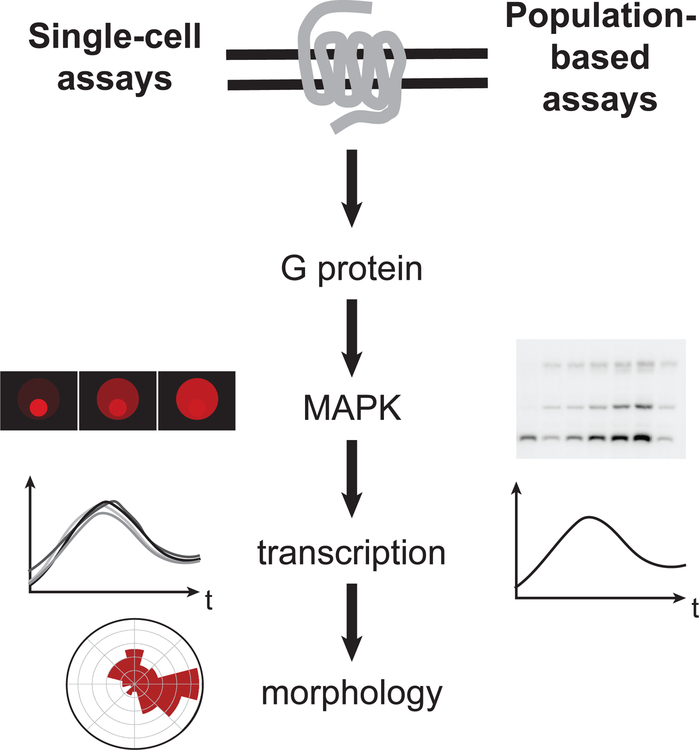
The pheromone response pathway of the yeast Saccharomyces cerevisiae is a well-established model for the study of G proteins and mitogen-activated protein kinase (MAPK) cascades. Our longstanding ability to combine sophisticated genetic approaches with established functional assays has provided a thorough understanding of signalling mechanisms and regulation. In this report, we compare new and established methods used to quantify pheromone-dependent MAPK phosphorylation, transcriptional induction, mating morphogenesis, and gradient tracking. These include both single-cell and population-based assays of activity. We describe several technical advances, provide example data for benchmark mutants, highlight important differences between newer and established methodologies, and compare the advantages and disadvantages of each as applied to the yeast model. Quantitative measurements of pathway activity have been used to develop mathematical models and reveal new regulatory mechanisms in yeast. It is our expectation that experimental and computational approaches developed in yeast may eventually be adapted to human systems biology and pharmacology.

Keywords: Saccharomyces cerevisiae; signal transduction; systems biology.


Conflict of interest statement

CONFLICT OF INTEREST STATEMENT

The authors declare that they have no conflict of interest.

Figures

Figure A1
Figure A1. Phosphorylation of Kss1 by conventional SDS-PAGE and immunoblotting with phospho-p44/42 antibodies.
Western blot analysis of (A) wild-type cells or (B) bar1Δ cells treated with 0.3 μM or 3 μM α -factor mating pheromone and probed with phospho-p44/42 and anti-Myc tag antibodies to identify Kss1. Phosphorylated Kss1 (p-Kss1, top graphs) and total Kss1 (t-Kss1, middle graphs) were plotted as % of maximum signal on the blot. The ratio of phosphorylated Kss1 to total Kss1 (bottom graphs) was calculated by dividing % phosphorylated Kss1 by % maximum total Kss1. Data are presented as mean ± standard deviation, N = 3.
Figure A2
Figure A2. Phosphorylation of Kss1-Myc by Phos-tag SDS-PAGE and immunoblotting with Myc-Tag antibodies.
Phos-tag western blot analysis of (A) wild-type cells or (B) bar1Δ cells treated with 0.3 μM or 3 μM α-factor mating pheromone and probed with anti-Myc tag antibodies to identify dually phosphorylated (pp-Kss1), mono-phosphorylated (p-Kss1), and non-phosphorylated (Kss1) Kss1. pp-Kss1, p-Kss1, and np-Kss1 (first and second graphs) are plotted as % of lane total. Total Kss1 (third graphs) is plotted as % maximum lane signal on the blot. The ratio of dually phosphorylated Kss1 to total Kss1 (bottom graphs) was calculated by dividing the % dually phosphorylated Kss1 in each lane by % total Kss1 in each lane. Data are presented as mean ± standard deviation, N = 3.
Figure A3
Figure A3. Gating of cells for flow cytometry analysis.
Cells were gated based on the heights of their (A) forward- and side-scatter peaks, and then gated based on the level of (B) mCherry fluorescence (C) and GFP fluorescence. (D) Two GFP normalization options (dividing by mCherry and forward-scatter area) were compared with non-normalized GFP. (E) mCherry and (F) GFP fluorescence is shown for untreated cells with no fluorophores.
Figure A4
Figure A4. Microfluidics gradient chamber set-up.
Microfluidics devices are made from a PDMS component with the chamber features and a glass slide. (A) After these two pieces are plasma cleaned, they fuse by creating covalent Si-O-Si bonds. (B) A detailed schematic of the microfluidic device shows how a gradient is created inside of the chamber and (C) shows the intensity of the fluorescent dye across the width of the chamber.
Figure 1
Figure 1. Schematic of pheromone response pathway.
(a) Diagram of an a and an α cell mating to form an a/α diploid. (b) Representation of population-based and single cell assays that quantify each level of the pheromone response.
Figure 2
Figure 2. Phosphorylation of Fus3 by conventional SDS-PAGE and immunoblotting with phospho-p44/42 antibodies.
Western blot analysis of (a) wild-type cells or (b) bar1Δ cells treated with 0.3 μM or 3 μM α-factor mating pheromone and probed with phospho-p44/42 and total Fus3 antibodies. Phosphorylated Fus3 (p-Fus3) and total Fus3 (t-Fus3) were plotted as % of maximum signal on the blot. The ratio of phosphorylated Fus3 to total Fus3 (p-Fus3:t-Fus3) was calculated by dividing % phosphorylated Fus3 by % maximum total Fus3. Data are presented as mean ± standard deviation, N = 3.
Figure 3
Figure 3. Phosphorylation of Fus3 by Phos-tag SDS-PAGE and immunoblotting with Fus3 antibodies.
Phos-tag western blot analysis of (a) wild-type cells or (b) bar1Δ cells treated with 0.3 μM or 3 μM α-factor mating pheromone and probed with total Fus3 antibodies to identify dually-phosphorylated (pp-Fus3), mono-phosphorylated (p-Fus3), and non-phosphorylated (np-Fus3) Fus3. pp-Fus3, p-Fus3, and np-Fus3 (Fus3) are plotted as % of lane total. Total Fus3 (t-Fus3) is plotted as % maximum lane signal on the blot. The ratio of dually phosphorylated Fus3 to total Fus3 (pp-Fus3:t-Fus3) was calculated by dividing the % dually phosphorylated Fus3 in each lane by % total Fus3 in each lane. Data are presented as mean ± standard deviation, N = 3.
Figure 4
Figure 4. Pheromone-induced gene transcription assays.
Dose-response curves for transcriptional output of wild-type and bar1Δ cells after 1.5 hours of treatment with α-factor mating pheromone, obtained by (a) the PFUS1-LacZ and (b) the PFUS1-GFP reporters. Time course of PFUS1-GFP response in (c) wild-type cells and (d) bar1Δ cells. Data are presented as mean ± standard deviation, N = 4.
Figure 5
Figure 5. Flow cytometry transcription assays.
Cells gated based on forward scatter, side scatter and fluorescence (see Figure A3, a–c) were used for (a) dose-response experiments done with wild-type cells in wells that were either untreated or coated with BSA and analyzed either immediately (live cells) or after chemical fixation. (b) Dose-response experiments done with wild-type, gpa1G302S, and bar1Δ cells in BSA-coated wells were analyzed immediately or after chemical fixation. Data were fitted using the sigmoidal dose-response in Prism (GraphPad). Data are presented as mean ± standard deviation, N = 4.
Figure 6
Figure 6. Imaging cytometry analysis.
Images of the half-area wells of a 96-well plate were captured by the imaging cytometer. (a) The cells were then segmented based on the brightfield image using the Celigo (Nexcelom) native brightfield algorithm and gated based on GFP fluorescence and aspect ratio to identify individual cells. Only singlet cells shown in red in the rightmost panel of (a) were used for single-cell analysis. (b) Distributions of GFP intensity normalized by size and mCherry intensity. (c) Dose-response experiments done with wild-type cells in wells that were either untreated or coated with BSA. (d) Dose-response experiments done with wild-type, gpa1G302S, and bar1Δ cells in BSA-coated wells. Time courses are shown for (e) wild-type, (f) gpa1G302S, and (g) bar1Δ cells. Representative single-cell traces of the response to 3 μM α-factor are shown for (h) wild-type and (i) gpa1G302S strains. (j) The cell-to-cell variability is quantified over time for representative traces. Data are presented as mean ± standard deviation, N = 3.
Figure 7
Figure 7. Microfluidics for pheromone-induced polarization.
Wild-type (n=48), gpa1G302 (n=47), and bar1Δ (n=82) cells were exposed to a gradient of pheromone. (a) Representative Bem1-GFP fluorescence microscopy images, (b) polar histograms of the angles of the direction of polarized growth, (c) representative single-cell traces of polar caps, and (d) representative kymographs of GFP intensity around the edge of the cell.
Figure 8
Figure 8. Kinase translocation reporter for Fus3 activity.
Time traces of reporter responses to 3 μM (solid line) and 0.3 μM pheromone (dashed line) are shown for (a) wild-type, (b) gpa1G302S, and (c) bar1Δ. Shaded areas represent S.E. Representative single cell time traces of Fus3 activation are shown for cells treated with 3 μM and 0.3 μM pheromone. The reporter response was quantified as cytoplasmic over nuclear fluorescence intensities (C/N ratio).

References

    1. AkhavanAghdam Z, Sinha J, Tabbaa OP, & Hao N (2016). Dynamic control of gene regulatory logic by seemingly redundant transcription factors. ELife, 5 10.7554/eLife.18458 - DOI - PMC - PubMed
    1. Alvaro CG, & Thorner J (2016). Heterotrimeric G Protein-coupled Receptor Signaling in Yeast Mating Pheromone Response. The Journal of Biological Chemistry, 291(15), 7788–95. 10.1074/jbc.R116.714980 - DOI - PMC - PubMed
    1. Andrews SS, Addy NJ, Brent R, & Arkin AP (2010). Detailed simulations of cell biology with Smoldyn 2.1. PLoS Computational Biology, 6(3), e1000705 10.1371/journal.pcbi.1000705 - DOI - PMC - PubMed
    1. Ansel J, Bottin H, Rodriguez-Beltran C, Damon C, Nagarajan M, Fehrmann S, … Yvert G (2008). Cell-to-cell stochastic variation in gene expression is a complex genetic trait. PLoS Genetics, 4(4), e1000049 10.1371/journal.pgen.1000049 - DOI - PMC - PubMed
    1. Apanovitch DM, Iiri T, Karasawa T, Bourne HR, & Dohlman HG (1998). Second site suppressor mutations of a GTPase-deficient G-protein alpha-subunit. Selective inhibition of Gbeta gamma-mediated signaling. The Journal of Biological Chemistry, 273(44), 28597–602. - PubMed

Publication types

MeSH terms

Substances