

African evolutionary history inferred from whole genome sequence data of 44 indigenous African populations
- PMID: 31023338
- PMCID: PMC6485071
- DOI: 10.1186/s13059-019-1679-2
African evolutionary history inferred from whole genome sequence data of 44 indigenous African populations
Erratum in
-
Correction to: African evolutionary history inferred from whole genome sequence data of 44 indigenous African populations.Genome Biol. 2019 Oct 9;20(1):204. doi: 10.1186/s13059-019-1821-1. Genome Biol. 2019. PMID: 31597575 Free PMC article.
Abstract
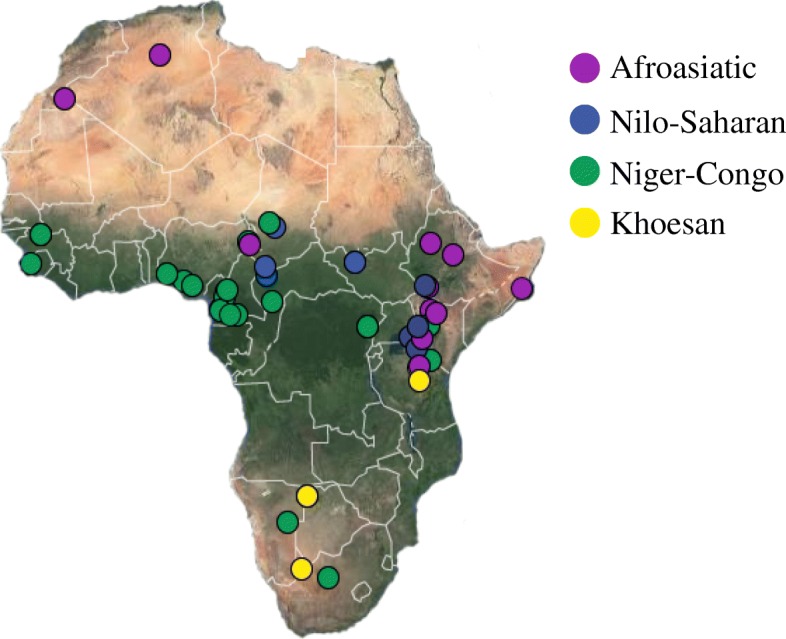
Background: Africa is the origin of modern humans within the past 300 thousand years. To infer the complex demographic history of African populations and adaptation to diverse environments, we sequenced the genomes of 92 individuals from 44 indigenous African populations.
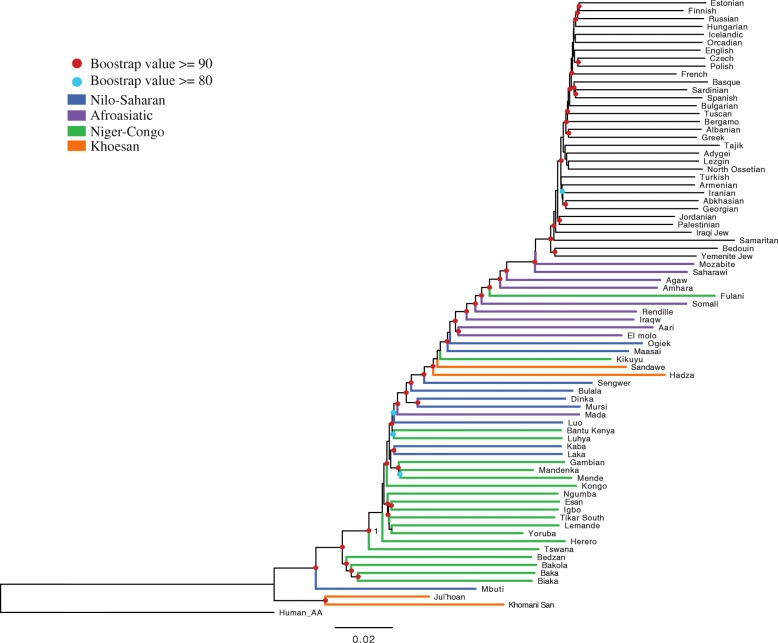
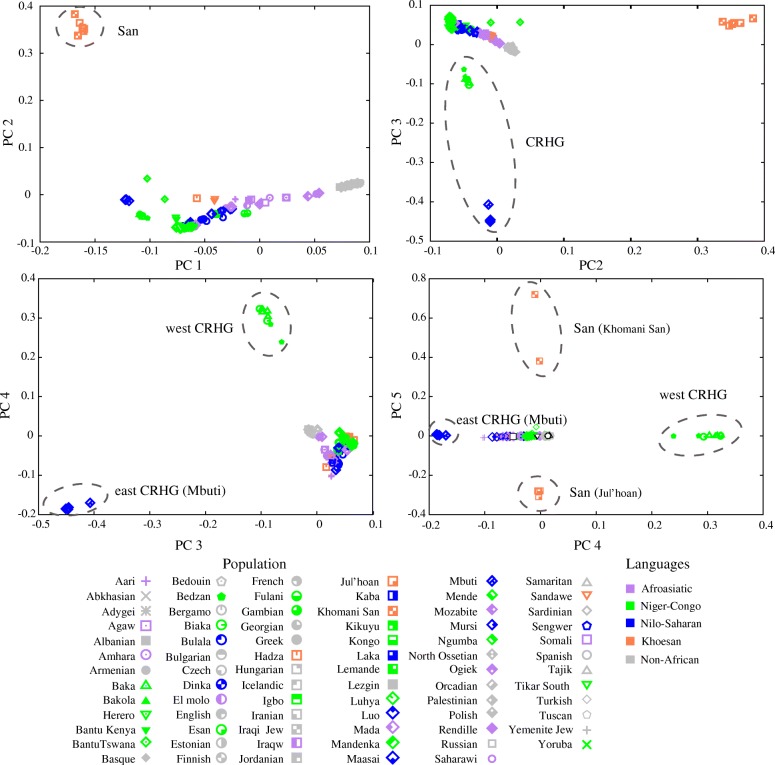
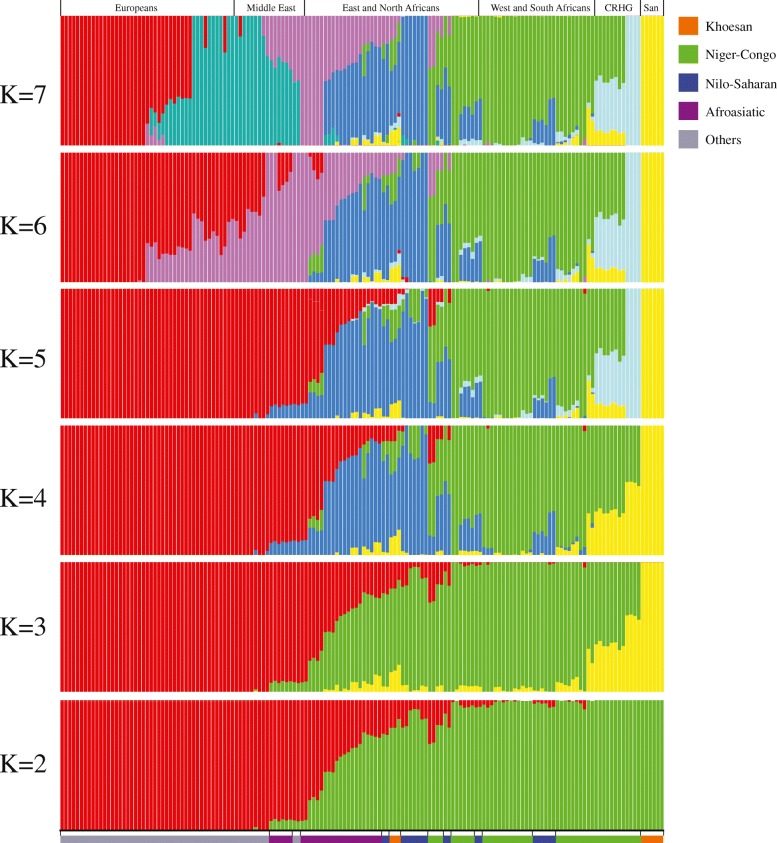
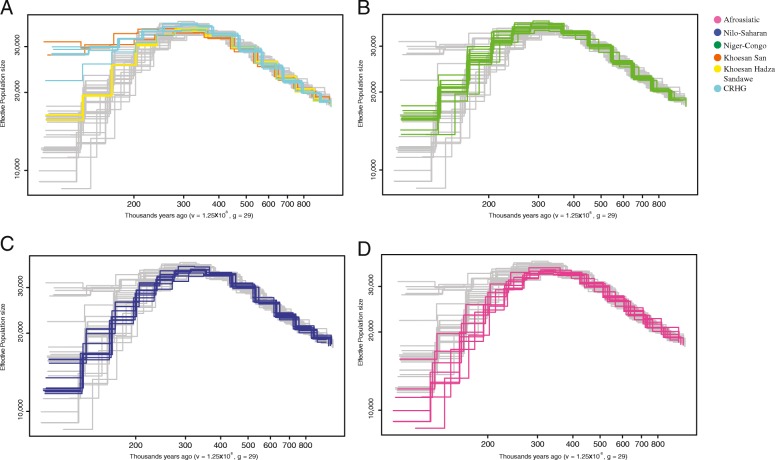
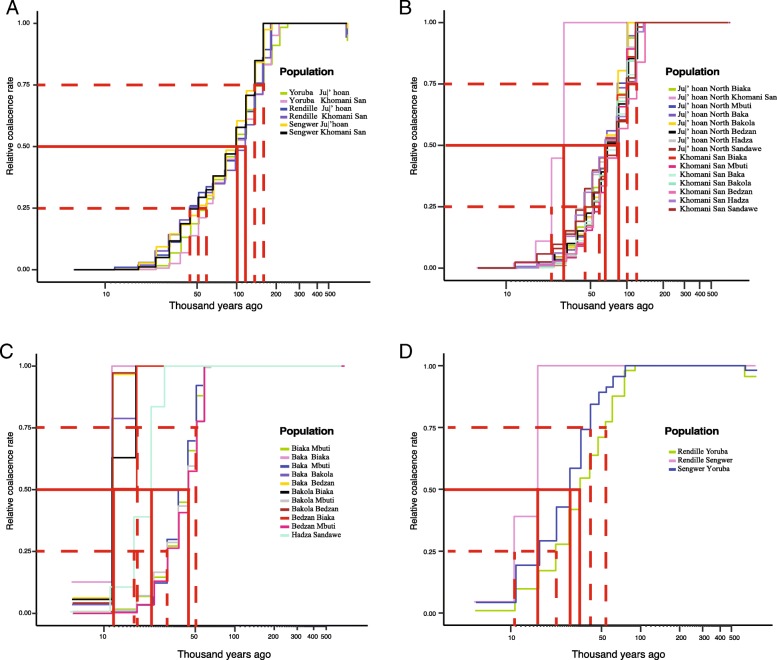
Results: Genetic structure analyses indicate that among Africans, genetic ancestry is largely partitioned by geography and language, though we observe mixed ancestry in many individuals, consistent with both short- and long-range migration events followed by admixture. Phylogenetic analysis indicates that the San genetic lineage is basal to all modern human lineages. The San and Niger-Congo, Afroasiatic, and Nilo-Saharan lineages were substantially diverged by 160 kya (thousand years ago). In contrast, the San and Central African rainforest hunter-gatherer (CRHG), Hadza hunter-gatherer, and Sandawe hunter-gatherer lineages were diverged by ~ 120-100 kya. Niger-Congo, Nilo-Saharan, and Afroasiatic lineages diverged more recently by ~ 54-16 kya. Eastern and western CRHG lineages diverged by ~ 50-31 kya, and the western CRHG lineages diverged by ~ 18-12 kya. The San and CRHG populations maintained the largest effective population size compared to other populations prior to 60 kya. Further, we observed signatures of positive selection at genes involved in muscle development, bone synthesis, reproduction, immune function, energy metabolism, and cell signaling, which may contribute to local adaptation of African populations.
Conclusions: We observe high levels of genomic variation between ethnically diverse Africans which is largely correlated with geography and language. Our study indicates ancient population substructure and local adaptation of Africans.
Keywords: African populations; Demographic history; Effective population size; Genomic variation; Human evolution; Local adaptation; Whole genome sequencing.
Conflict of interest statement
Ethics approval and consent to participate
Written informed consent was obtained from all participants, and research/ethics approval and permits were obtained from all relevant institutions in the Simons Genome Diversity Project. The IRB approval number for Harvard Medical School (#11681), most recently re-reviewed on July 122,017 (MOD-11681-01). The experimental methods in this study comply with the principles of the Helsinki Declaration.
Competing interests
The authors declare that they have no competing interests.
Publisher’s Note
Springer Nature remains neutral with regard to jurisdictional claims in published maps and institutional affiliations.
Figures
Comment in
-
The long walk to African genomics.Genome Biol. 2019 Jun 27;20(1):130. doi: 10.1186/s13059-019-1740-1. Genome Biol. 2019. PMID: 31248437 Free PMC article. No abstract available.
References
-
- Heine B, Nurse D. African languages: an introduction: Cambridge University Press; 2000.
Publication types
MeSH terms
Grants and funding
LinkOut - more resources
Full Text Sources
Miscellaneous
